Have you ever wanted to quickly search for stocks with massive options flow divergences? or stocks with a gradual build-up of calls/puts etc., in large quantities?
All of these types of scans can help in figuring out institutional "footprints" that one can detect and jump in on the move before they are about to happen.
You can now scan thousands of stocks every day from our built-in options flow scanner - integrated right into your dashboard!
This tab can be accessed in your dashboard by clicking on the "Options flow scan" tab under the "Overview" section on the left side of your TradesViz home page.
The page is divided into multiple sections. The image below should give you an idea of how it is split:
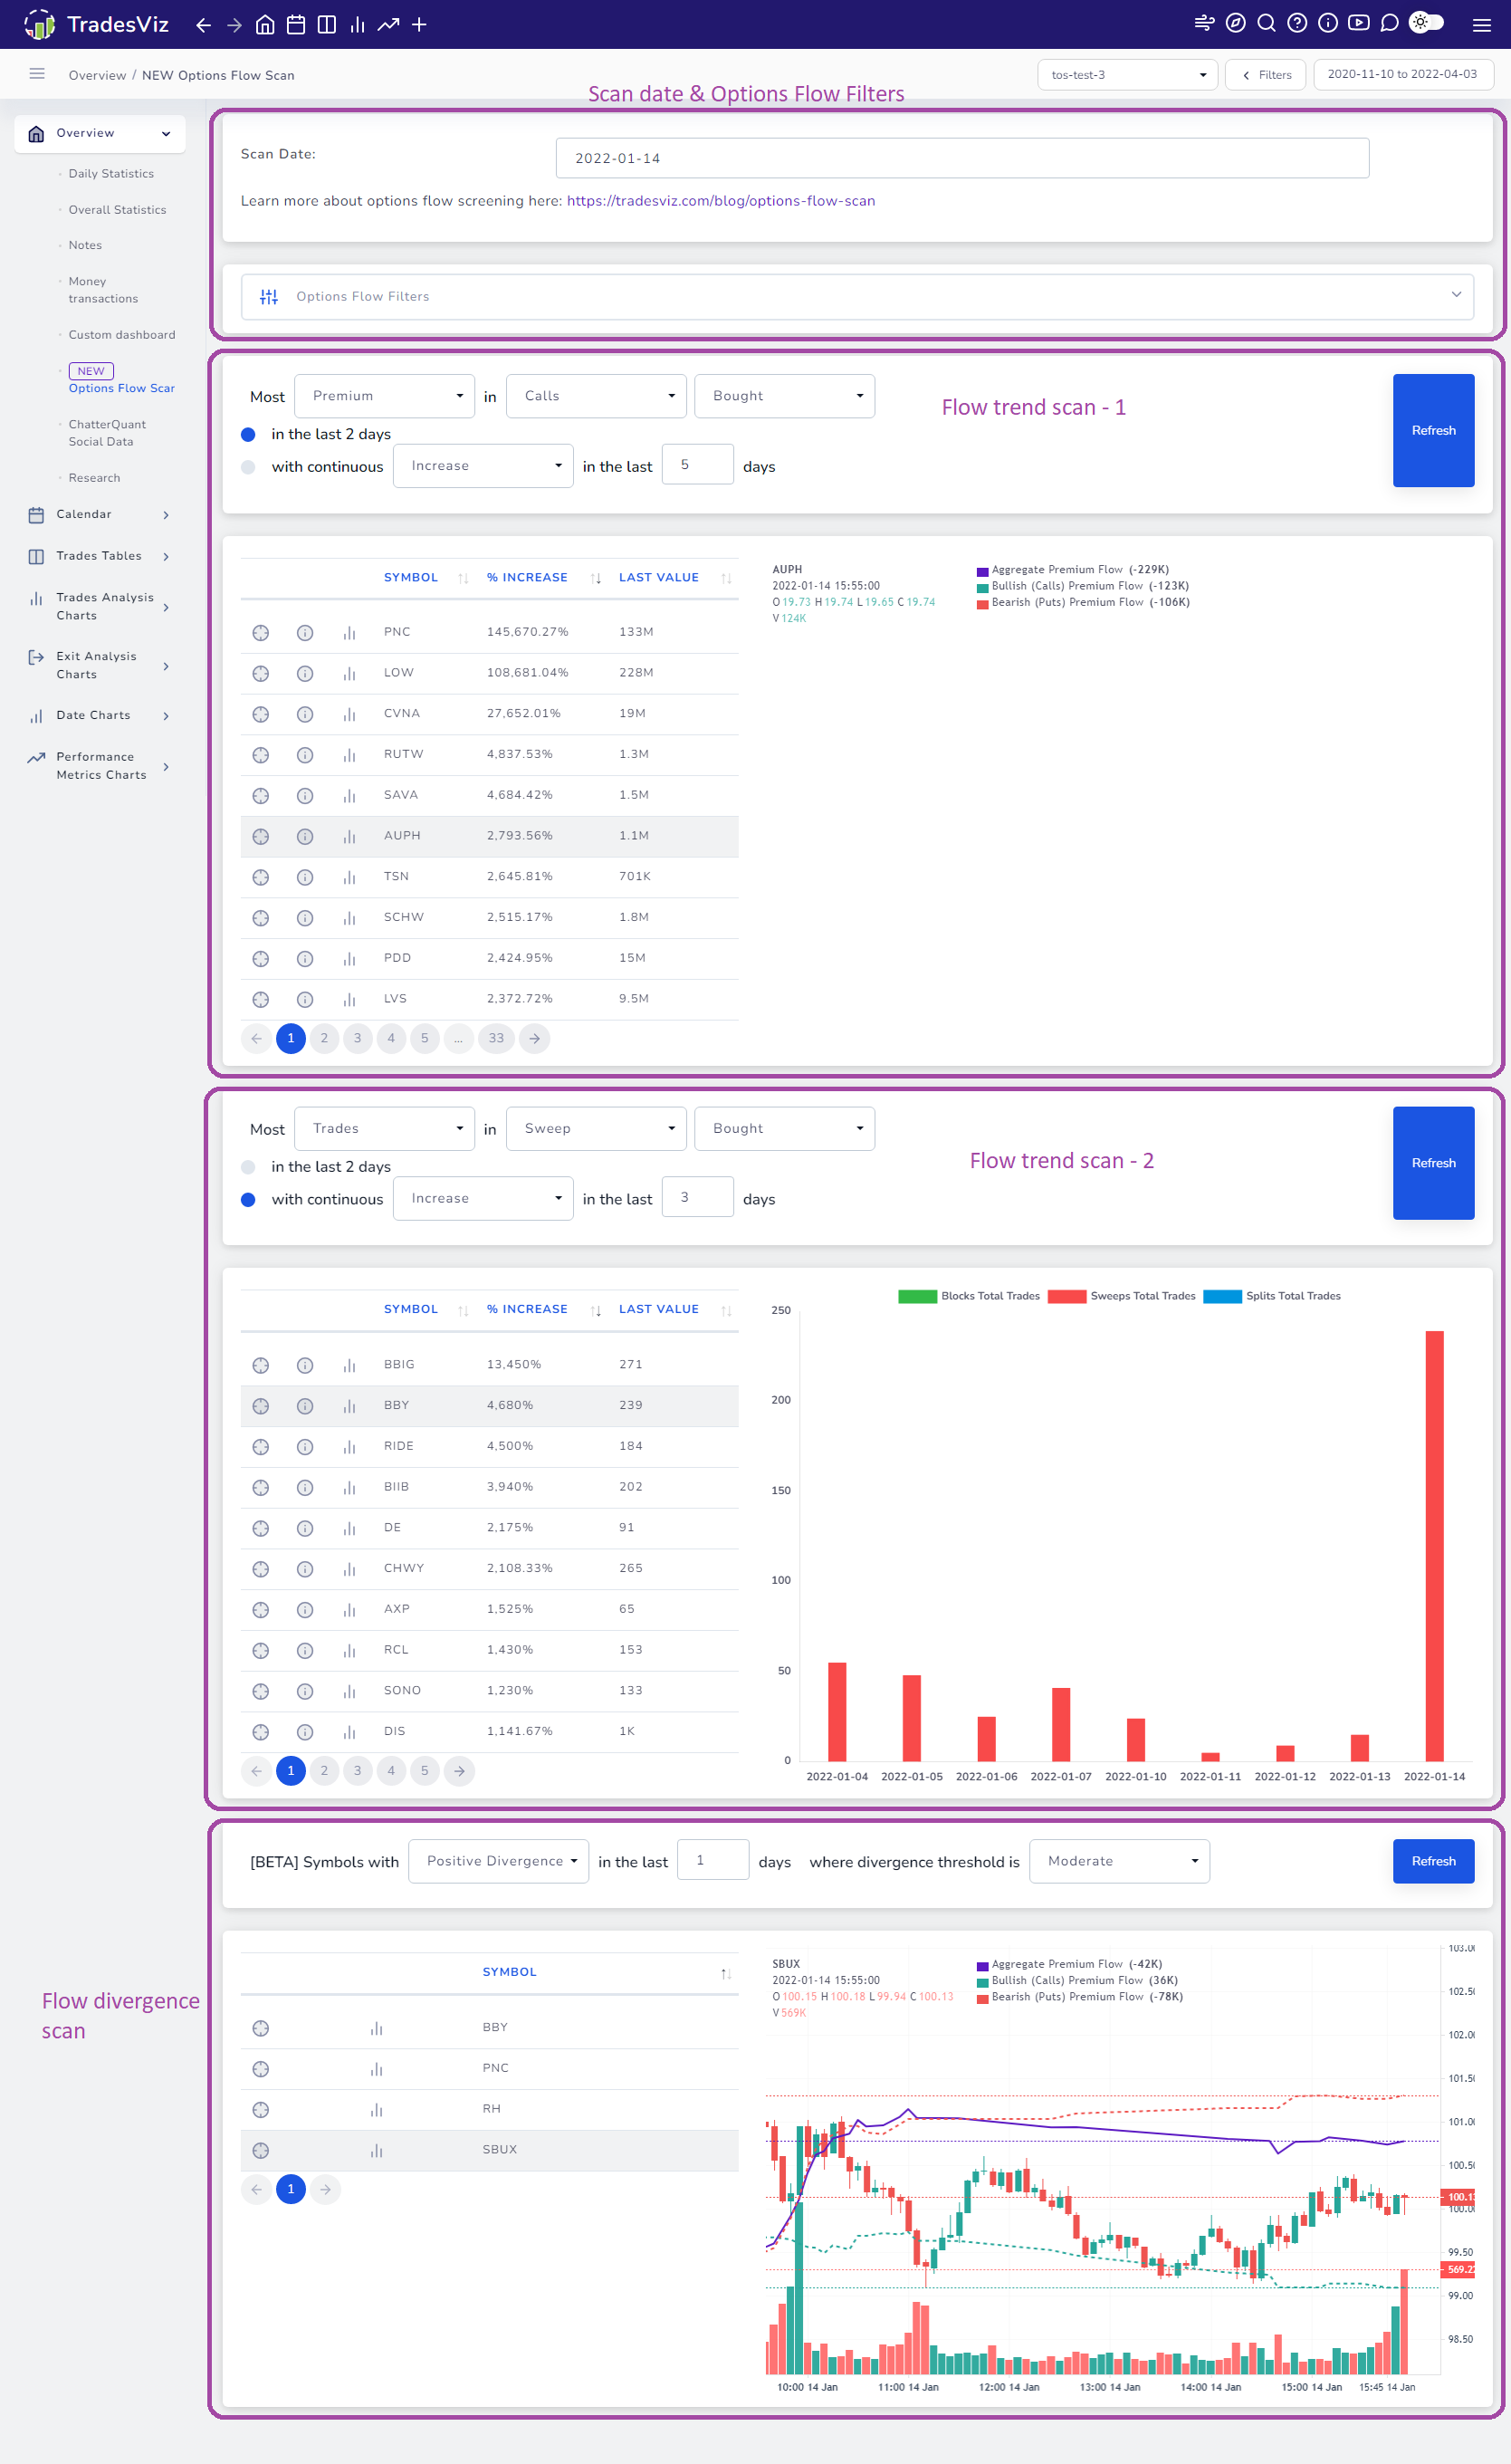
The 4 sections are:
- Date & Options flow filters: The date on which you want to run the scan + 20 different filters to fine-tune your scan results.
- Options flow scan 1: Scan for trends in attributes such as premium, trades, etc., filtered based on the buy/sell side, grouped by either call/put or also the type of options flow.
- Options flow scan 2: Same as above - another instance of it so that you can compare results of 2 different scan results if you want.
- Divergence scan: Scans for divergences in price vs flow of a stock based on various criteria
Options flow scan
This is a scanner that helps you find different trends based on the increase/decrease of quantity of a particular trade attribute. For example, you can execute the following scans as an example:
- "Find stocks where the total buy-side calls premium has been increasing in the last 3 days"
- "Find stocks where the no. of trade % has increased a lot in the last day"
- "Find stocks where the no. of put sweeps sold are decreasing for the last 5 days"
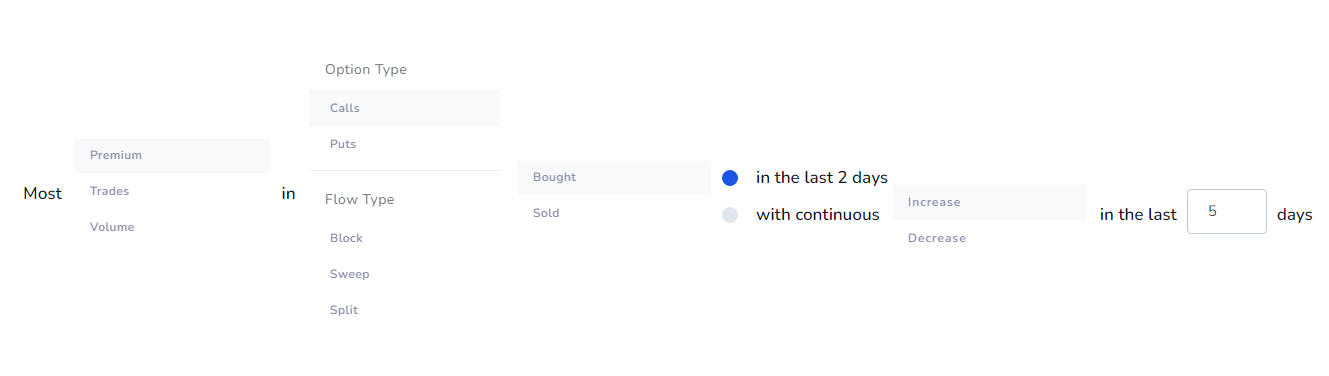
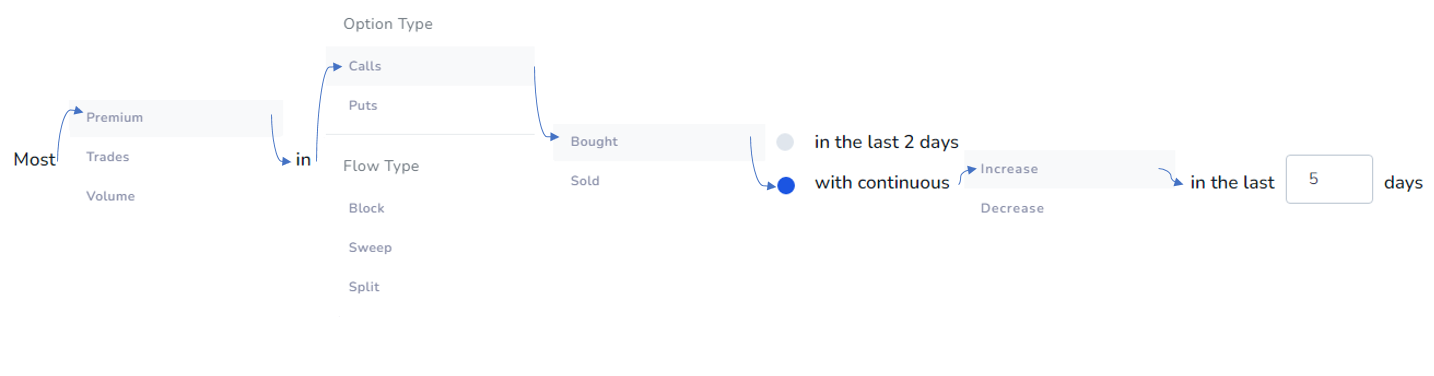
Here's the full list of options that allows you to construct such flexible queries:
Instead of going through the biggest flow every day, then filtering again, and then looking through each stock's statistics, this scan cuts all those steps down to a single scan and gives you exactly what you want.
Here is a working example: "Find stocks with a continuous increase in the premium of calls in the buy-side for the last 5 days"
and here's the result:
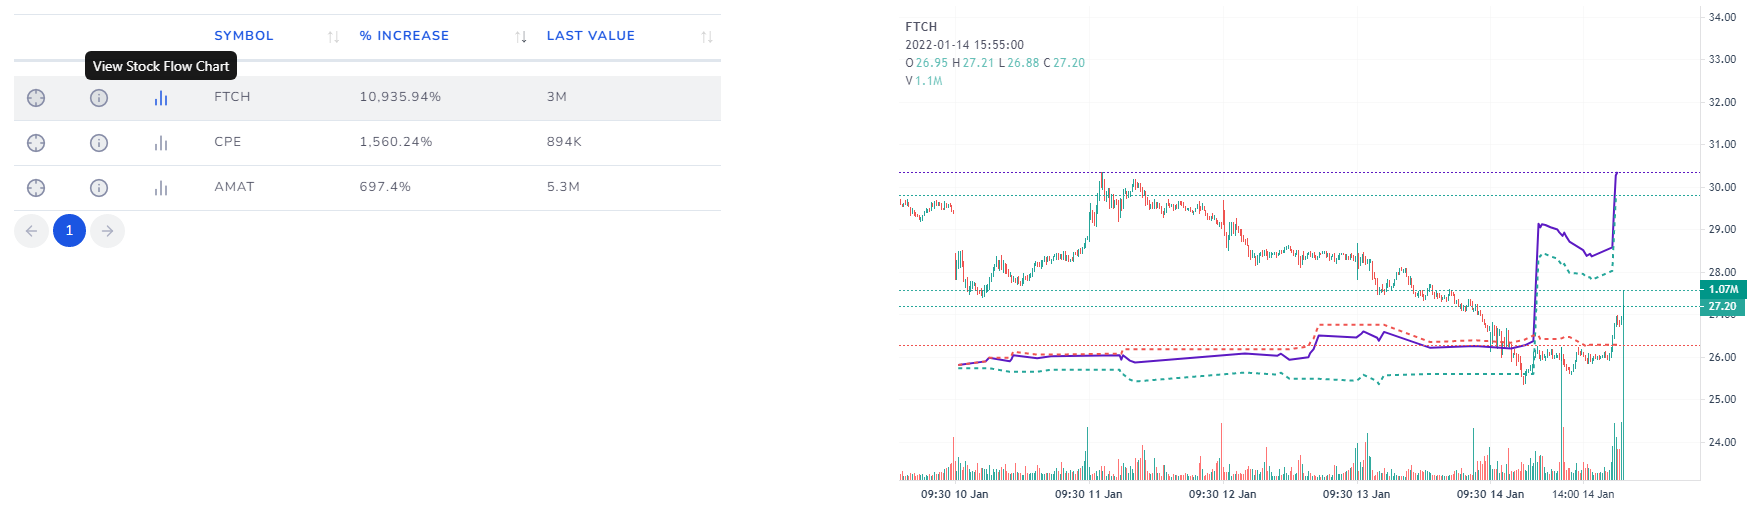
You have possibly found a very interesting entry with this!
But wait... does this mean the stock is going to rise up in price soon? No.
Don't fall into the trap of using just one data point alone in determining your side bias and deciding your strategy. In fact, what has happened next few weeks for this stock is the complete opposite of your expectation. Look up the full chart and explore the detailed options flow to know why.
Some reasons and caveats:
- Expiry of calls matter
- The flow type of call trades matter
- The strike price of calls matter
This is why options flow filters exist. Use them properly and this is the ONLY tool you will need to do both swing and intraday trading of both stocks and options. Historical data for scanning is available from 1st Jan 2022.
Note that on the table, you will see 3 buttons:
- Target button: Click on it to explore the symbol's full options flow analysis (redirects to the options flow dashboard of TradesViz)
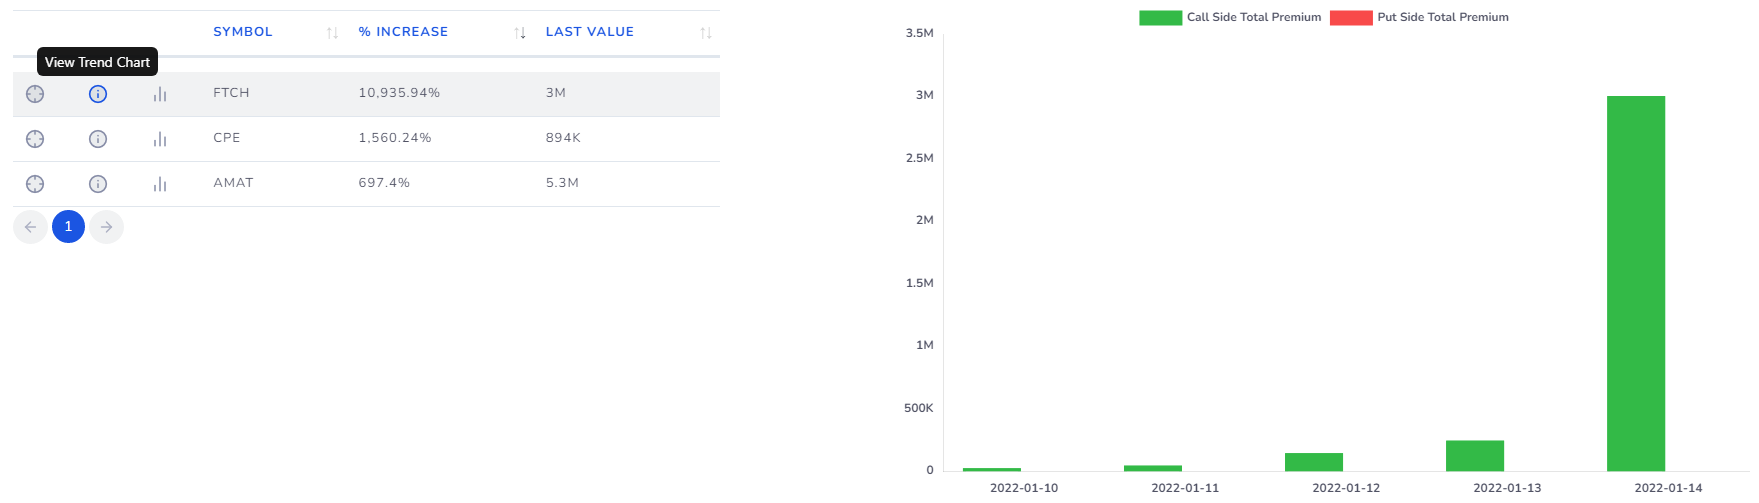
- Info button: Click on it to see the trend of the value in the query you executed the scan for - in the example above, it's the calls premium.
- Chat icon: Clic on it to see the 5m chart plotted with the total flow, calls flow, and puts flow.
Divergence scan
What happens when the pattern of the flow of the stock is completely opposite to that of the trend of the price? Is a correction going to happen soon? First, we need to find such stocks and it can be difficult to do so. This screen helps you do that.
The scan conditions are very simple here. Positive divergence means the flow is above the price of the stock in trend and vice-versa for negative. But this is not a "hard" condition since such trends are difficult to estimate with 100% accuracy. The divergence threshold decides how much should the distance be between the trend of the flow and the trend of the price. If you want to see larger divergences, then choose a higher threshold. However, for most cases, it's recommended to use the moderate setting.
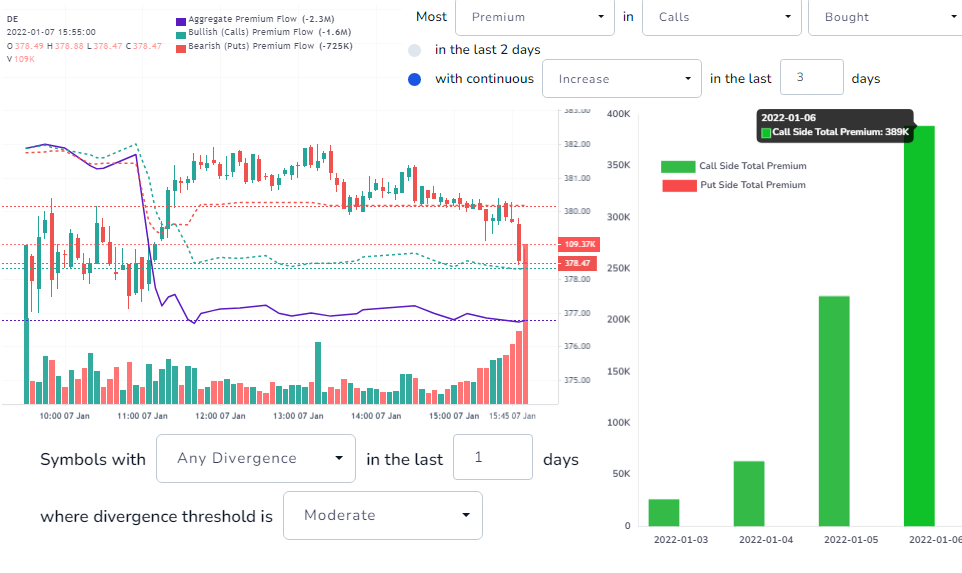
Here is an example of a positive divergence scan:
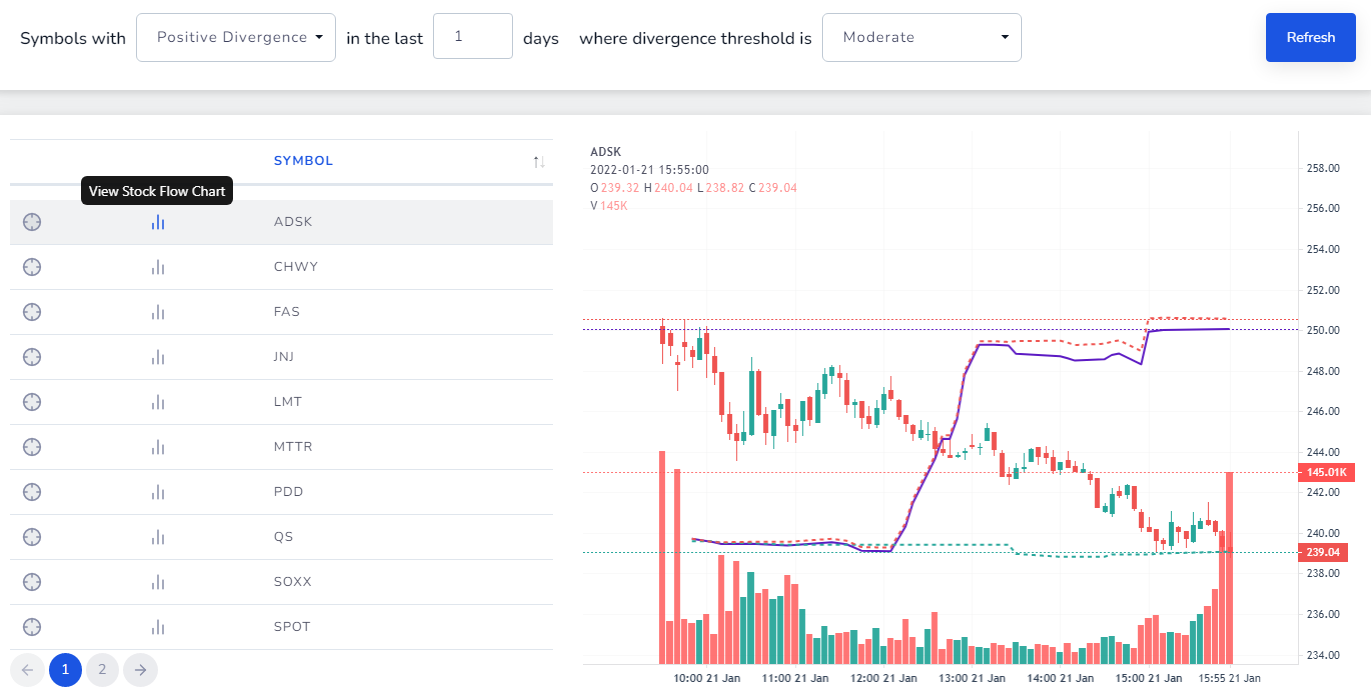
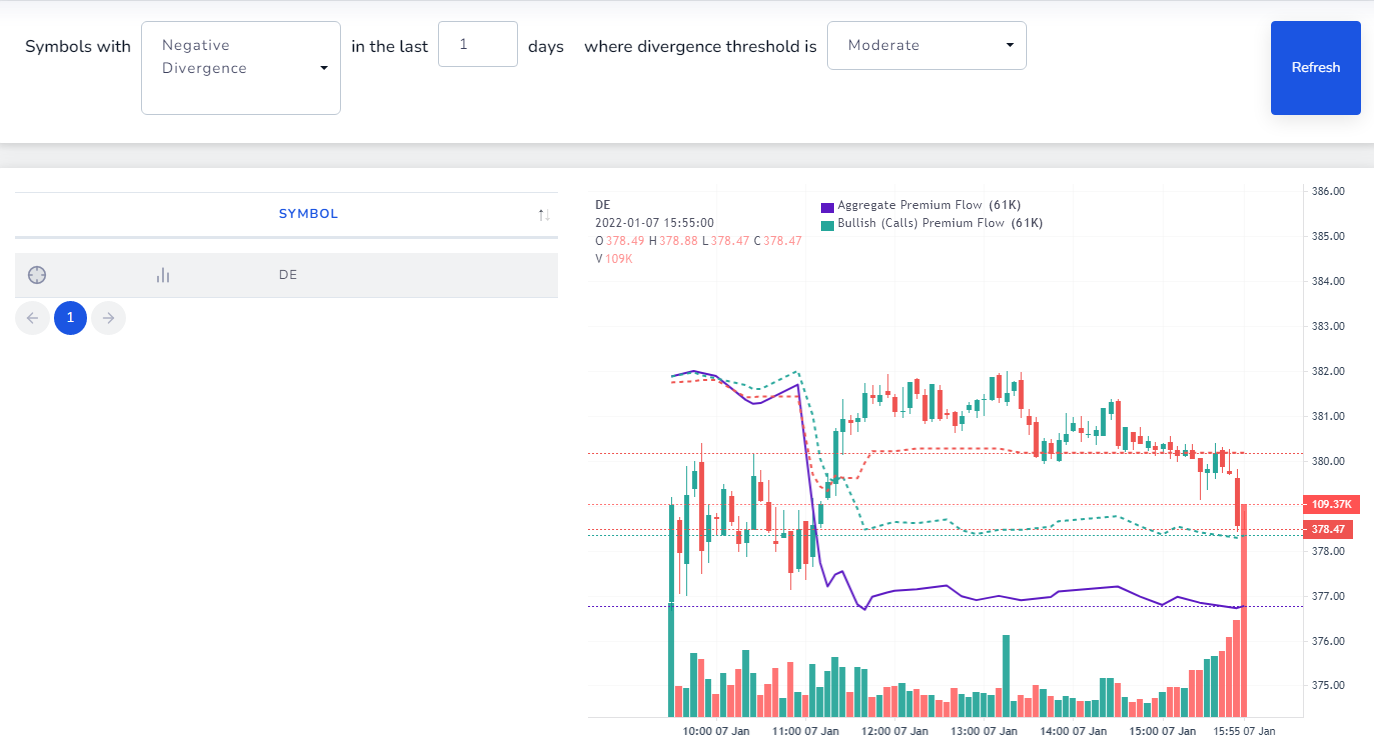
Note that the above also qualifies for the "high" divergence threshold! Below is an example of negative divergence:
We suggest using this in combination with our options flow dashboard to find the right stocks to trade every day! It is also useful to make notes of these scans and even take pics and store them in your notes section (which can be viewed easily in the notes section)
It might take a week or two to get used to how nuances of options flow and how the market behaves according to the premium flow accumulation, but remember that it's not just premiums you can scan - it's also the no. of trades and the volume traded that you can scan for. That's the main reason why we have 2 instances of the same scanner in the dashboard - for you to compare between different scans and find the best stock to trade.
We hope this helps you navigate the stock/options market with ease! TradesViz can be your complete all-in-one trading assistance with all our new options features. If you are interested, please check out the platinum plan which has all these features!
Update 8th June 2022
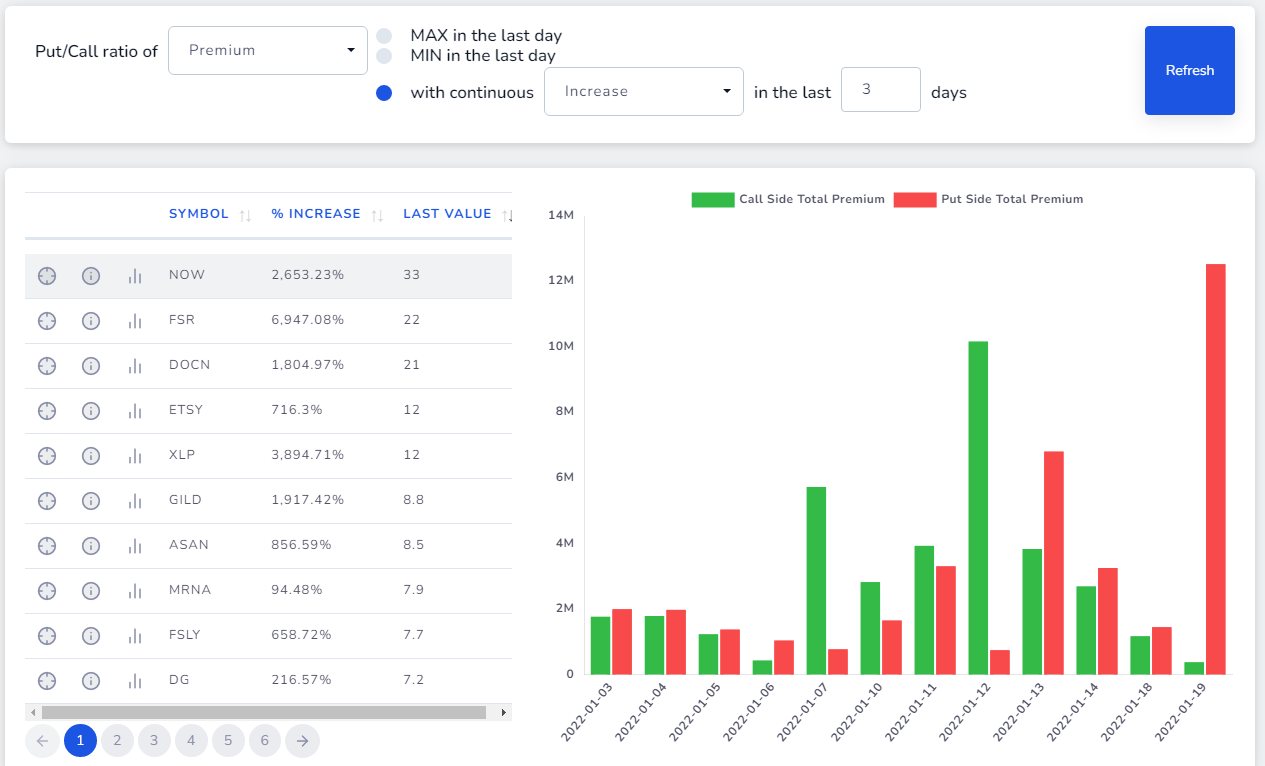
We have now added a separate section for put/call ratio-based scanning - i.e, you can scan for increases/decreases in ratios of puts/calls with respect to premiums, trades were taken or trade volume with this. Here is an example:
Let us know your feedback, feature requests, and questions at [email protected]!