This post isn't going to be journaling at all. This is all about the most used non-journaling feature on TradesViz: Trading simulators. We will dive deep into all the different simulators, their functions, and also backtesting on TradesViz. Finally, we will focus on how you can leverage all of these tools to improve your trading. Think of this as a workout plan to build your trading gains every day!
Simulation vs Replay vs Backtesting
First, let's clear some things up. We want to be very clear about terminology (for example: Execution vs Trade) because trading education and content online is already a mess. New traders are struggling to navigate this misinformation overload contributed by other trading services purely to drive clicks/views/subscriptions.
The words simulation, replay, and backtesting have been thrown around pretty much interchangeably for the last few years. The word backtest has a long history whereas simulation and replay are relatively new. Here are our clear-cut definitions of these terms:
Simulation: When you manually try an activity under the same conditions as the real activity. In trading, simulation should be used when one (paper) trades a stock/option, etc., using real or simulated data in non-live conditions i.e, no money is involved in the activity but you are still performing the same actions as you would if you were to trade in a live market.
Replay: When you simulate (automatically place trades) a trade you made in the past, is called replay. Unlike just simulation, in this case, you will see your executions automatically being played (in most cases) as you are seeing a video of your trade as it happened as you traded. Replay involves simulation. Replay is mostly an automated, hands-off activity where you just observe what has happened because if you were to actively involve yourself by manual intervention, it becomes just a simulation (paper trading).
Backtesting: When a trading system (set of entry-exit rules for buying, and selling asset types) is tested on a large set of historical data, this is called backtesting. There is no manual intervention. There is no manual trading - otherwise, this becomes simulation (thus, now you understand why there is confusion and why our definitions are clear). The primary goal of backtesting is to get the result of a trading system (Alpha/Beta, Portfolio return, various ratios, etc., )tested on a large set of data (days, weeks, months, years) with minimal effort.
What is available in TradesViz?
All of the above.
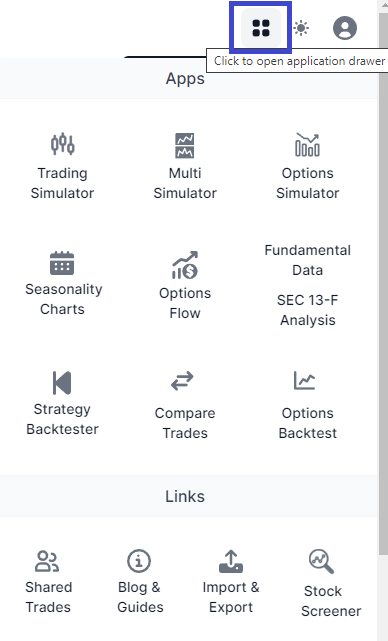
Try checking the tools section by clicking on the tools/applications button at the top right corner.
Yes, you read that right. We don't do with false promises, half-baked features, or misleading feature lists. You get what you see on the box.
- Our in-depth forex, stock, and futures simulator blog post: https://www.tradesviz.com/blog/tradingsimulator-features/
- Our in-depth options simulator: https://www.tradesviz.com/blog/options-tradingsimulator-features/
- Our trade replay system: https://www.tradesviz.com/blog/replay-trades-simulator/
- Our backtester: https://www.tradesviz.com/blog/backtester/
(P.S. If you were to buy/subscribe to these tools separately, they would cost you at least $200+ per month. Don't believe us? Try comparing prices! Meanwhile, TradesViz with all the above features + the best journaling system costs around that much *per year*.)
Interested in learning more? Read on.
Simulation and Replay
In the first section, we will discuss simulation and replay as the latter is a simple extension of the former.
Asset types & Data availability
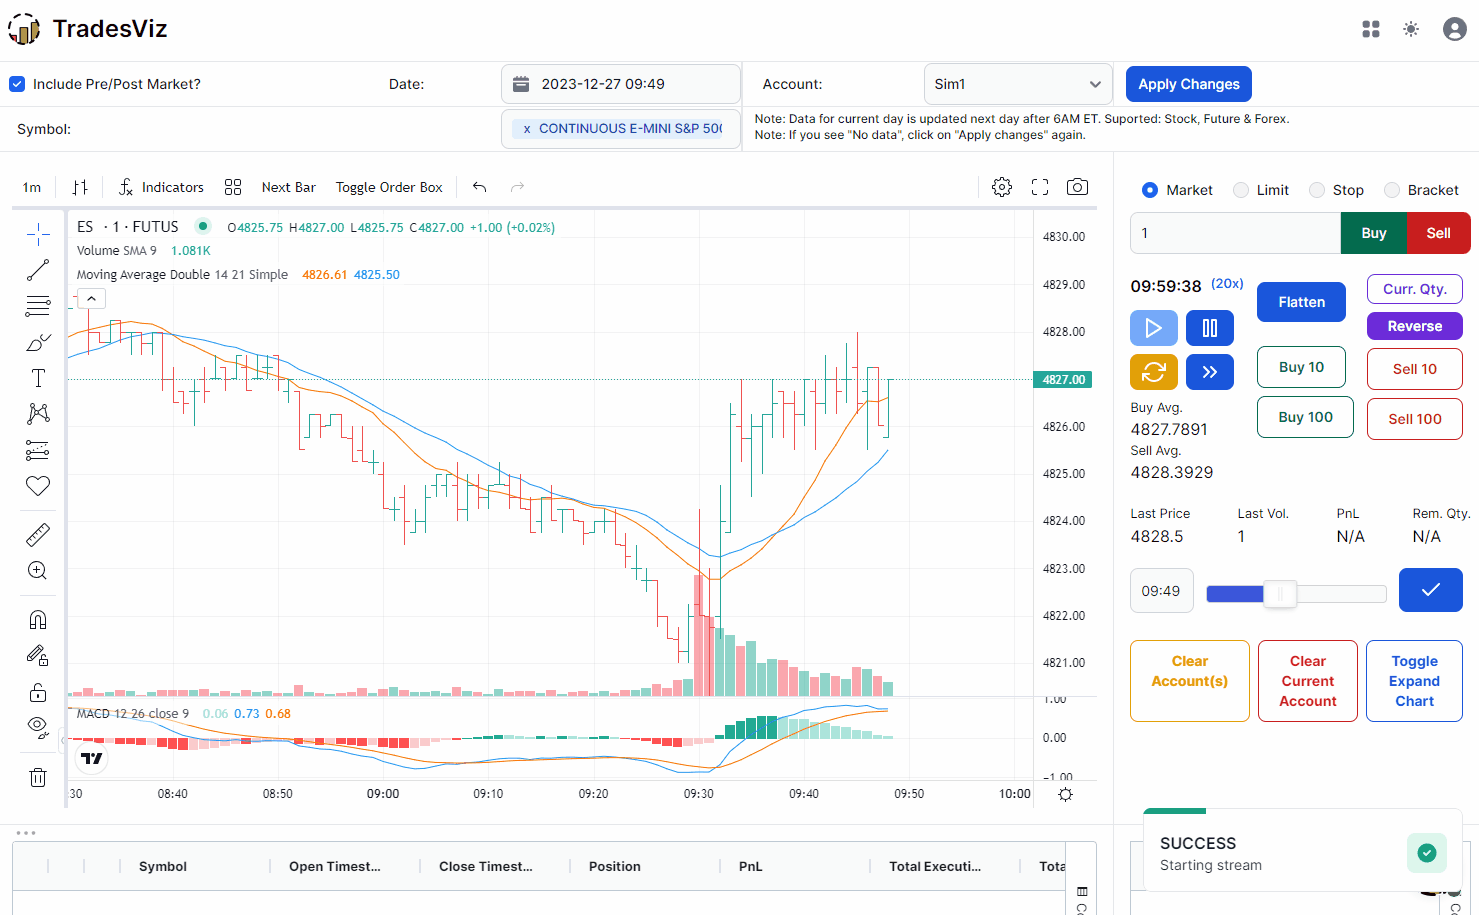
TradesViz is the only online platform to support trading simulation (historical data) for Equities/ETFs, Futures, Forex, and Equity/Index Options. You get access to simulation of more than 15,000 symbols since mid-2021 (continually added to the database since then). All of our simulations run on a min. of 5-sec data resolution so you can view 5-sec bars in charts for ANY of the supported stock/future/forex on TradingView charts. Data for simulation is updated every day ~3-6 am ET (total of ~24 hrs delay). To be clear, we do NOT have live data. The purpose is to learn, practice, and get better at trading. At this time, almost all brokers offer paper trading options so there's no need to reinvent the wheel there - Our focus is on providing a holistic environment to help you become a better trader over time.
We will explore the chart-based simulations - for forex, future, and stock separately and then we will look into the options chain simulator.
Stock, Future, Forex simulation
Out of the two simulators we have (chart-based, options chain) this is the most used as the no. of stock + future + forex traders far outnumber option-only traders. Moreover, unlike other trade simulation systems, TradesViz offers sub-minute 5-sec bars for simulation which is not offered anywhere else. On top of this, all your trades are automatically journaled, so you can utilize the full power of TadesViz's analytics system to analyze your simulated trades later on.
In this sub-category of simulators, we have 2 further categories: Single chart simulator and multi-simulator. The latter is an extension of the format built for different purposes and to simulate a trading environment with many charts at the same time. We will explore all the features in depth in the sections below.
Single Simulator
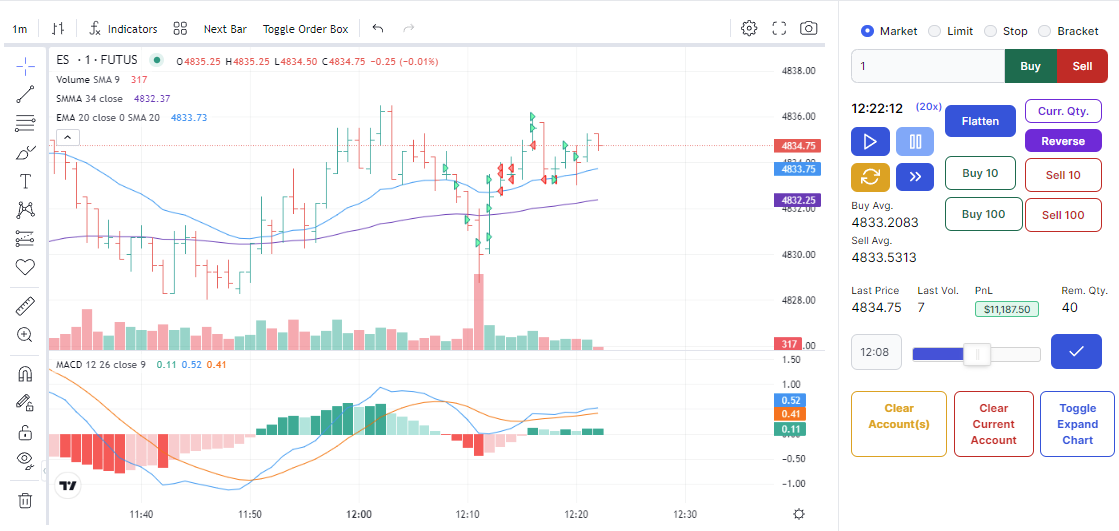
This is the TradesViz single chart simulation in action. In the above GIF, you are seeing trades being placed in ES futures on a simulator that is running at 80x speed.
Account system
First, recall that a simulator requires manual intervention - i.e. you are placing orders and trading. So where are trades stored? Many online solutions do not store them and only allow you to view the current session. That's not the case in TradesViz.
Once you select a trading account at the top right corner, ALL your simulated trades will be put there JUST like a normal trading account at your brokerage. This is treated the same as the trading accounts you have for your trades imported/synced from your brokers - charts are auto-generated, stats are auto-generated, and you can add notes, and tags, and analyze everything.
This makes the TradesViz trading simulator perfect for learning and also looking back at what you have learned and done so far.
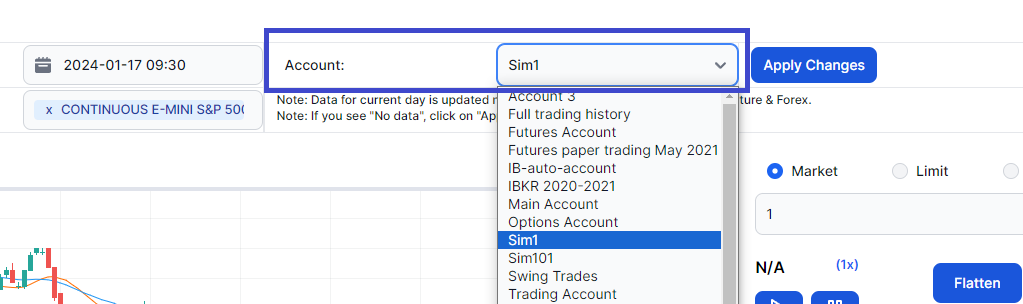
Note: Be careful not to use your real trading account or broker-imported trading account for the simulator. Create a new trading account and use that because once your simulated trades get mixed with your other trades, there is no way to differentiate it (other than by symbol, time, pnl, etc.,) as it's treated just like another trade by the system.
Placing an order and operating the simulator
Now we come to the "manual intervention" part of the simulator - placing trades. We wanted this to be as close to a trading terminal as you would find in a common desktop or website-based real trading platform. That means fast executions, shortcuts, easy access buttons, and easy order management.
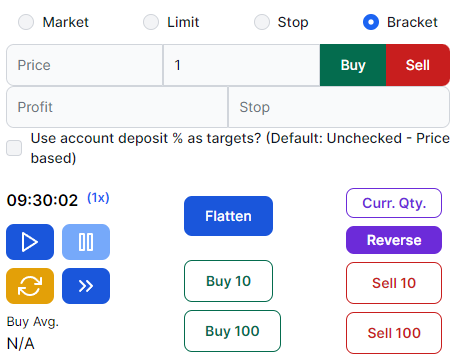
With the above console, you can:
- Place market, limit, stop, and bracket orders and adjust them via the chart (mouse dragging)
- Flatten, buy certain quantities at the current order type quickly
- Reverse, exit, or double the current position with a single button
- Play, pause, reset, and speed up to 100x
- View your live average buy/sell price and also live pnl (not shown in the image above but it's right below the buy/sell 100 buttons).
- Use shortcuts
- Ctrl/Cmd + Space: Play/Pause
- Alt+Q: Buy at the market price the quantity mentioned in the quantity box
- Alt+W: Sell at the market price the quantity mentioned in the quantity box
Regarding bracket orders, a recent addition is that you can also use your account deposit as the %. For example, if you wish to risk 1% of your account, just enter 1 and check the "use account deposit % as target" checkbox. A prerequisite of this is you should already have deposits entered in your Equity curve tab for the selected simulation account.
The video below shows all of the above actions:
Targets/stop losses
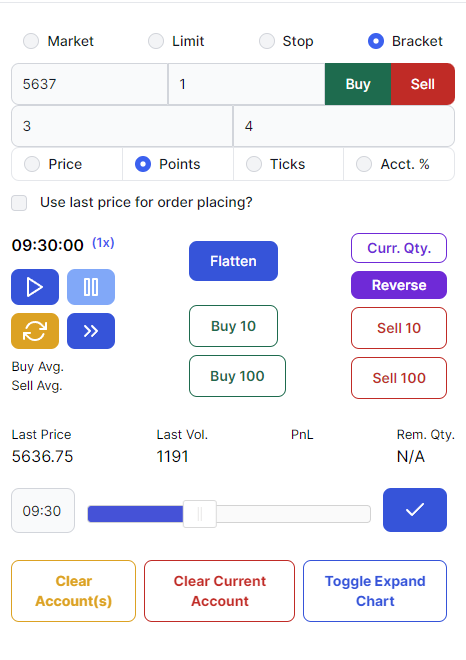
There are 4 types of orders you can place in the simulator:
- Market: Places a buy/sell order last the current market (last price) - This is used when you want to get your order filled as quickly as possible. This is primarily used by scalpers and in case you want to get out of a position quickly.
- Limit: This order type requires you to enter a price. This price is the lowest you are willing to sell at or the highest you are willing to pay for an order. Once placed, the order will be triggered only when the current price matches is lower than or equal to your limit price if you are buying or when the current price is higher than or equal to your limit price if you are selling.
In the above example, we placed a limit buy at the beginning for 4768 when the prices were well below that range, and the order was immediately filled at the best price (NBBO). Why? The order means "The maximum price I'm willing to pay to buy this asset type is 4768" and since the prices were below this range, the order was filled immediately.
For the next order, we placed a short trade at the same price. Nothing was filled. Why? The order means "'The minimum price I'm willing to sell at is 4768". But the current/last price was well below the range we wanted to sell at so nothing was filled until eventually the prices moved (and we also moved the target) to a certain range where the current prices matched our limit price.
Use this order type if you are waiting for a certain price range to be hit based on your strategy. It can be using a certain resistance/support level or certain price level based on indicator values/calculations or chart patterns etc., - Stop: This order type also requires you to enter a price. A lot of traders are often confused by the differences between stop and limit orders. We will try to make this clear using the examples below. A stop order is used when you want to be filled exactly when the current price reaches a certain price point (this is the stop price). This is the key difference between stop and limit orders: waiting for the price to reach the target price vs the price simply being lower or higher than your price level.
In the above example, we place the same 4768 price stop order - nothing gets filled. We also placed a 4768 limit order which gets filled immediately while the stop order remains unfilled. Why? because prices have not reached 4768 yet, so stop order remains unfilled whereas, prices were below our limit price so it got filled at the best price immediately.
We again placed another stop order at 4767 and even lowered it to below the current price and it still does not get filled. Why? because again, the prices have NOT reached our stop price level. Finally, after a few bars, the prices reach that level and our order is filled.
- Bracket: Once you have understood the concept of stop orders, bracket orders are easy to understand - it's just a sandwich of 3 stop orders - one for the entry (start of your position) flanked by one stop profit and stop loss orders. So unlike the previous order types where you only entered one price, you enter 3 prices here.
We intend to enter a specific price only, and while entering, we want to make sure stop and profit (our max risk and our expected reward) orders are also placed. But note that these flanking orders (stop and profit) are ONLY activated IF the stop price for entering the position is filled. The video below should demonstrate this.
Notice how the stop (loss) did not get triggered even when the prices crossed the stop loss price levels - this is because the order was inactive as the entry stop price (4767 was not filled). Once the entry stop is filled, both the stop loss and stop target are activated. In the end, we see the stop target get hit as the price reaches that level and the other order (stop loss) automatically gets canceled.
Update July 2024:
It's now possible to use points, and ticks with the last/market price as part of the bracket! You no longer need to enter prices manually!
Editing trades after trading
Once you place your executions the trade will be updated and added in real-time in the table below. This table is the same as the one you see in your main dashboard. So you can expand your trade, edit it, and even explore.
But... explore? How does that work when you are now in your dashboard? Simple. TradesViz redirects you with a unique link that takes you directly to your dashboard and opens the trade you are looking for.
These are some minor QoL features that improve the experience of using a simulation and managing your trade data seamlessly. This is what sets TradesViz apart from the competition and any other trade simulation platforms.
Best Practices & Recommendations
The trading simulator is a complex tool. Here are some ways to best utilize the feature:
- The suggested way to operate is by selecting the symbol > select date > click on Apply changes. Wait for a few seconds for the data to load. Interrupting this process may result in errors.
- You can switch timeframes using the timeframe option in the chart, but doing this frequently may affect the current bar/time of the simulator. If this is a need for you, it's better to use the multi-simulator which we will discuss below.
- When starting the simulator, make sure that you do not have any open trades in the account that are linked to your simulator page. This is because if there are open trades, any new execution you make will be grouped to that open trade - remember that the simulator account is just like your brokerage account.
For example, if you already have an AAPL trade, you forgot about it and you open a new AAPL chart and start trading, your new trades will be grouped into the existing position until it's closed.
One way to avoid all of this is by clicking on clear account when you start a trading session. - Note that you can trade on a full-screen chart by enabling the in-chart trade widget by clicking on "Toggle order box" - also try using the shortcuts! All of this makes simulation as close to the real thing as possible.
- Always try to add notes/tags to the trades you make so that you know the context of your strategy/what you were thinking when you took the trade. The purpose of the simulator is to learn since you have control of time.
- Use the "Next bar" feature if you want to skip bars. It's an alternative to speed which works well if you a stock is say, in a consolidation and you want to see what happens next.
- Try to tune your mentality to treat simulation as close to real trading as possible - this is a superpower in our opinion. Simulation is like practice you can do whatever you want and more practice = better trading performance when live. The problem with the simulator is most traders get carried away with profits - that's not the goal at all. Pause. Play. Skip. Rewind and learn the chart - that's exactly what the simulator is designed for.
Multi-Simulator
The simulator with unlimited possibilities, crafted to be as close to a real trading platform as possible with multiple charts - a feature that is exclusive to TradesViz. All the 4 charts you see above are synced and fully customizable. Meaning, you can set it to be any combination of symbols and/or timeframes and trade on any of the 4 charts.
If you execute a limit order on an AAPL chart, you will see the same order synced/shown in real-time in all other AAPL charts in the multi-simulator - meaning, all your orders, executions, and even drawings are synced! Here's a video showing all of this:
Why multi over single? when to use what?
Now you might be asking why we have this when there is a single simulator? or rather, why do we have a single simulator when we have a single simulator when there is a fully functional multi-chart simulator?
The answer is preference.
Not all traders trade on 4 charts at once and not all traders trade on just one chart. The single chart allows you to focus on just one symbol and one timeframe and gives you full-screen space to view the entire chart (+ bar skip/next bar is a feature that is only available on the single simulator). Whereas, multi-simulators might not be a good fit for new traders at the beginning as it can be overwhelming to see so many charts/buttons/controls.
Multi-simulators are a lot more expressive and powerful when you want to experience a full-blown 1:1 trading simulation experience like you have in your trading platform as a lot of traders typically use at least 2 charts when trading.
In the end, use whatever is comfortable for you. Both work really well and serve slightly different purposes but the goal is same: to provide you with the best possible simulation environment to learn trading and perfect your entries, exits and risk management.
Best practices
- All the recommendations mentioned in the single simulator apply here also.
- The biggest advantage of multi over single is, of course, that you have 4 charts which means you can use either 4 unique timeframes, different symbols each with a unique timeframe, etc., This should eliminate the need for timeframe switching.
- If you want to change a symbol or timeframe, prefer to use the sync charts option instead of changing the charts one by one.
- Remember that you can adjust the size by clicking on the "Toggle View" button - this makes the 4 charts fit your current screen size so you can view all 4 of them fully without any scrolling.
- Pay close attention to the orders table at the bottom right corner especially when you are trading multiple stocks. This helps you develop an awareness of what you are handling and how well you can process information simultaneously from multiple sources.
- Multi-simulator is designed to emulate a live trading environment with multiple charts as closely as possible - it's up to you to tune psychology to treat each simulation execution with the same effect as a real trade.
- It's definitely possible to open two multi-simulator windows on 2 screens to trade on 8 unique charts. With the sync function open in each window, just make sure to select your symbols and timeframes and then click apply on both windows as closely as possible (time gap) to make sure both the windows are in sync (a kind of hack, but it works well).
Trades Replay
Just as our definition, this is a feature to *replay* the trades you made. So essentially there is no need for you to intervene or perform any action other than just clicking on the replay button.
This does not mean the system will not allow you to make trades - it will, but it is not recommended since all you are doing is just replaying the trades. Here's an example video:
Note that the replay is just like a simulation but done automatically. However, the trades are indeed executed and added to your sim account. So in the above example, we replayed a trade ($125 pnl) from the Sim1 account which was already linked to the simulation page. Replaying will add another trade (same) of the $125 pnl. This is why you should be careful with managing accounts - we always suggest creating a separate account for simulation so that all your trades get added there and you can clear the account whenever you want.
Update Apr 2026:
You can now turn on or off "Persist replay trades in simulator" in account settings (advanced settings) to either save the replied trades and have the ability to execute trades when replaying or just do plain replay.
If "Persist replay trades in simulator" is unchecked, then replay trades will not be saved in any trading accounts, and you won't be able to execute/modify executions when the replay is happening.
Options chain simulator
Stock simulators have existed for a long time - basically, any chart-only simulator is not new. Options chain on the other hand? We don't know of any platform that has it other than TradesViz.
TradesViz is the first and the only trading journal/online platform to have a full-fledged options chain simulator BUILT INTO the platform.
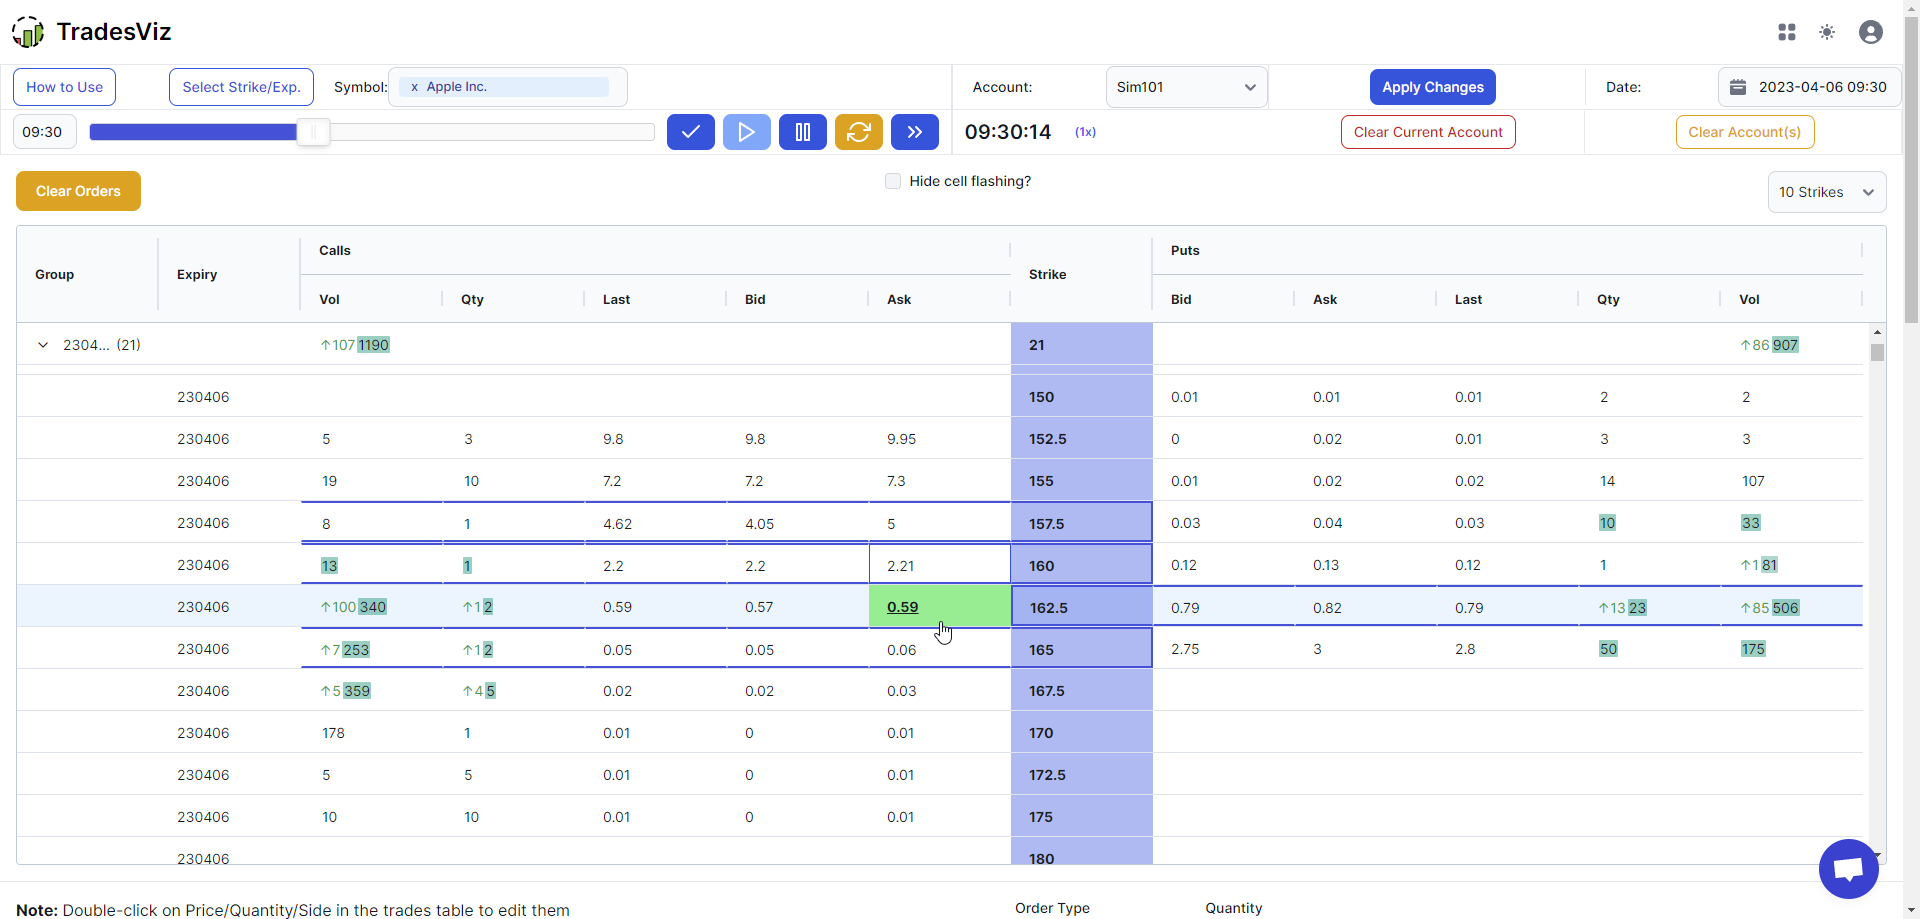
How does it work and about data availability?
It works just like any options chain you have seen in trading platforms. A strike column in the center is flanked by calls and puts data that are updated as the simulator is running.
You can build spreads by clicking on the respective bud/ask cells and then execute them all together.
Like other simulators, there is also a chart at the bottom that you can use to view your positions. Trades table and filled orders tables are also available in addition to the orders management table shown above.
Like the chart-based simulators, the data is updated with a near 18-hour delay meaning, you will be able to replay yesterday's trades today without any issues. The data goes back to Jan 2021 for all US optionable stocks and indices.
When you pick a symbol, and date, and start the simulator the simulator loads ALL the strikes and expires that were traded on that given day. This is a very LARGE amount of data and might take some time to load initially. For example, very active options like SPX indices or SPY ETF options take up to 5 minutes to initially load. Once loaded, the simulation is seamless without any lag.
You can restrict the strikes/expiries you want by clicking on the "Select Strike/Exp." button which reduces the load on your browser by loading less data.
Placing orders
This is one of the main differences between the chart-based simulator and the options chain. Placing orders involves two steps:
- Click on the relevant cells you want to buy/sell
- Click on submit in the orders table
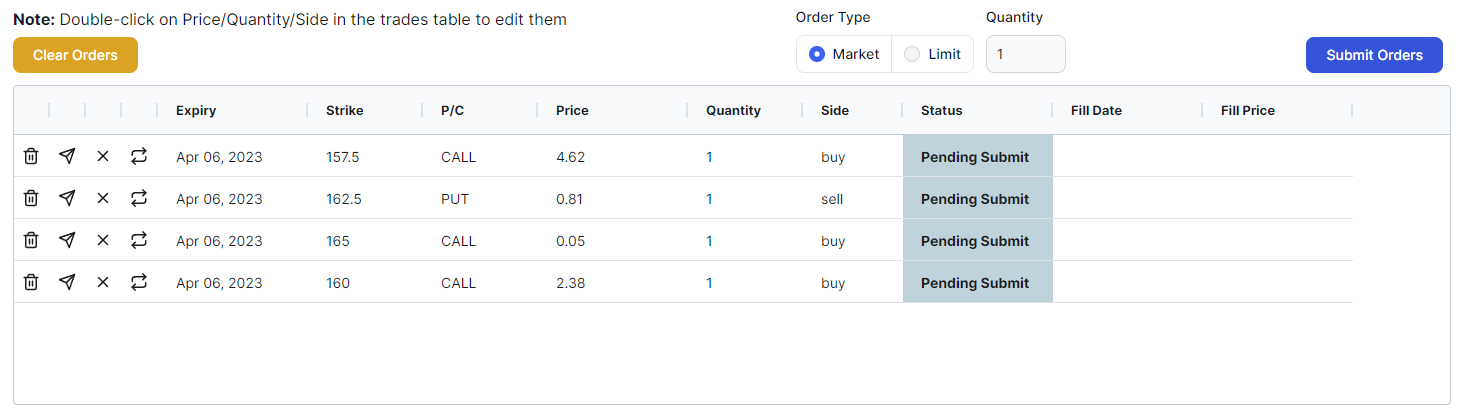
For example, if you want to sell 170 CALL and buy 150 PUT, you would click on the bid column's cell (left side of the chain) that corresponds to 170 strike and click on the ask column's cell (right side of the grid) that corresponds to 150 strike and finally click submit all to submit a market order for these 2 option legs.
You can change the order type to limit also if you want. Note that the order can be in a few different states:
- Pending submit: Order has not yet been submitted
- Submitted: Order has been sent to the simulator (in actual trading, to the exchange)
- Filled: The order has been filled
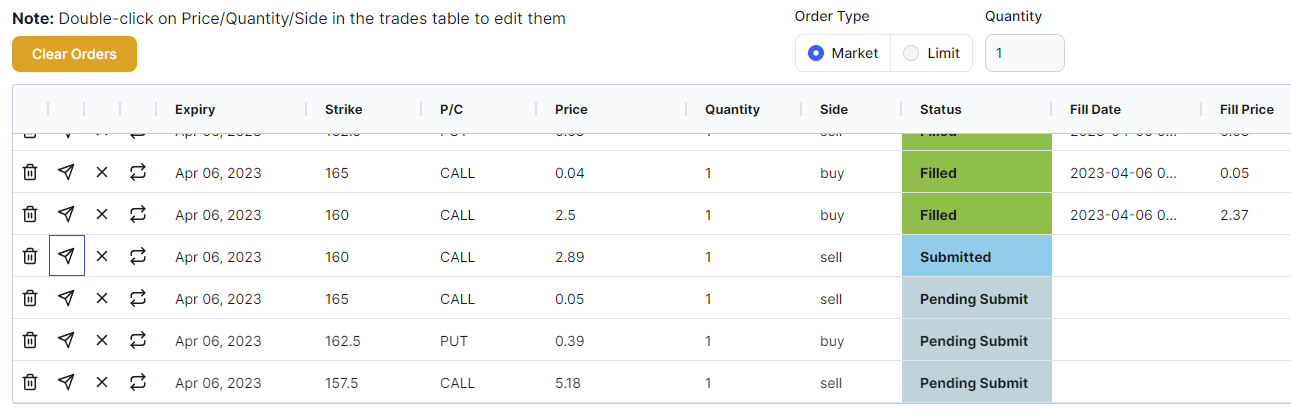
To submit an order, click on the send/arrow icon in the row. To close/exit a position, you can just click on the 'X' button of the row of the order you want to close or the cycle/rotate button to repeat/clone the order. Here's an example of placing an order and the changing order states:
Best practices and operation guidelines
- The most important part here is to understand that the simulator takes time to load. Once you select a symbol, and date and click on Apply changes, wait for the message "Backfilled historical data" to appear. Click on the play button only after that. If you do not follow this sequence exactly, you are either going to not see any data load or experience a delay in data loading.
- Remember that you can always select specific strikes or expires to load BEFORE starting the simulator. Once the simulator has started and the options chain is showing numbers, you can only use the built-in table filters to do the filtering (which also works very well).
- Just like the other simulators, the same concept of using a trading account, and storage of your trades are all applicable.
- Finally, once again, the more you start to treat your time with simulators seriously, the more benefit will you get out of it.
Backtesting
In TradesViz, we have a separate backtesting feature where you can backtest technical indicators based exit and entry on a large no. of tickers (30,000+ across 4 countries - IN, US, CA, AU) across a variety of timeframes.
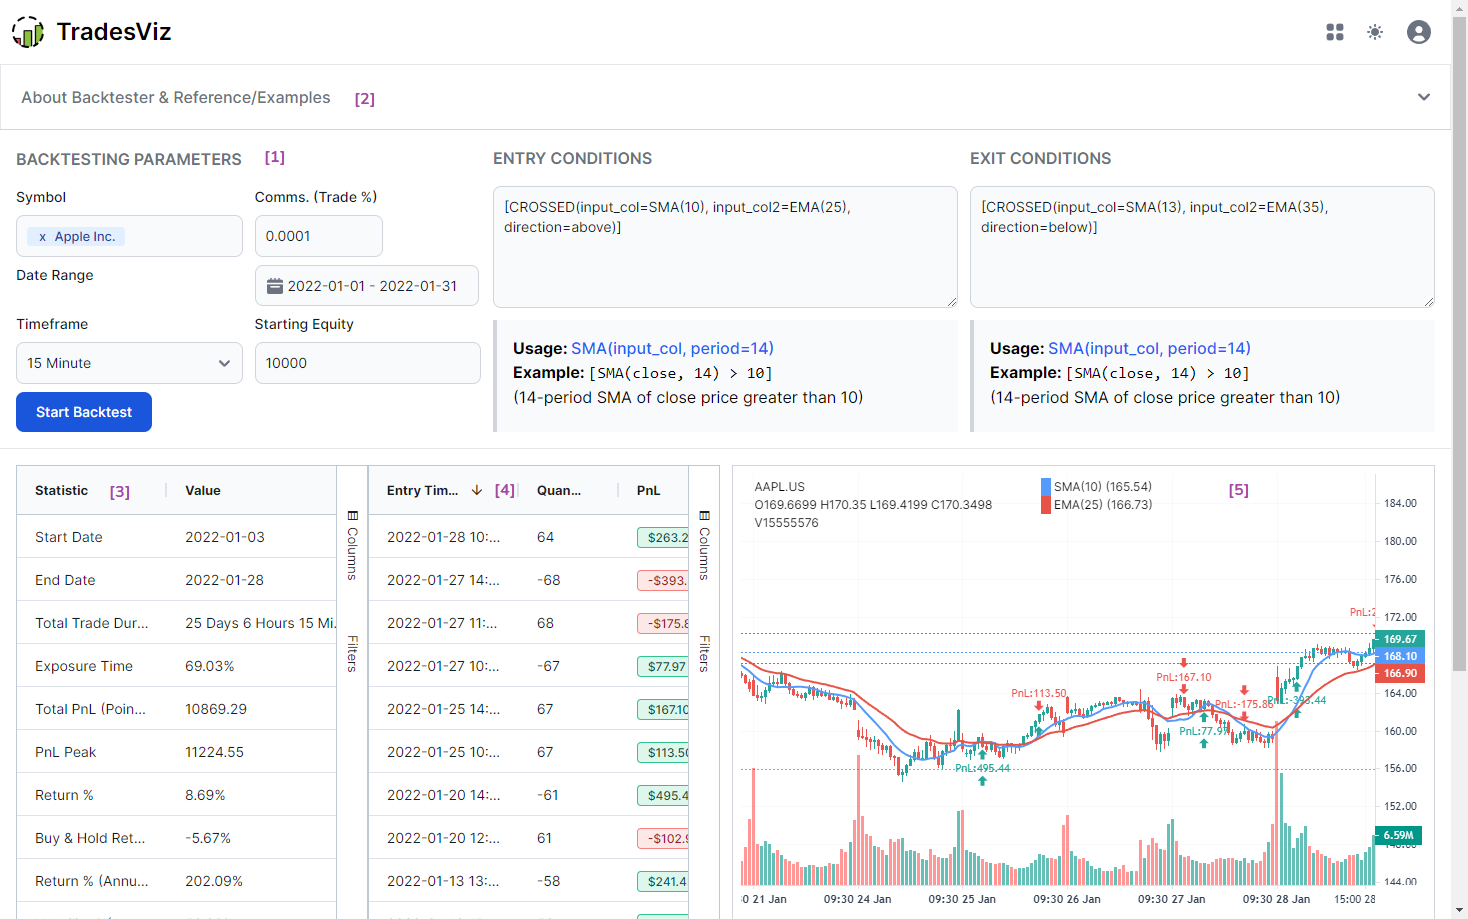
We already have a dedicated blog post for this so please visit this link to learn more about backtesting.
We hope this comprehensive guide provides you with an in-depth look at all the features and functionality of the simulation, replay, and backtesting features we offer in TradesViz. We are continually improving all these features along with our core journaling features so your feedback and suggestions are very important to us! Please let us know by emailing us at [email protected]!