We introduced seasonality graphs back in Q1 2022 (TradesViz is the first trading journal to have seasonality for over 20k symbols) - over time, while the interface has not changed much (except for the v2.0 revamp), the utility of this feature has slowly been gaining popularity among traders.
Introduction to seasonality
The concept of "seasonality" is simple: what is the *average* trend of returns for a given ticker over a period of time?
Example: If the return of AAPL on march of 2023 is x% and on march of 2022 is y%, then the seasonality of AAPL for march for the last 2 years is ((x+y)/2)%. Typically, this is done for a period of several years.
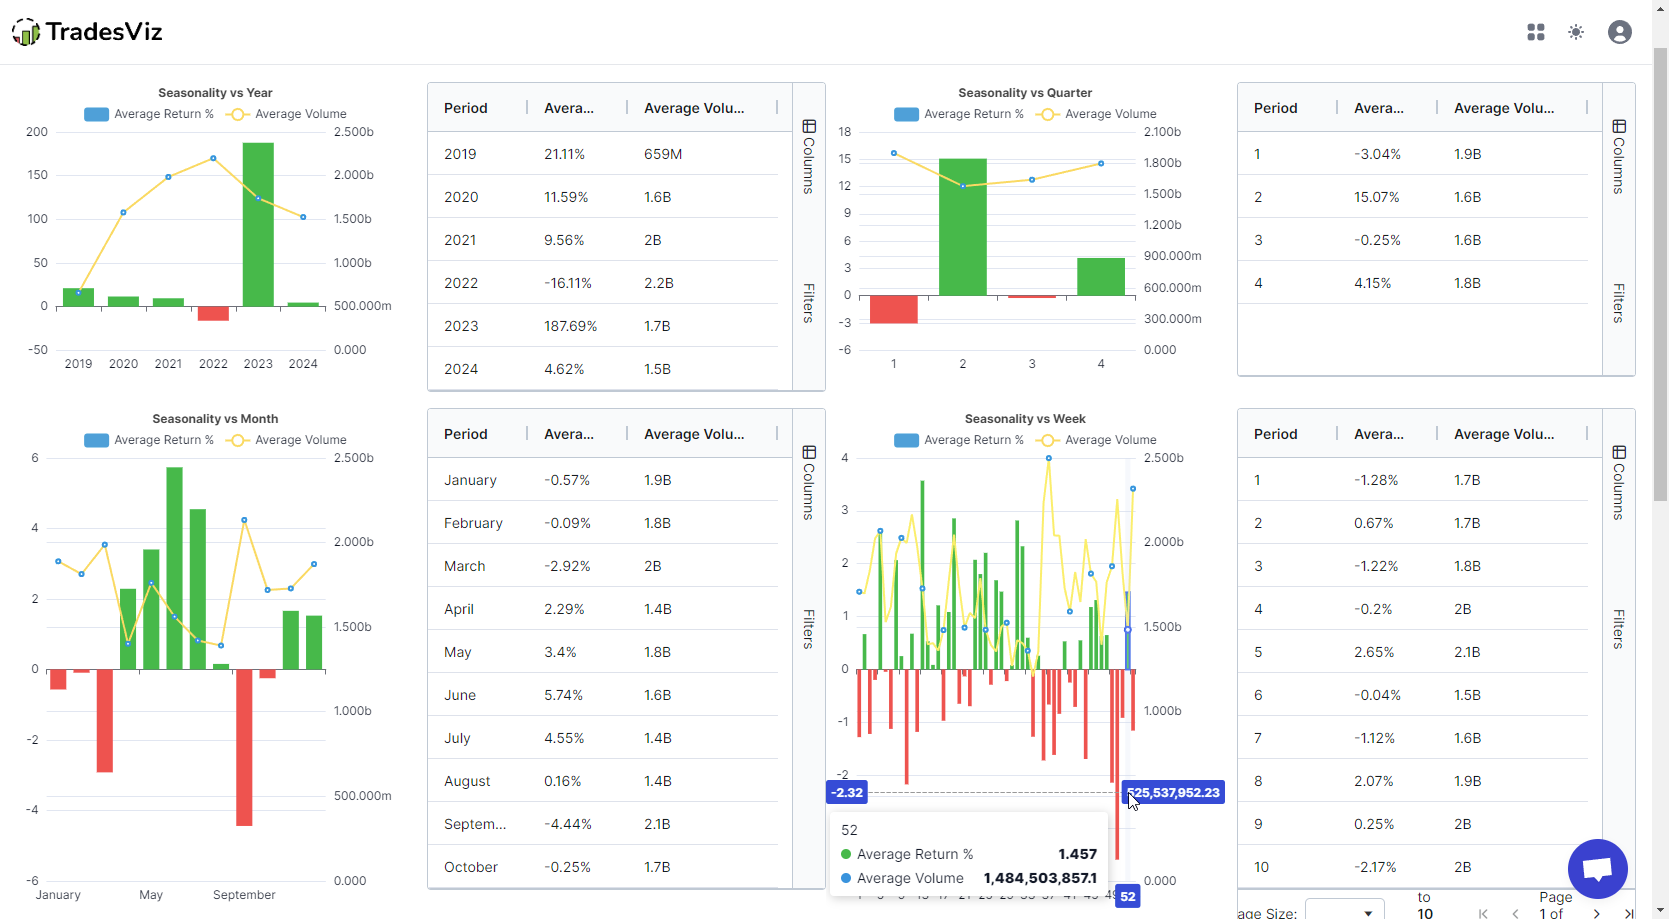
Here's an example of AAPL's seasonality on TradesViz's seasonality dashboard:
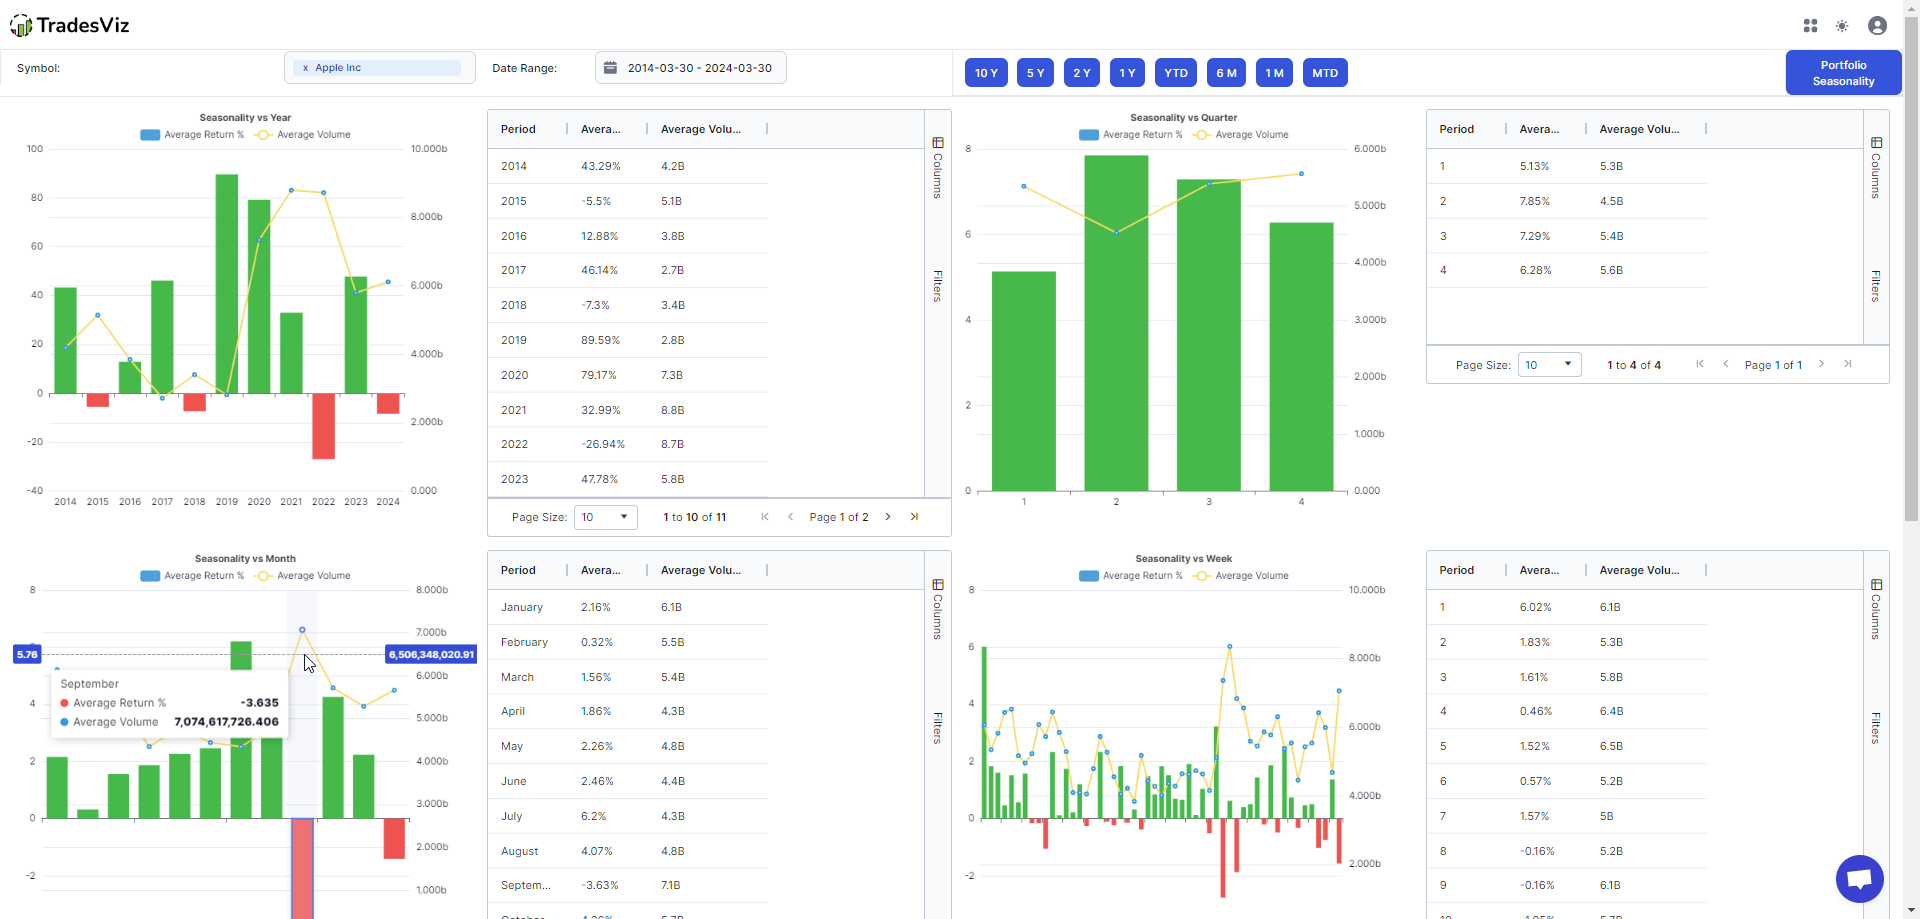
The 4 charts each show the seasonality of different periods - yearly, quarterly, monthly, and weekly (clockwise from the top left corner).
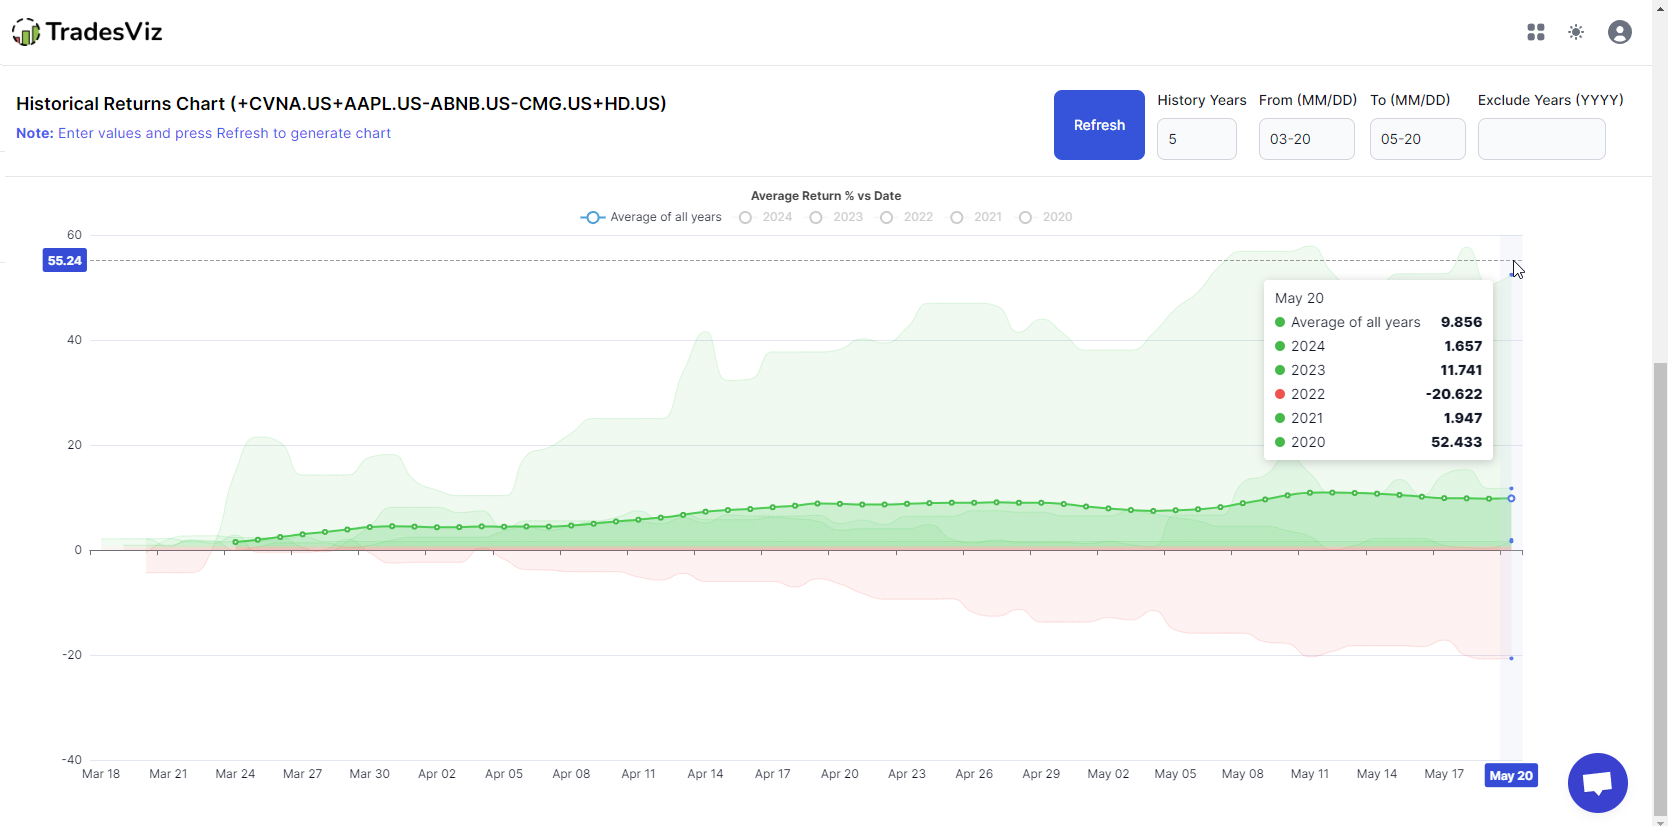
At the bottom half of this page, you are able to select any date range in MM-DD format and view the return chart for that period. For example, below, we have selected the range of 03-30 (March 30th) to 05-30 (May 30th) for the last 10 years.
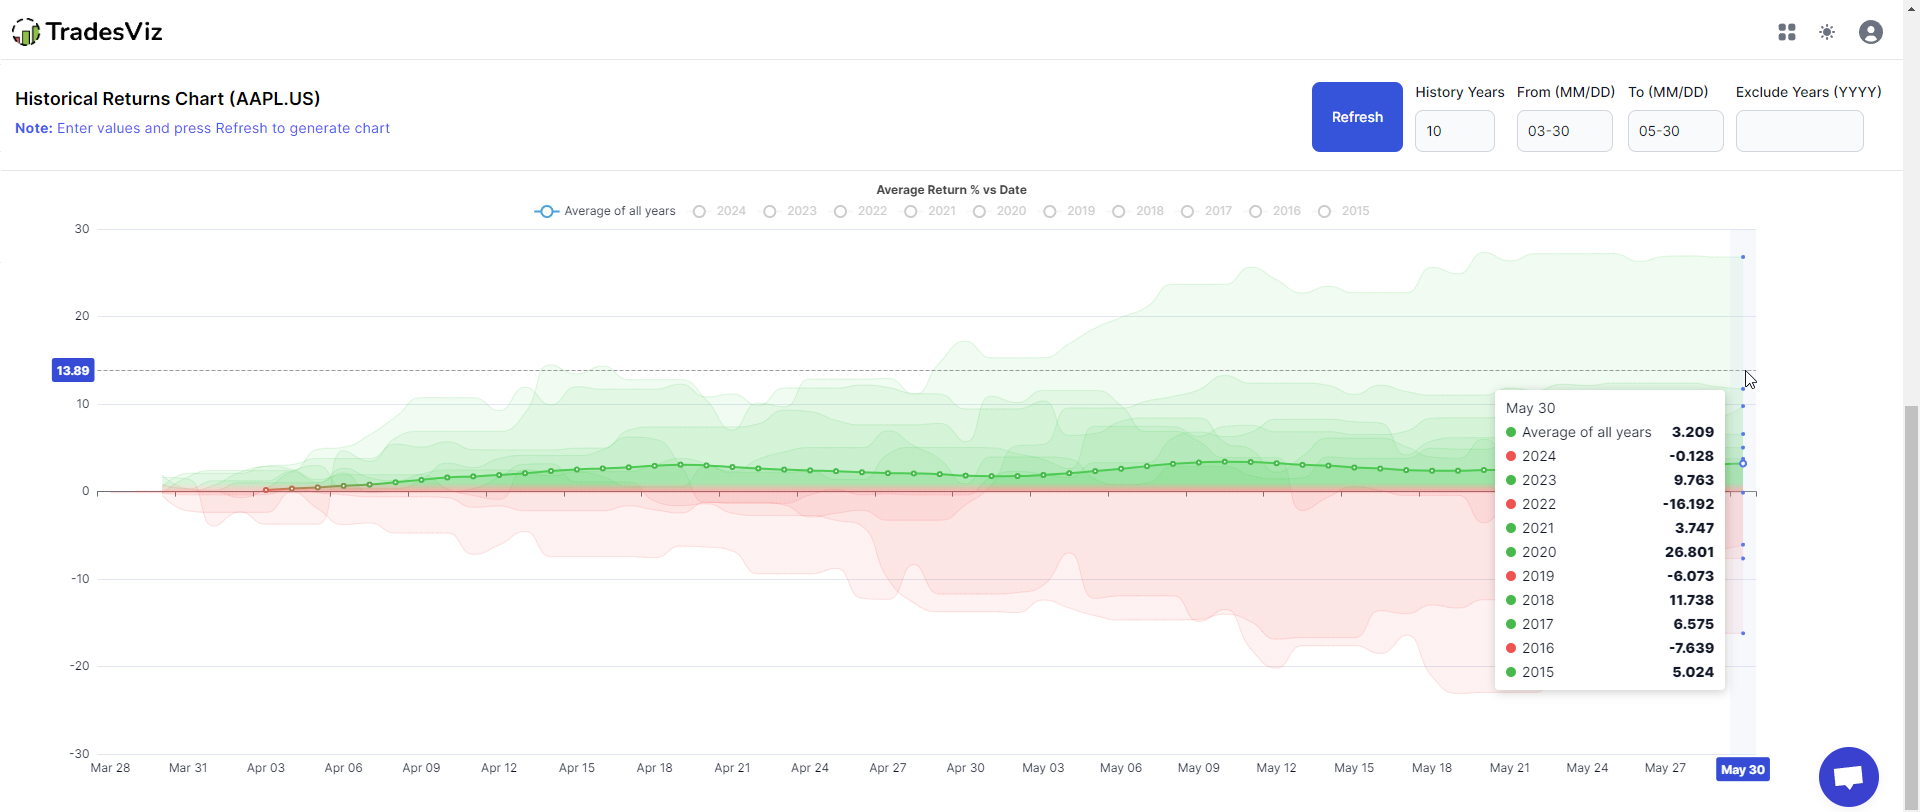
All the light green and light red lines are return curves of previous years and the thick solid line is the average of all of them. This is a very handy tool to get additional data points on what you can do with your position in case you are planning to take a position for a longer term (a few weeks to months).
This is just another datapoint to solidify your trading plan or the position you are about to take - nothing more, nothing less. This is the era of data. Traders absolutely need to use every piece of information they can at their disposal to make decisions. We always say this on all of our content that introduces new ways to create ideas: it's just another data point, never rely on a single point of confirmation.
All of that said, seasonality is still an extremely useful way to learn how certain stocks behave during certain periods of the year and leverage that opportunity to make some extra money on top of your existing trading routines.
Seasonality Portfolios
Now imagine this: there are many cyclical stocks, seasonal stocks, etc, that have a history of exhibiting trends during certain periods of time.
What if you can find build a list of tickers that you go long/short on such that the down periods of some tickers are offset by the up-periods of other tickers?...
That's what this feature is for. Seasonality portfolios let you build a list of tickers where each ticker can be designated a long or short position and finally, you get to visualize the seasonality of the entire portfolio.
Clicking on the new seasonality portfolio buttons at the top right corner will bring up a simple interface where you can add a list of tickers:
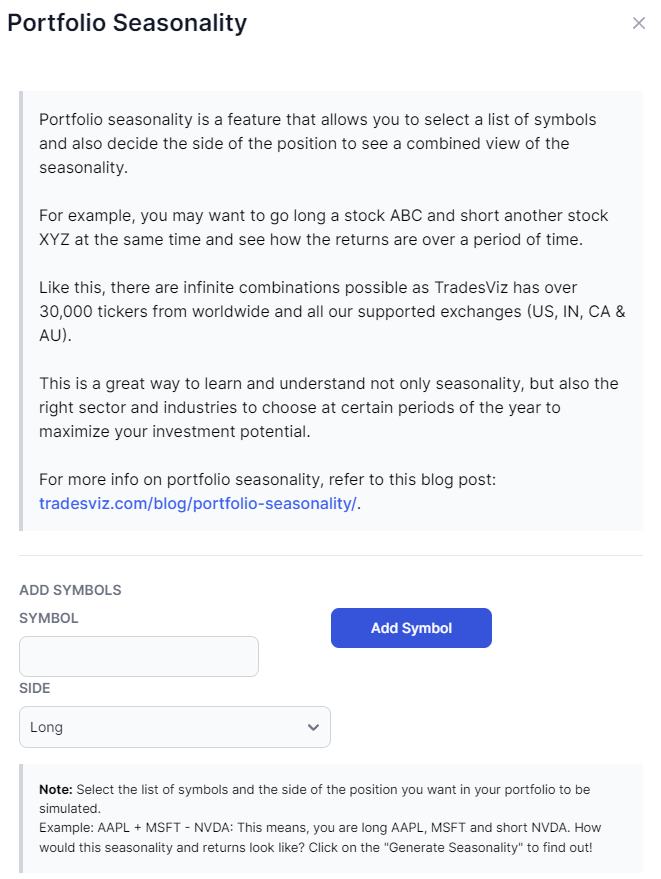
Search for symbols, choose the side, and add them as a list and click on generate seasonality:
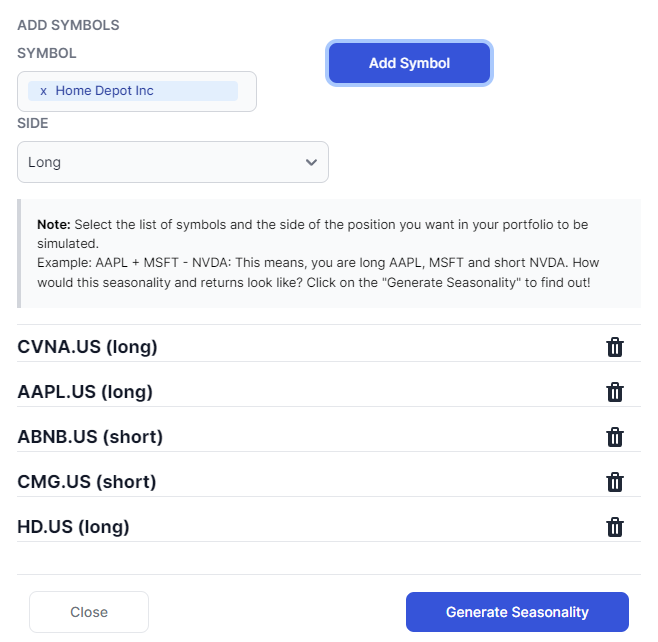
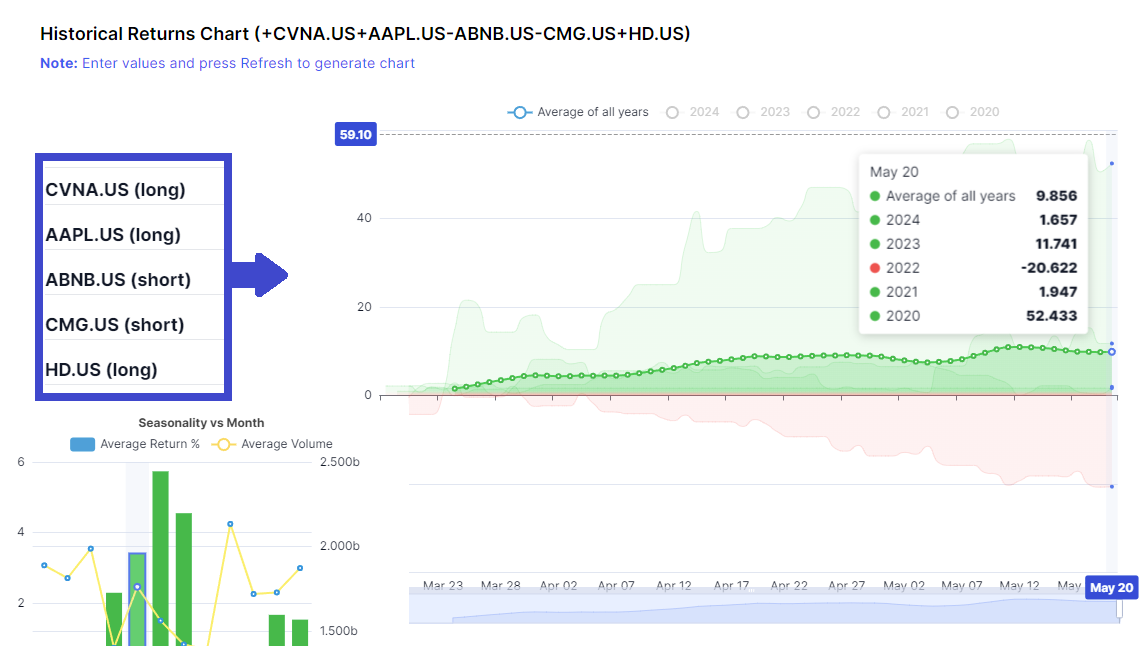
You will see the same set of 4 seasonality graphs, but here's how the data is displayed for the above example:
For each range, Total return = (Return of CVNA + Return of AAPL - Return of ABNB - Return of CMG + Return of HD)/6
It's basically a signed average of the returns of each of the selected tickers and it's incredibly interesting to see the returns of such combinations:
This is just one example (and definitely NOT financial advice...) and you can do the sample for the seasonality trend also!
You can try playing with scenarios like "What if we go long on stocks that are made for booking and holidays and go short on stocks that are office-related?". This will open up a lot of new ideas you can experiment with.
Notes on usage:
- You can only refresh the charts by clicking on generate seasonality charts in the portfolio seasonality popup
- If you have added symbols in your portfolio seasonally popup, all the buttons (years, and refresh for trend) will only use the inputs from the portfolio list and not the symbol entered at the top corner. If you want to view single symbol seasonality, clear all your portfolio seasonality list or open the seasonality link in a new tab.
This is yet another way to generate unique swing trade ideas using TradesViz. On top of the ideas you can get from options flow every day, use this as another part of your trading toolkit to be a versatile trader. Expand your bounds and try your chance at every opportunity that you fully understand. Even if it fails, you learn something that you can write in your notes ;) - that's why TradesViz is now a must-have tool for every trader and still remains the fastest-growing trading journal used by serious traders.
We have a lot of new updates and a big change in the coming weeks so stay tuned!
Let us know your feedback, and ideas on how we can improve this by sending us an email to [email protected]. We have more plans to expand seasonality to more than just the portfolio ideas we've shared here. Did you know that seasonality is already integrated into your dashboard in the unified view of the table? Our goal is not just to provide journaling features, but to enable traders to make data-driven decisions based on insights, visualizations, and analytics from the market that are easy to understand and use.