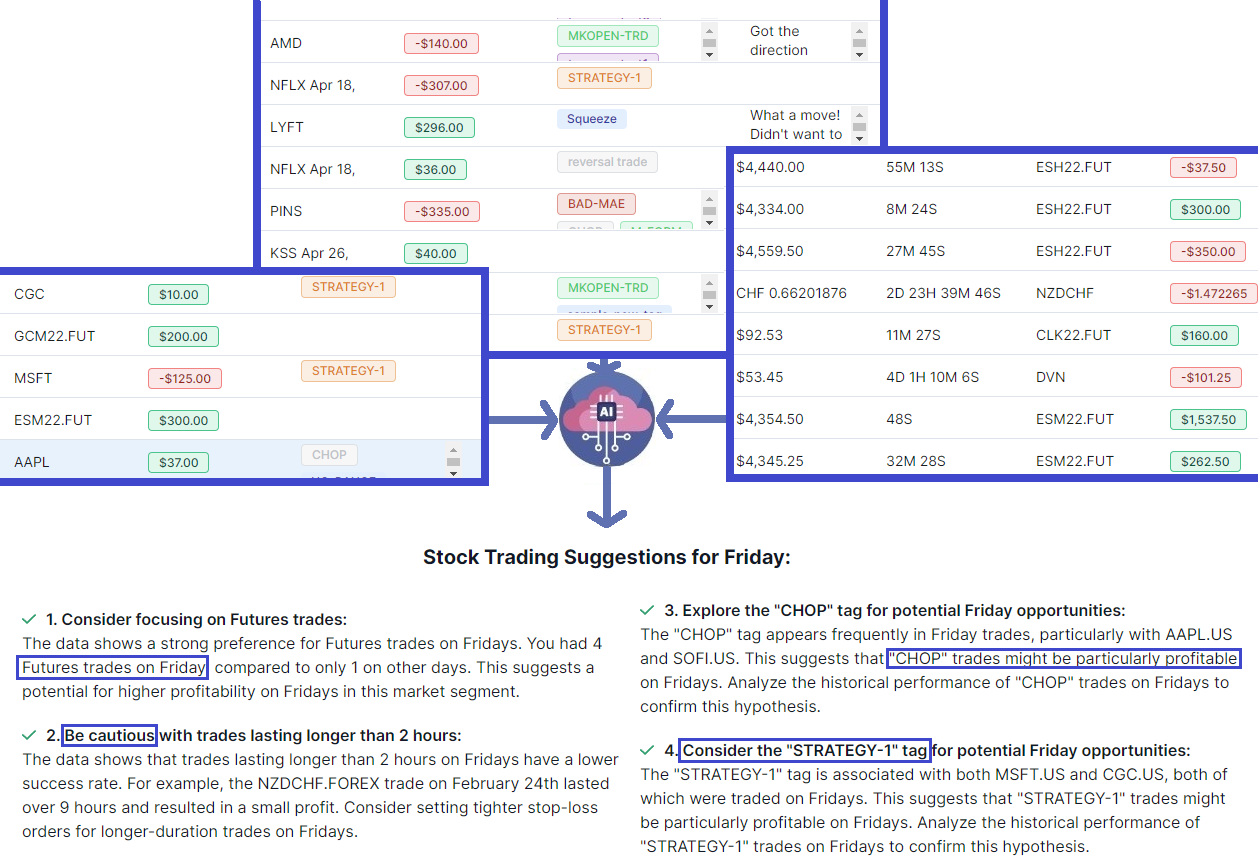
Every "AI trading journal" can write you a paragraph about your trades. Almost none of them can tell you which numbers in that paragraph are true.
The first version of our AI Daily Insights did what most AI journal features still do today: take a batch of your recent trades, hand them to a language model, and print whatever came back. Ten confident bullet points. Some useful, many generic, and every number in them calculated by a model that was never built to do arithmetic.
We were not happy with that, so we rebuilt it from scratch. The result is the AI Daily Brief: a one-screen review of your last session and a game plan for your next one, where every number is computed from your trades by TradesViz, compared against your own history, and linked to the actual trades behind it. The AI only writes the wording, and every sentence it writes is checked against your data before you see it.

Why we stopped "pasting your trades into an AI"
Here is what happens when a journal, or you, hands a few hundred trades to a chatbot and asks for insights:
- The model does the math. Language models predict words. Totals, averages and win rates across hundreds of rows come out plausible, not correct. You have no way to tell which is which.
- There is no "normal". "You lost $420 today" means nothing without knowing your typical day. A chatbot only sees what you pasted.
- It forgets everything. Tomorrow you start from zero. It has no idea what it told you yesterday or whether you listened.
- You have to remember to ask. And the days you most need a review are the days you least feel like writing a prompt.
- It cannot see what is not in the export. Your planned stops, your rules, your tags, MFE/MAE, the economic calendar, earnings on what you hold, the options expiring next week.
A trading journal already has all of that data, already does the math correctly, and already knows your history. So we flipped the job around: TradesViz computes the insights, the AI just explains them.
Where to find it
You don't have to go looking. There are four ways in:
- Overview: right under Trading Review, a one-line summary of your latest session appears with a New badge until you open it. Click Open brief.
- Sidebar: Tools › AI Daily Brief. The menu item shows a small dot when a brief you haven't read is waiting.
- Day Explore: the Daily Brief button on any day opens the brief for that exact day.
- Command palette: press Ctrl+K and type "Daily Brief".

The brief always opens on your latest session. Use the arrows to step to the previous or next session, the date box to jump to any day, and Latest to come back. The switch on the left changes the view from a single Session to your Last 5, Last 10 or Last 20 sessions (more on that below).
A tour of one session
The brief at the top of this post is a good day: three trades, +$3,500, every rule kept, closed at the session high. Bad days teach more, so let's walk through one of those first and come back to green days after.
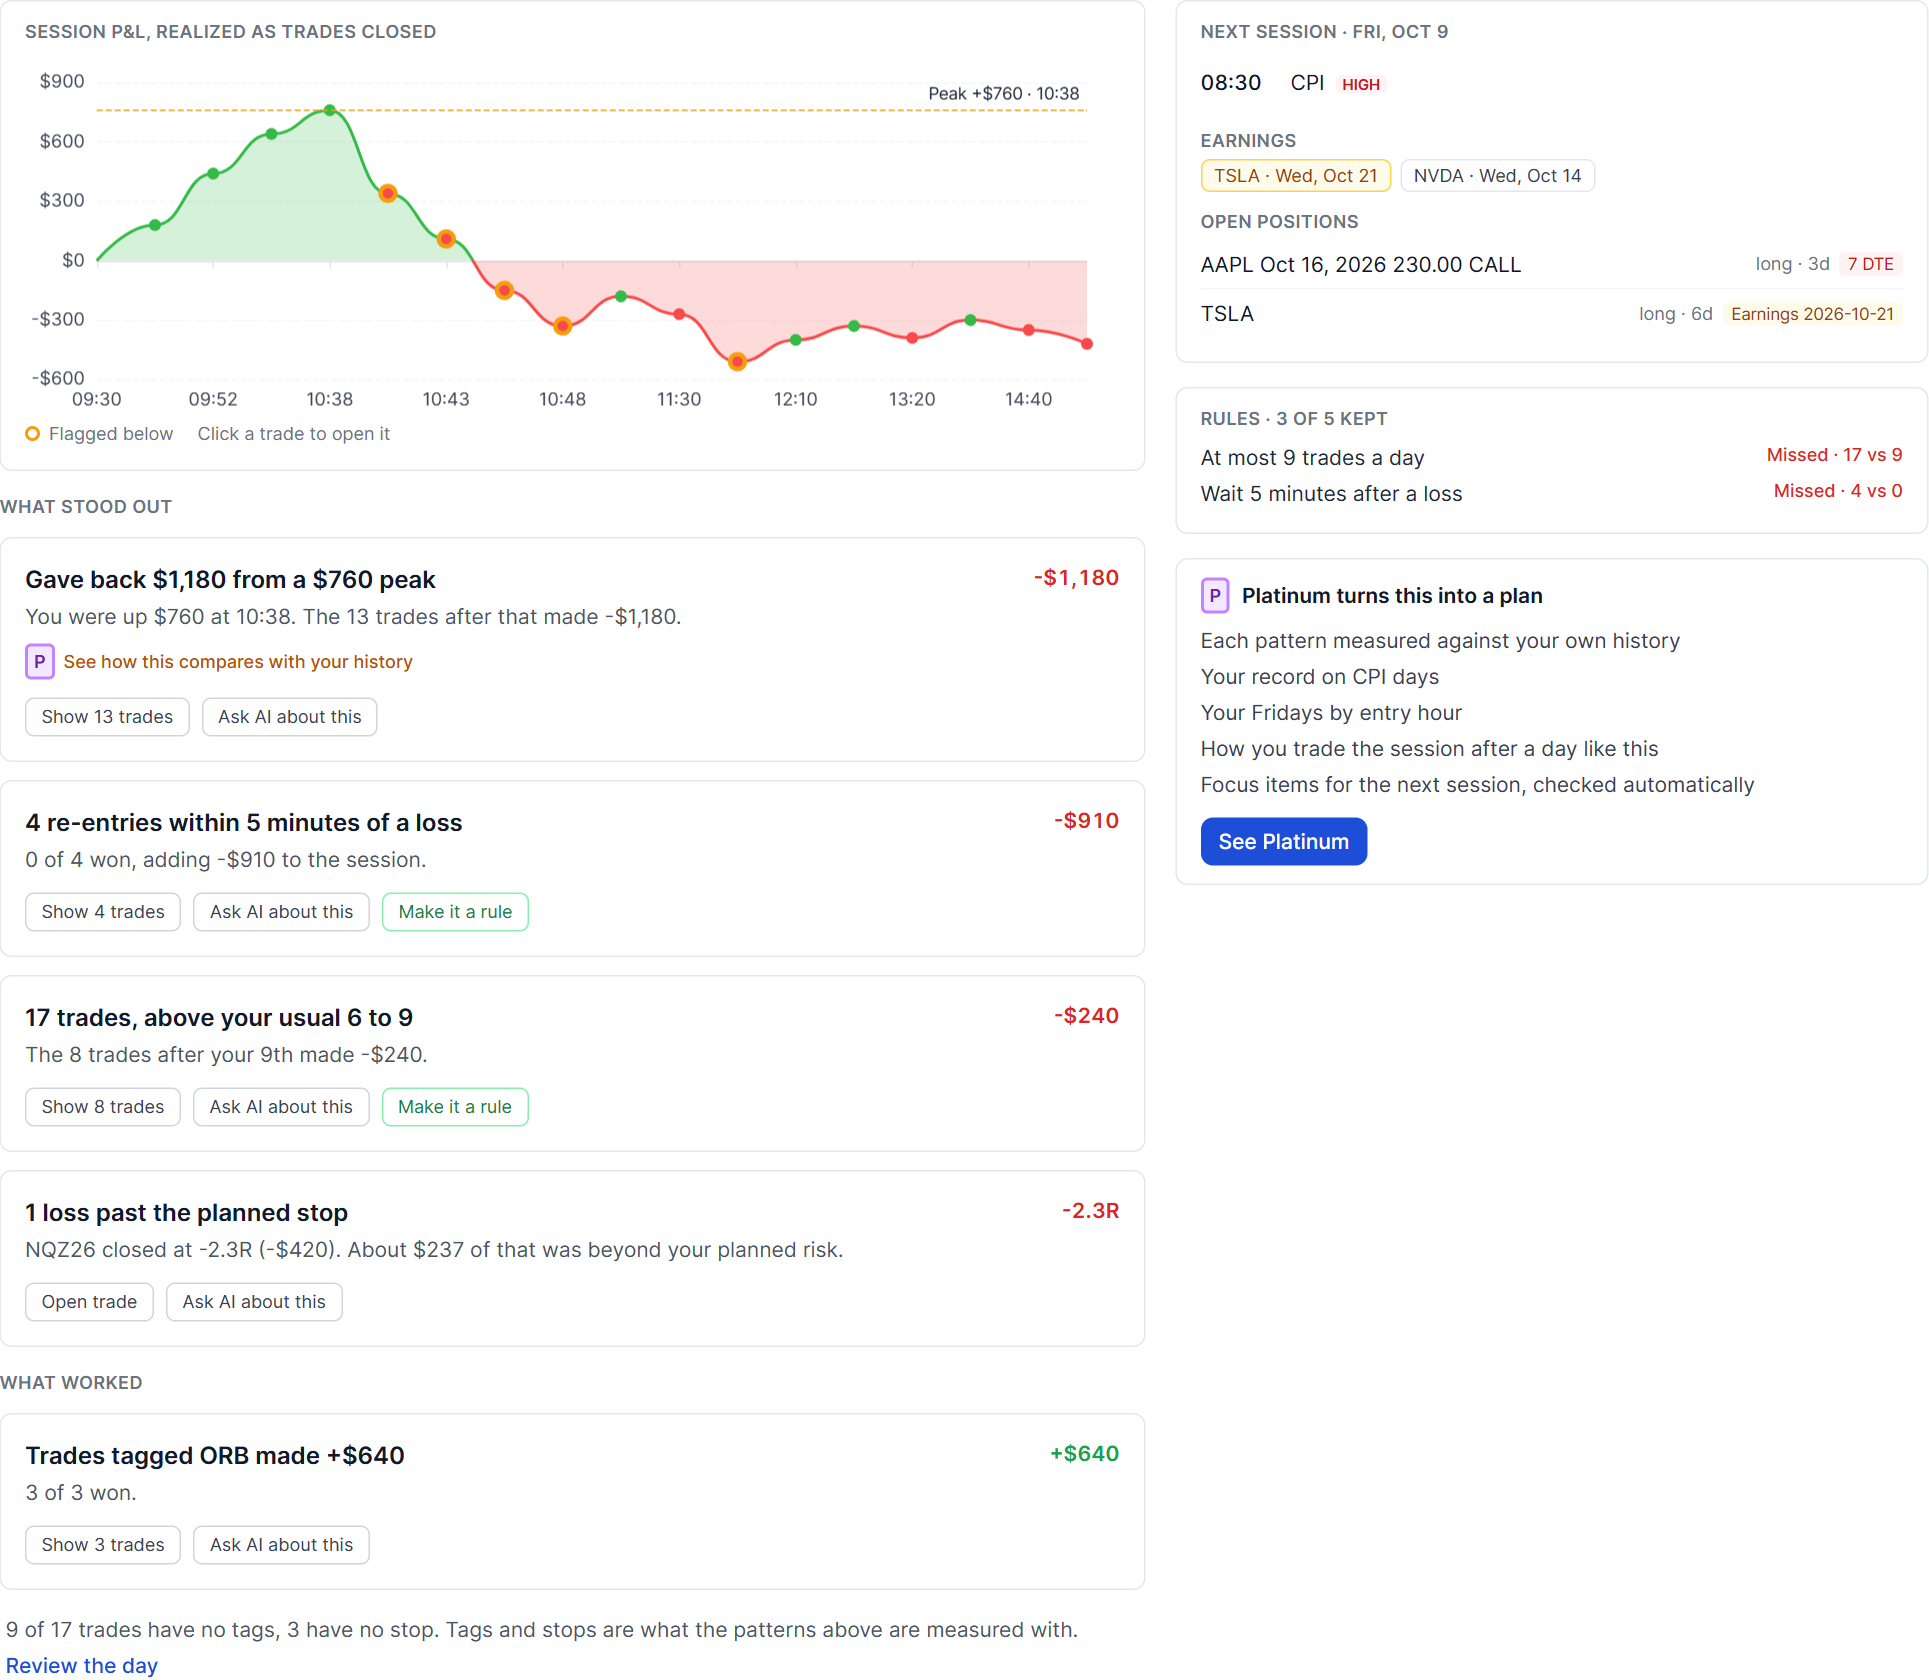
Our example trader trades NQ and ES futures. On Thursday they were up $760 by 10:38, took a stop on NQ, re-entered three times within minutes, and finished the day at -$420.
The headline and the score
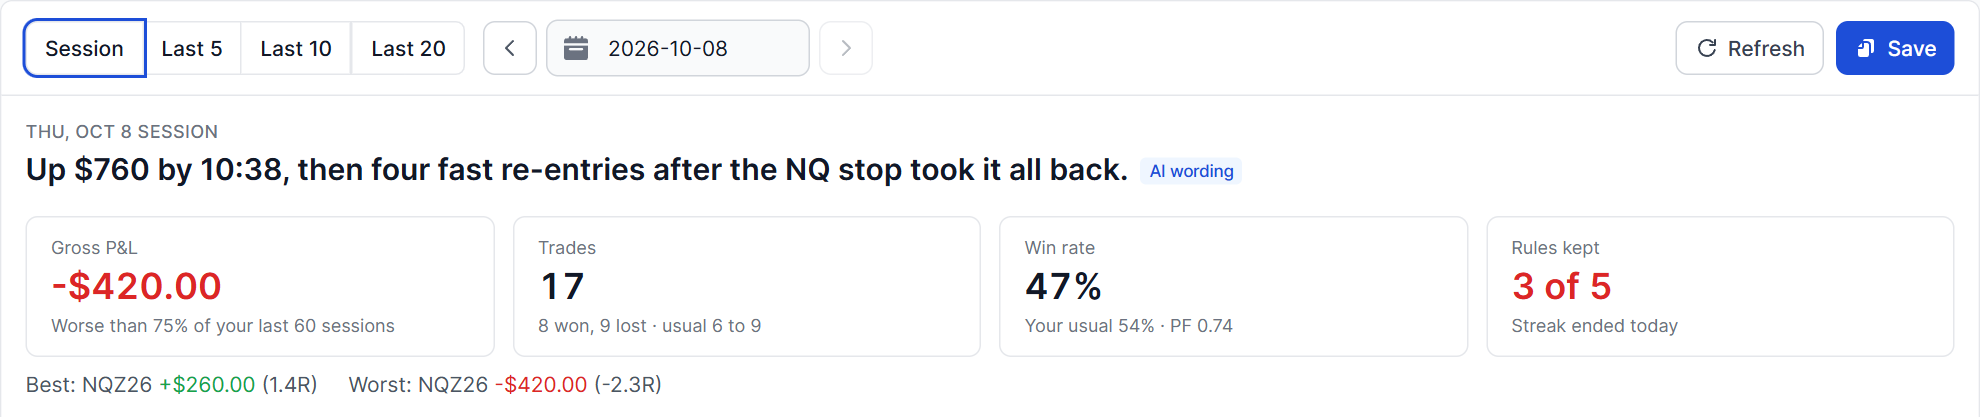
The headline tells you the story of the day in one line: "Up $760 by 10:38, then four fast re-entries after the NQ stop took it all back." That sentence was written by the AI, and the small AI wording label tells you so. Every number and time in it ($760, 10:38) was checked against the session before it was shown.
Under it, four tiles that mean something because they are compared with you, not with some imaginary average trader:
- P&L: "Worse than 75% of your last 60 sessions." A -$420 day is a disaster for one trader and a Tuesday for another. Now you know which one it is for you.
- Trades: "8 won, 9 lost, usual 6 to 9." Your usual range is the middle half of your last 60 sessions. 17 trades is not "a lot". It is nearly double your normal.
- Win rate: today versus your usual, plus profit factor.
- Rules kept: straight from your trading rules, including whether today ended your streak.
Your best and worst trade sit right under the tiles. Click either one to open it in Trade Explore.
The session curve
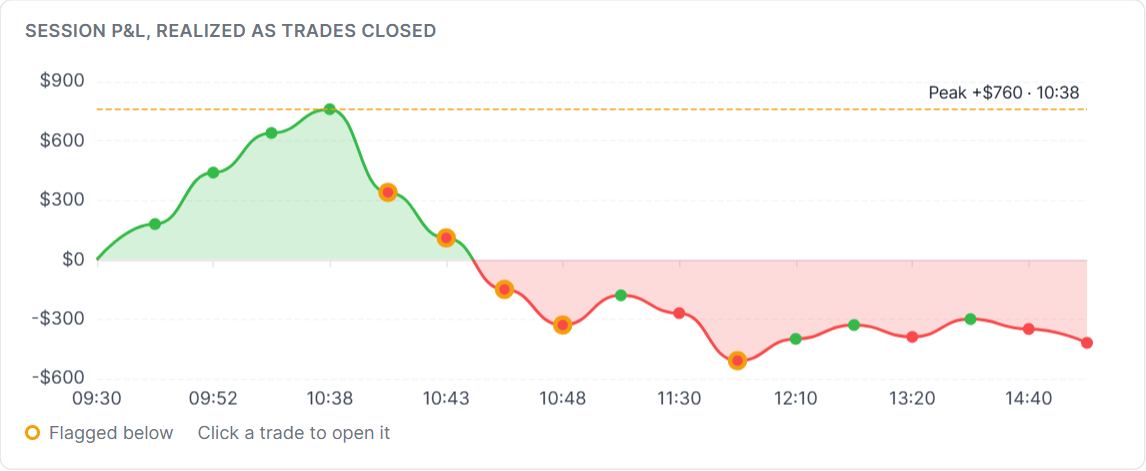
This is your realized P&L as each trade closed. Green dots are winners, red dots are losers, and trades with an orange ring are the ones flagged in the cards below. The dashed line marks the session high, so you can see exactly where the day turned. Hover any dot to see the time, symbol and P&L. Click it to open that trade with its chart and executions.
If a session spans more than a day (swing trades closed on that date, for example), the curve switches to trade order so it stays readable.
What stood out: the checks that run on every session
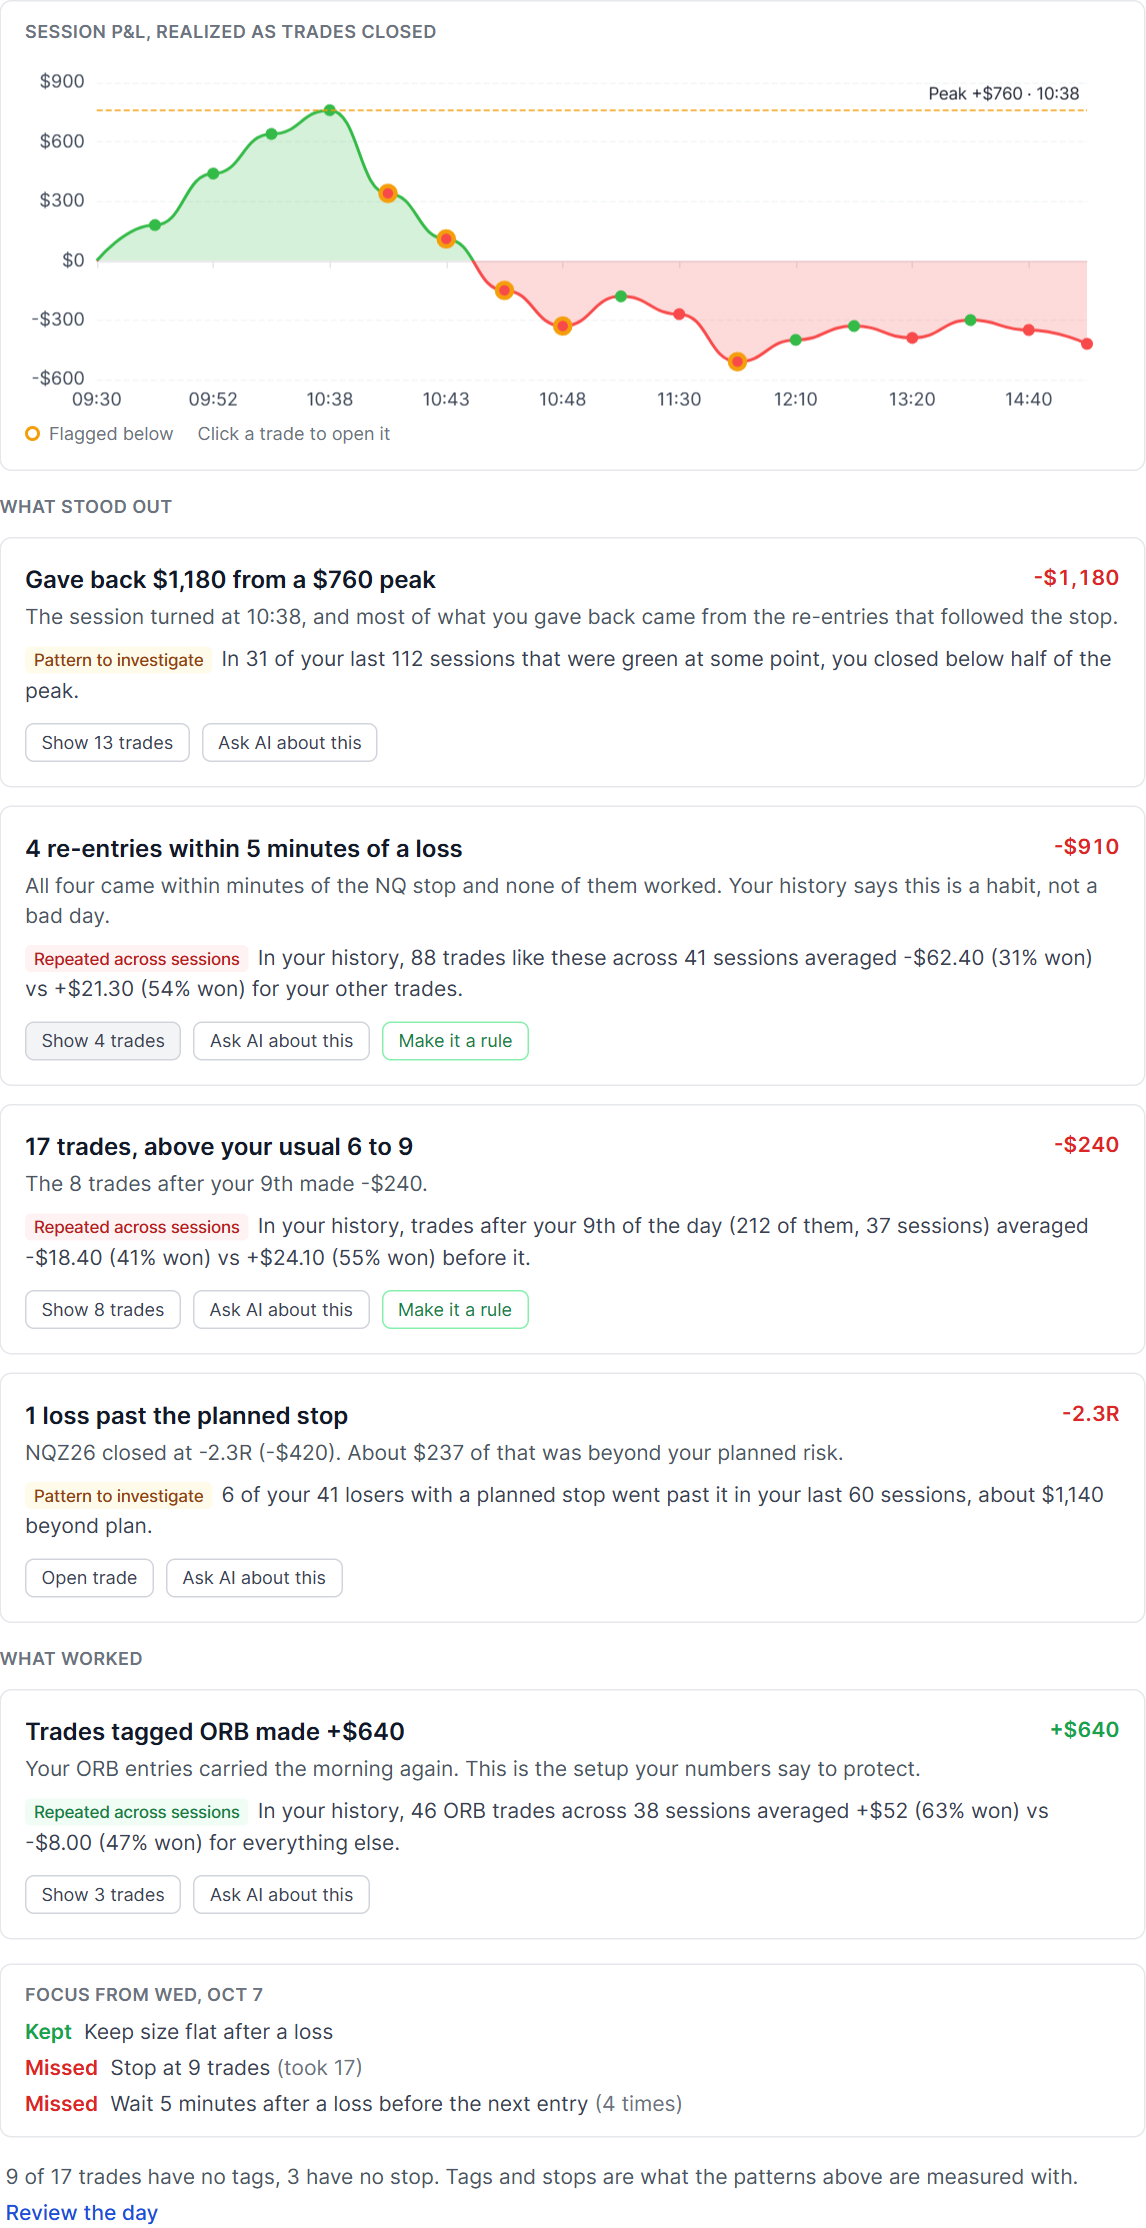
This is the heart of the brief. Every session is checked for the specific, expensive, fixable patterns we see again and again across traders. A card only appears if the pattern actually happened and it was big enough to matter for you.
| Example card | When it appears |
|---|---|
| Gave back $1,180 from a $760 peak | You were meaningfully up during the session and closed below half of that peak. |
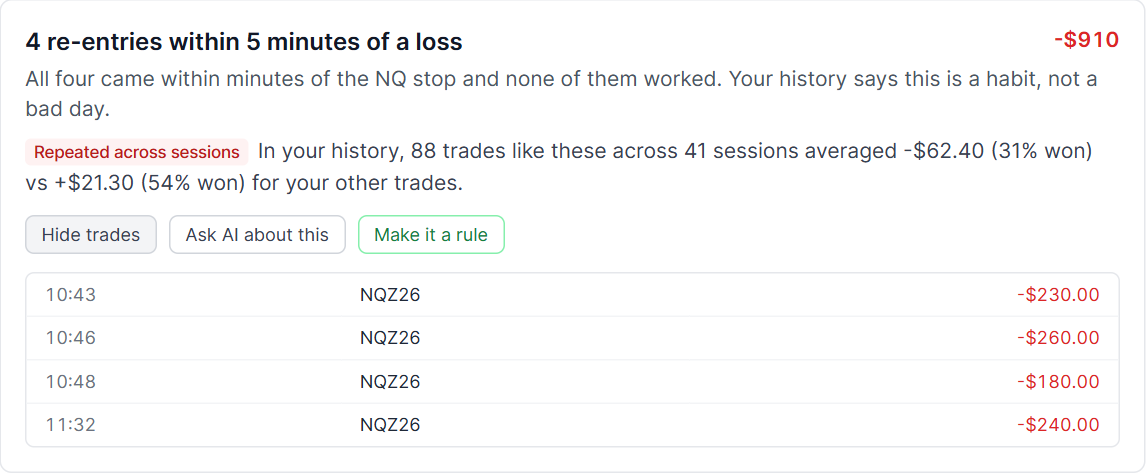
| 4 re-entries within 5 minutes of a loss | Trades opened within 5 minutes of a losing trade closing on the same account. |
| Size raised after a loss, 2 times | The next trade on the same instrument was at least 1.5x the size of the losing trade before it. |
| 1 loss past the planned stop | A loss worse than 1.25R, using the stop you recorded. Shows how much was lost beyond your planned risk. |
| 17 trades, above your usual 6 to 9 | You took more trades than your usual range, and the trades after your usual number lost money. |
| One NQ trade lost $420 | A single trade accounts for at least half of a losing day. Often the honest story of a red day is one oversized loss, not ten small ones. |
| Left $310 on winners | Your winners captured less than 60% of their best available exit (from MFE). |
| Trades tagged ORB made +$640 | What worked: the tag (or symbol, if you don't tag) that carried the session. |
"Big enough to matter" is measured against you. A $90 giveback will never make the list for a trader whose typical day moves $500, and it might be the most important thing on the page for a trader whose typical day moves $150. No fixed dollar thresholds, no noise.
Every card is a starting point, not a dead end
Depending on the card, you get these buttons:
- Show trades: opens the exact trades behind the card, right inside the card. Click any row to open that trade. Cards about a single trade have Open trade instead.
- Ask AI about this: opens AI Trade Chat with a follow-up question already asked, for example "Compare my trades opened within 5 minutes of a losing trade with my other trades over the last 6 months: count, win rate and average P&L."
- Make it a rule: turns the card into a trading rule in one click, such as "Wait 5 minutes after a loss" or "At most 9 trades a day". From then on it is checked automatically on every sync.
Evidence labels: is this a habit or just a bad day?
This is the question no chatbot can answer, because it requires your entire history and real statistics. On Platinum, every card is measured against your own past sessions and gets one of three labels:
- Observation: it happened, but your history doesn't show it as a pattern yet.
- Pattern to investigate: it shows up in at least 5 sessions and the difference is big enough to deserve a closer look, but not yet strong enough to call a habit.
- Repeated across sessions: it shows up in at least 10 sessions, the difference is statistically strong, and it holds in both your older and your newer sessions. This is a habit.
Next to the label you get the actual comparison, for example: "In your history, 88 trades like these across 41 sessions averaged -$62.40 (31% won) vs +$21.30 (54% won) for your other trades." That one sentence is the difference between "I had a bad morning" and "I lose money every time I do this."
We deliberately don't print things like "95% confidence". A statistical test doesn't tell you the probability that a pattern is real, and we would rather be honest than impressive. The labels say exactly what the data supports.
Green days get the same scrutiny
Most AI journal features have two modes: sympathy on red days and "great job!" on green days. The AI Daily Brief runs exactly the same checks on a winning session, because a green day is where a bad habit hides best.
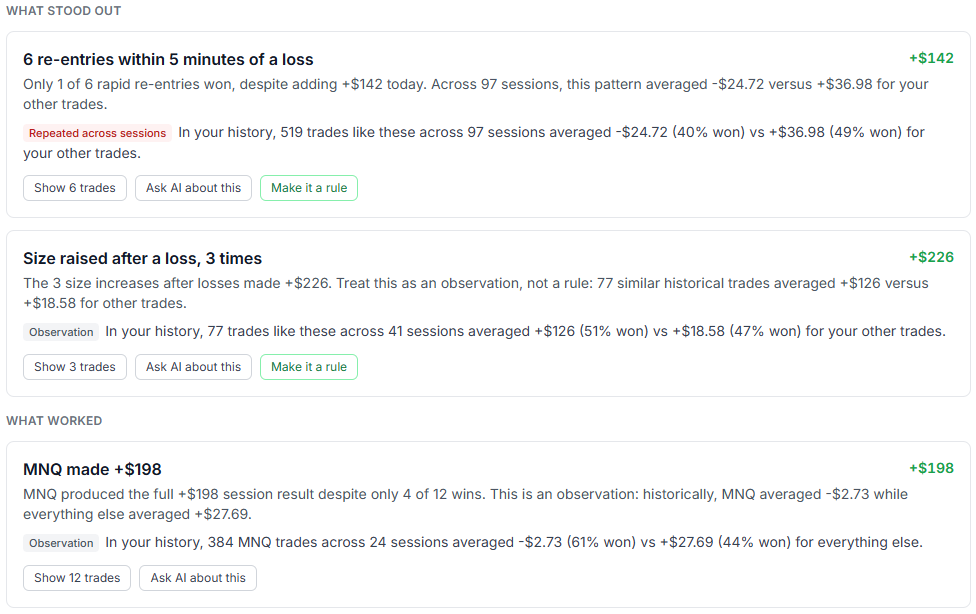
This was a +$198 day. A chatbot would congratulate you. The brief found three things:
- 6 re-entries within 5 minutes of a loss that happened to add +$142 today, with only 1 of the 6 winning. Across 97 sessions, 519 trades like these averaged -$24.72 against +$36.98 for everything else, so the card is labelled Repeated across sessions and became the focus for the next session: "Wait 5 minutes after every loss before your next entry." One lucky day does not make it a good habit.
- Size raised after a loss, 3 times, for +$226. Here history leans the trader's way: 77 trades like these averaged +$126 against +$18.58. The difference is not strong enough to call a pattern, so the label stays at Observation and the brief does not tell you to change anything.
- What worked: MNQ carried the whole day, yet across 384 past MNQ trades it has lost $2.73 a trade on average. A big day on a symbol that usually costs you is worth a second look before you size up on it.
Big days get the same treatment. After a +$16,070 session (6 trades, 6 winners, every rule kept), the next-session panel showed how this trader's Fridays go hour by hour, plus one line worth reading twice:
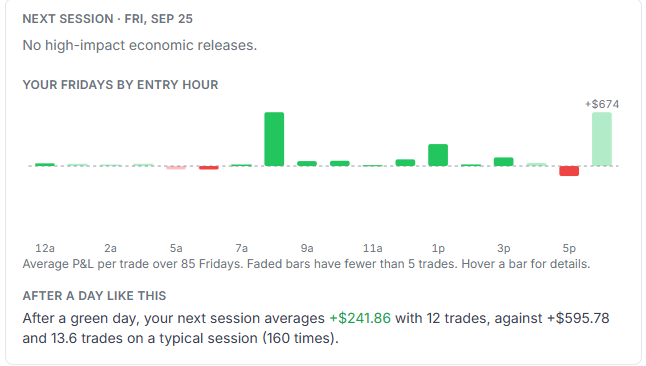
"After a green day, your next session averages +$241.86 with 12 trades, against +$595.78 and 13.6 trades on a typical session." In plain words: for this trader, the session after a green day makes less than half of a typical one. That is exactly what you want to know the morning after your best day of the month, not three weeks later.
Next session: what to know before you place a trade
Most reviews stop at what already happened. The brief also tells you what is coming.
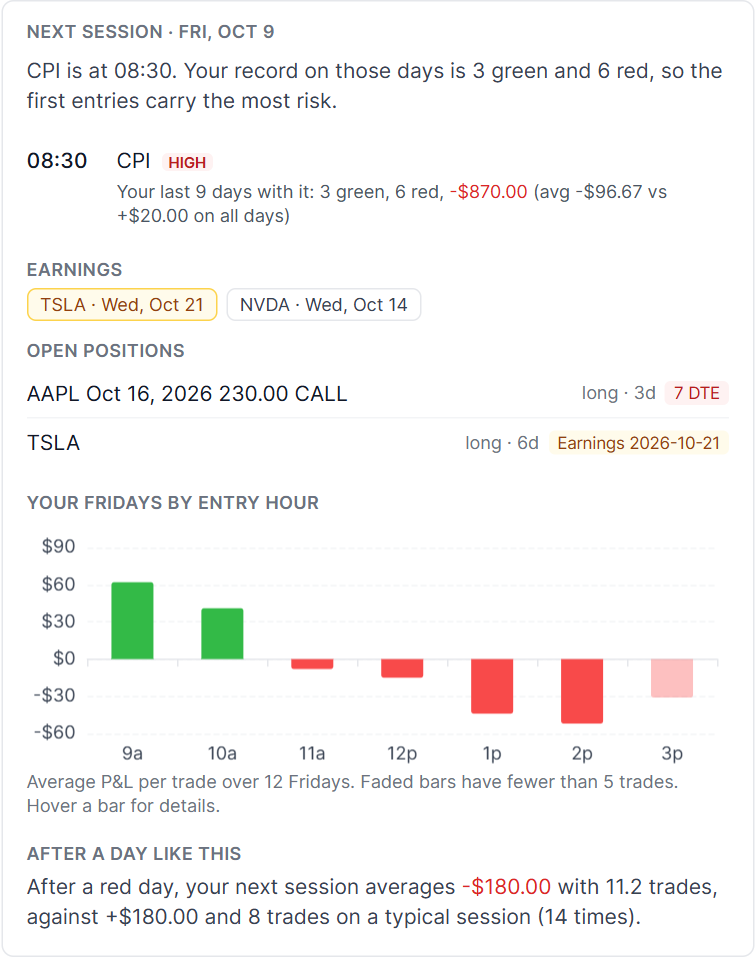
- High-impact economic releases for your next session, with their times in your timezone. On Platinum, each one comes with your record on days with that release: "Your last 9 days with it: 3 green, 6 red, -$870.00 (avg -$96.67 vs +$20.00 on all days)." That is a very different way to look at CPI morning.
- Earnings for symbols you hold or traded in the last 30 days. Anything you are holding through earnings is highlighted.
- Open positions with how long you have held them, days to expiry for options (7 DTE or less shows in red), and a warning when earnings land before expiry.
- Your weekday by entry hour (Platinum): your average P&L per trade for each hour on that weekday, from your own history. Hours with fewer than 5 trades are faded so you don't over-read them. If your Friday afternoons are a money pit, you will see it before Friday afternoon.
- After a day like this (Platinum): how you trade the session after a red (or green) day. "After a red day, your next session averages -$180.00 with 11.2 trades, against +$180.00 and 8 trades on a typical session (14 times)." If you tend to chase after a loss, this is where you find out.
Focus items that check themselves
On Platinum, the brief ends with 1 to 3 focus items for your next session. They are not motivational quotes. They come from what actually cost you money, today or reliably in your history, and each one is something TradesViz can check.
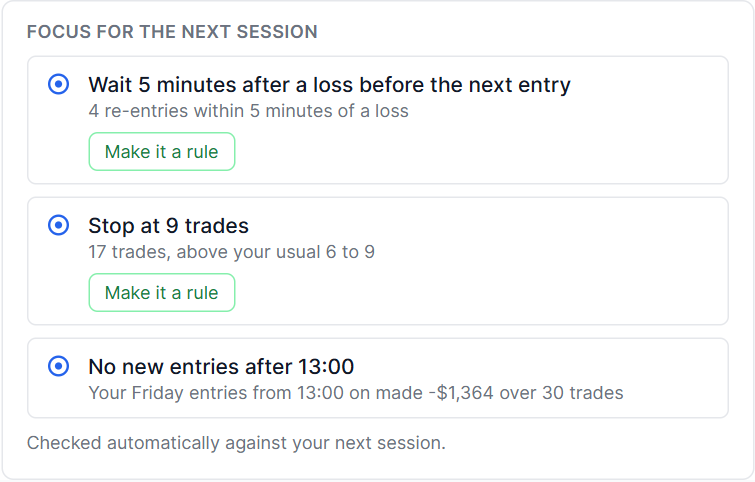
The items are specific to you. If your Friday afternoons lose money, you get "No new entries after 13:00" with the exact figure behind it. If your CPI mornings are red, you might get "No entries until 08:45, 15 minutes after CPI".
When you open your next session's brief, the previous focus items are graded automatically against what you actually did:

No checkbox to tick, no honor system. If you said you would stop at 9 trades and took 17, it says "Missed (took 17)". Keep one for a few sessions in a row and it is probably time to click Make it a rule and let the rules engine track it permanently.
Rules and journal hygiene
If you use trading rules, the brief lists which ones you missed that session, with the actual value against your target. Under the cards, it also tells you how many trades have no tags or no stop. That line matters more than it looks: tags and stops are what the patterns above are measured with. Untagged trades can't show up in "what worked", and trades without a stop can't be checked for overruns. Click Review the day to fix them in Day Explore. (If you don't tag yet, our tags guide takes ten minutes to read.)
Zoom out: your last 5, 10 or 20 sessions
A single session is great for the daily routine. To see what is really going on, you need a few weeks. Switch to Last 5, Last 10 or Last 20 and the brief becomes a period review: a ranked, numbered list of insights about those sessions.
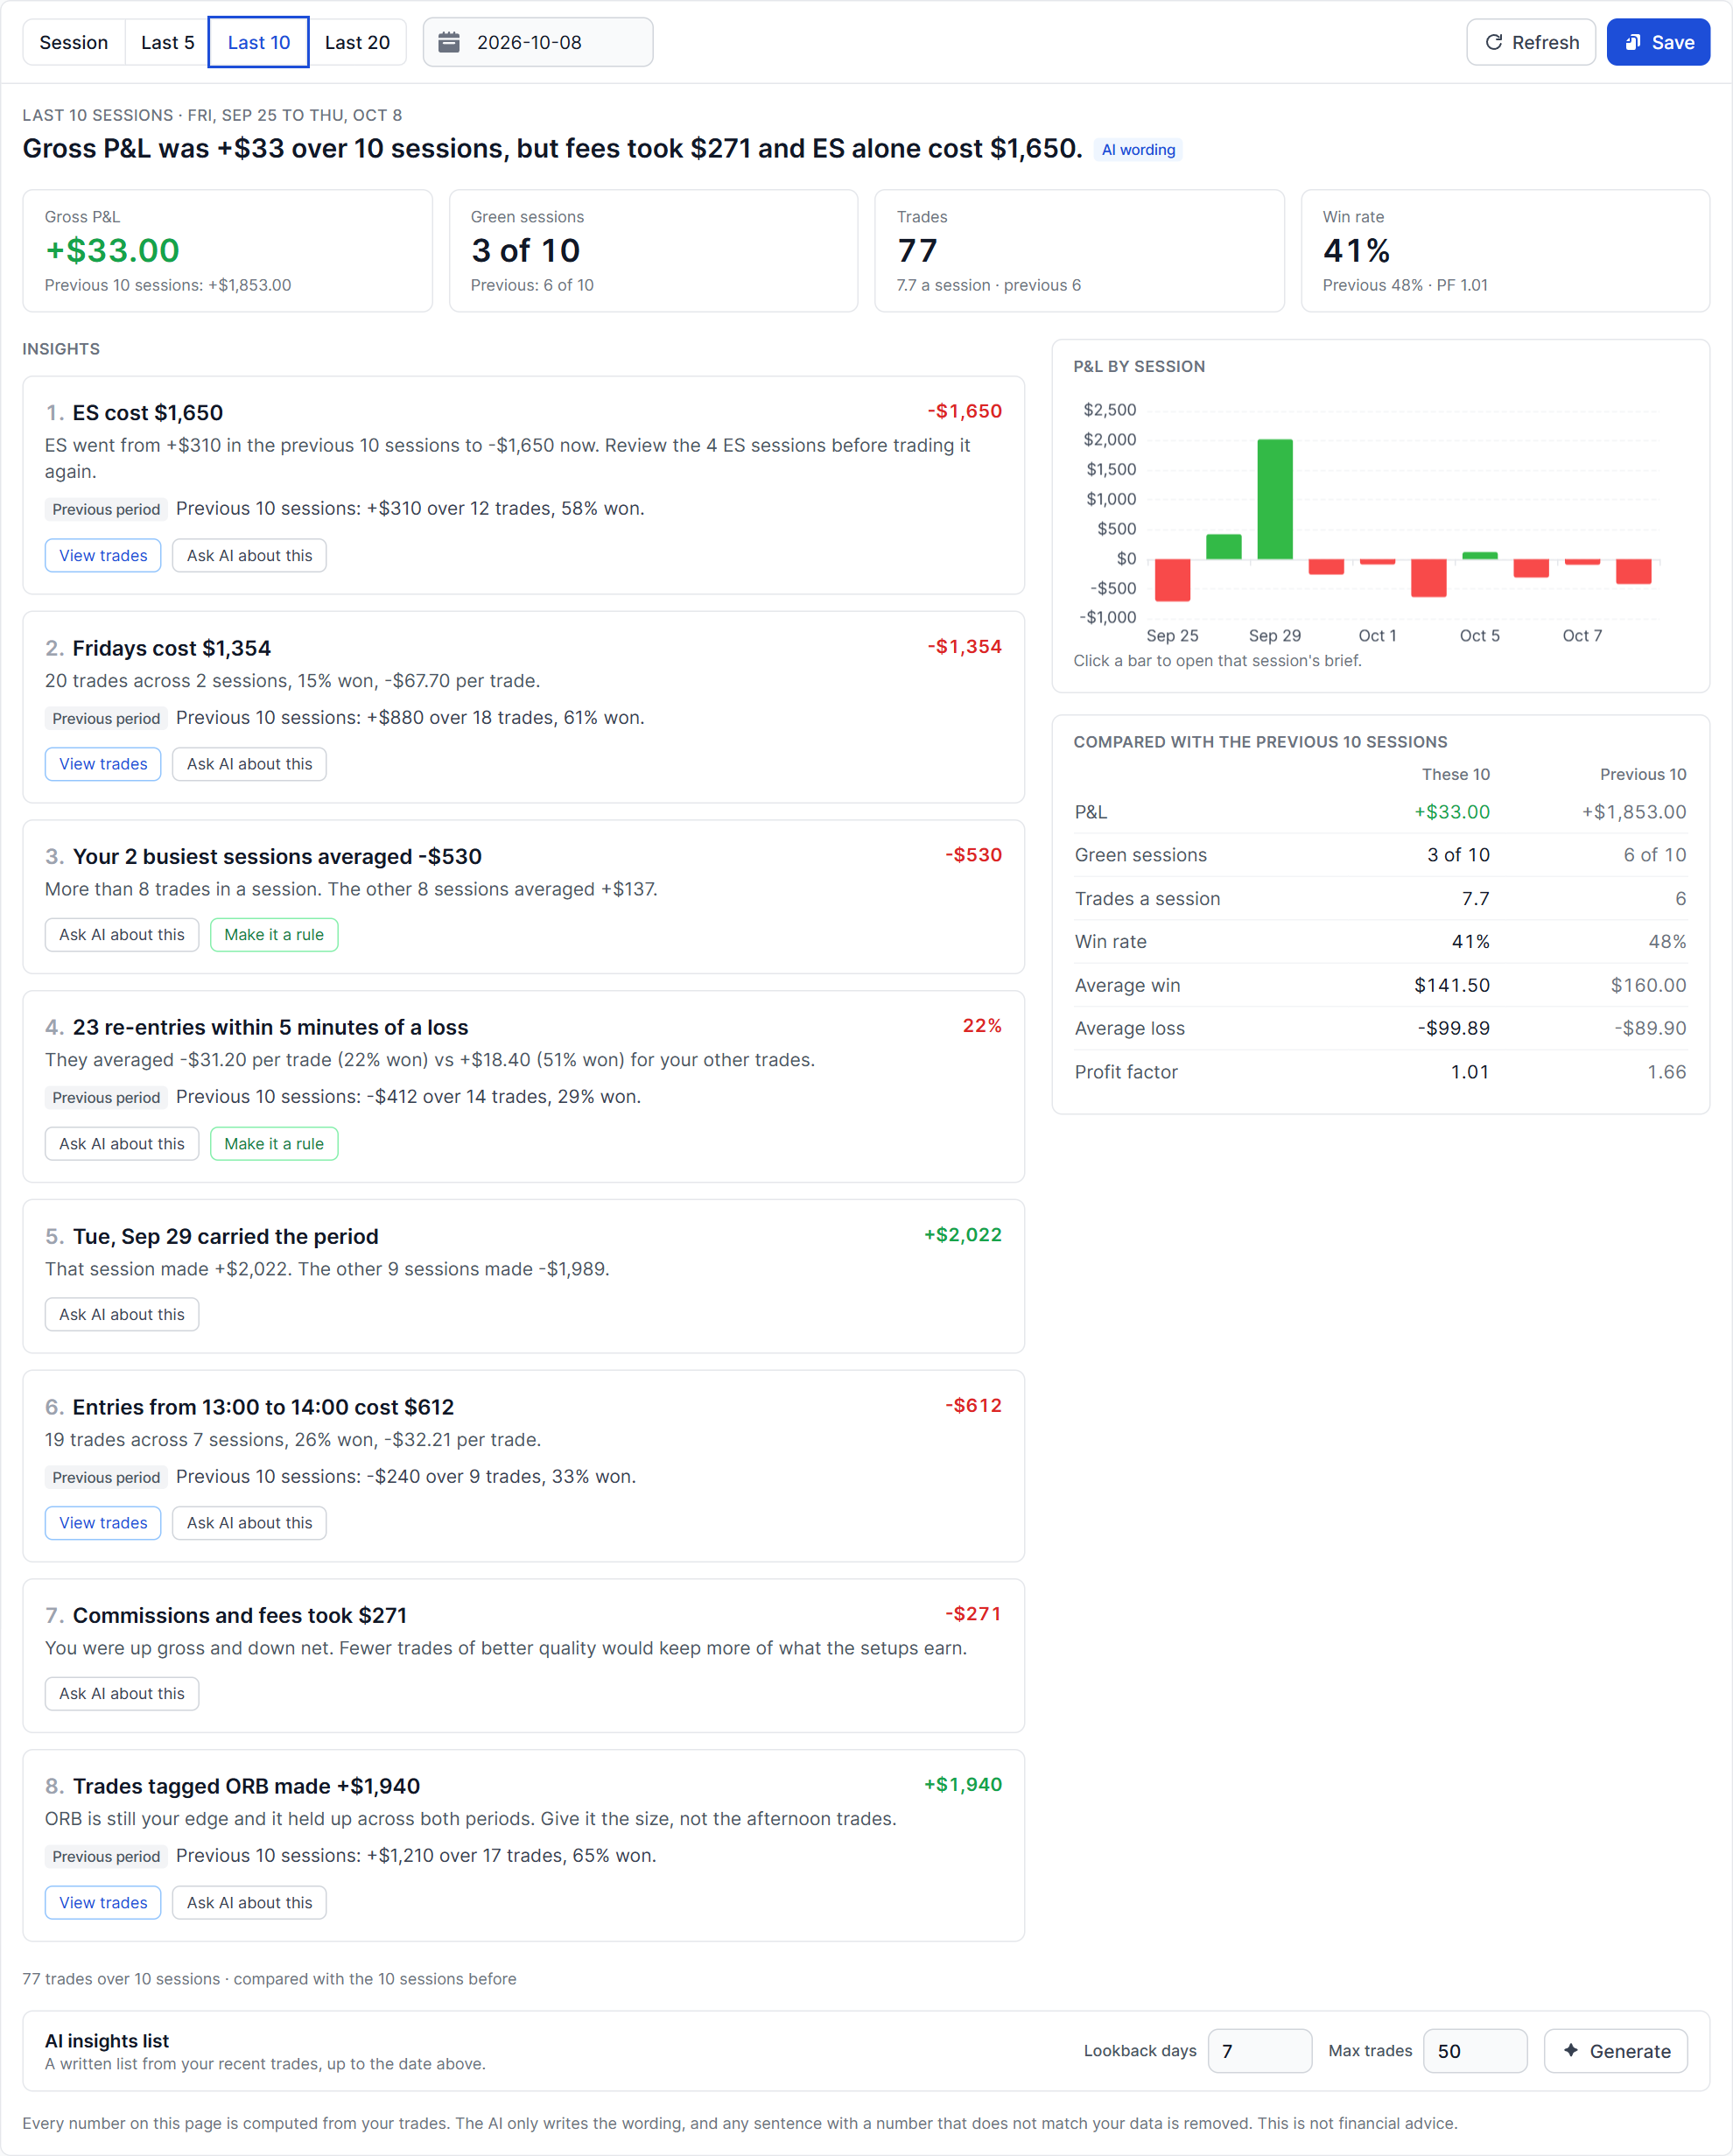
Look at the headline in that example: "Gross P&L was +$33 over 10 sessions, but fees took $271 and ES alone cost $1,650." That is the kind of thing you don't notice day by day.
The period review looks for:
- Your best and worst symbol, tag, entry hour, weekday and side (long or short) in the period. Slices that hold most of your trades are skipped, because "your long trades lost money" is useless if 90% of your trades are long.
- Re-entries after a loss, size raised after a loss, and losses past the planned stop, measured against the rest of the period.
- Holding losers longer than winners, with the actual average hold times.
- Average loss bigger than average win, with the win rate you would need to break even at that ratio.
- One session carrying (or sinking) the period: "Tue, Sep 29 carried the period. That session made +$2,022. The other 9 sessions made -$1,989."
- Your busiest sessions against the rest.
- Sessions that gave back most of their peak.
- Commissions and fees as a share of your gross P&L.
- Days you kept every rule against days you missed one. The fastest way to find out whether your rules are actually worth following.
The insights are ranked by how much money they represent, with at least one thing that worked kept on the list. On the right you get your P&L by session and a straight comparison with the previous period of the same length: P&L, green sessions, trades per session, win rate, average win, average loss and profit factor.
On Platinum, every insight also tells you whether it is new or ongoing: "Previous 10 sessions: +$310 over 12 trades, 58% won." ES did not just have a bad stretch. It went from making money to losing $1,650.
When everything is going right, the period review keeps you honest about why. Here is another trader's last 5 sessions: all green, +$21,899.60, and a 100% win rate.
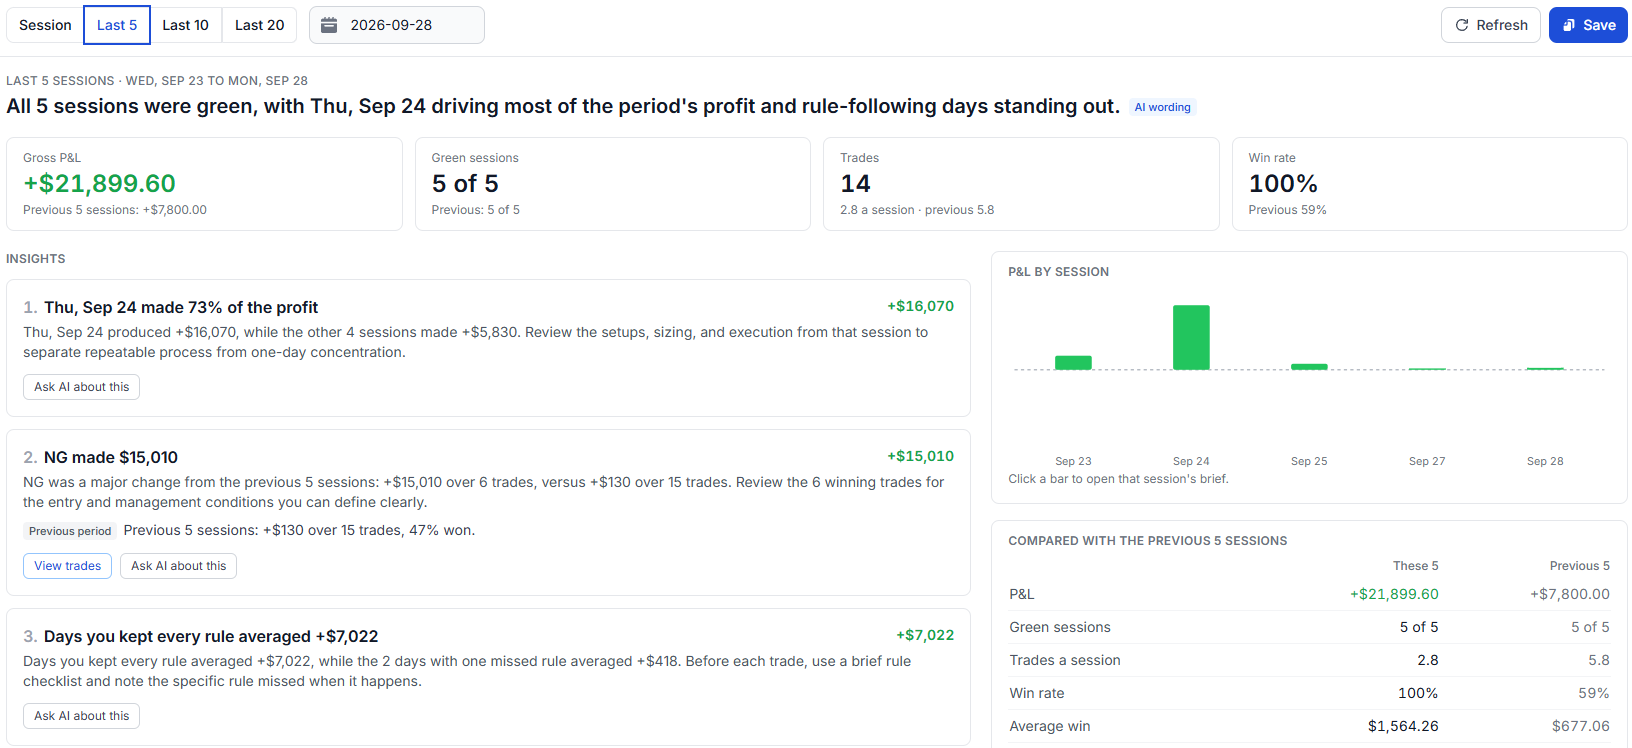
The brief does not stop at "great week". It points out that one session, Thu, Sep 24, made 73% of the profit, that NG went from +$130 over 15 trades in the previous 5 sessions to +$15,010 over 6, and that days with every rule kept averaged +$7,022 against +$418 on the 2 days with one rule missed. That last line is the best reason there is to keep following your rules when things are going well.
Drill into any session and come back
Click any bar in P&L by session to open that session's full brief. A Back to the last 10 sessions link stays at the top while you look around (including stepping through other sessions with the arrows), and takes you back to exactly the period you came from.

The Writing summary label in that screenshot means the AI wording is still on its way. Until it arrives you see our own wording, and every number on the page is already final.
Insights about a symbol, tag, hour, weekday or side also have a View trades button that filters your whole dashboard to those trades, so every chart and table in TradesViz is one click away from the insight.
Still want the classic AI insights list? It's at the bottom
Some of you liked the original AI Daily Insights: a written list of observations about your recent trades. It is still here, at the bottom of the page, under AI insights list.
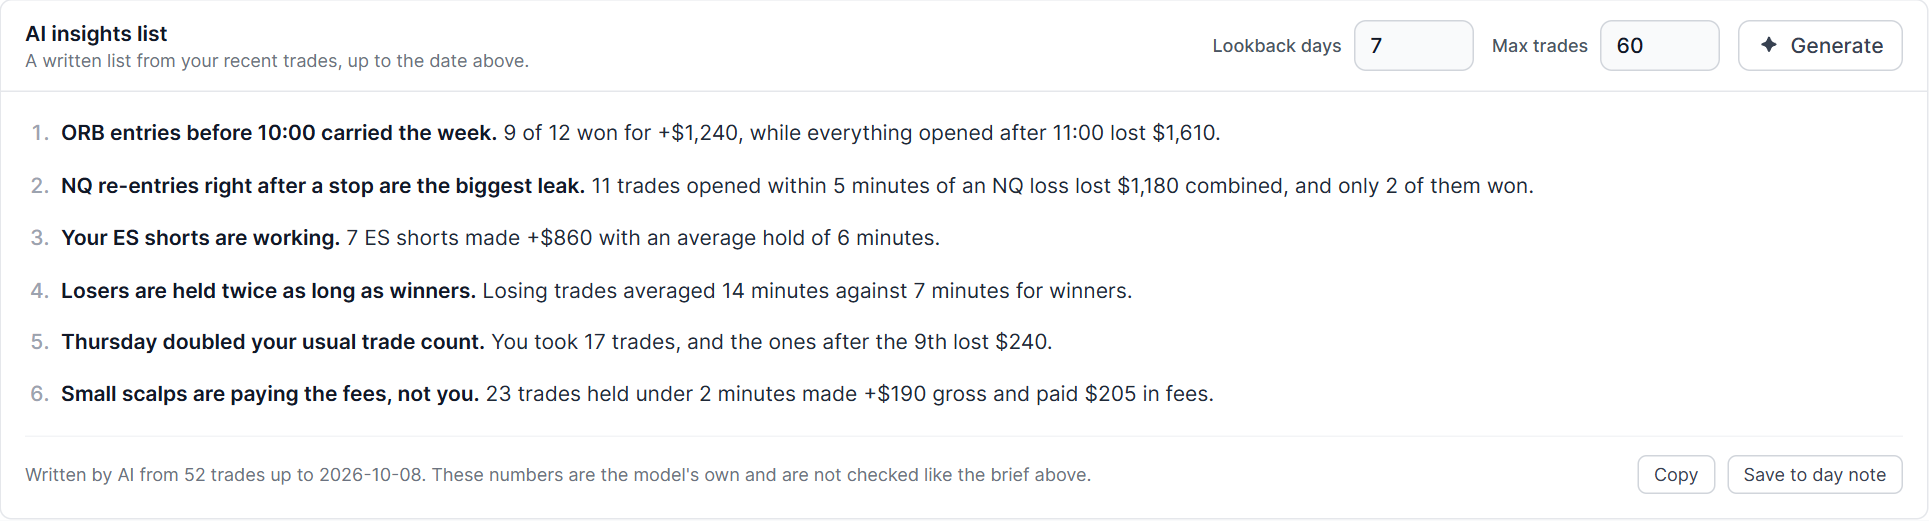
- Pick the date at the top of the page. The list covers the trades up to that date.
- Set Lookback days (up to 30) and Max trades (up to 100).
- Click Generate. You get up to 10 numbered insights, written for your next trading session.
- Use Copy or Save to day note to keep it in your journal.
We rebuilt this one too. The AI now gets your trades with everything that matters (P&L, side, prices, R-multiple, hold time, fees and tags), newest first, and it is allowed to write fewer than 10 insights when there isn't enough data for 10. One honest difference from the brief: in this list the AI does its own arithmetic, so its numbers are not checked against your data, and the page says so right under the list. Use the brief for numbers you can rely on, and the list for a free-form second opinion.
How the AI is kept honest
This is the part we care about most, so here it is plainly:
- TradesViz computes every number. P&L, percentiles, win rates, re-entries, R-multiples, your record on CPI days. All of it is calculated from your trades by TradesViz, the same way the rest of your trading journal is.
- The AI only writes the wording. It gets a compact set of computed facts (totals, card summaries, symbols, event names). It never gets your raw trades or your account details for the brief.
- Every sentence is checked. Before anything the AI writes reaches you, every number and every time in it is matched against the facts. If a sentence contains a number we didn't give it, the sentence is thrown away and you see our own wording instead. It cannot invent a statistic, round a loss into a gain, or make up a time.
- The page works without the AI. If AI is off, unavailable, or you have used today's allowance, you still get the entire brief: every card, chart, label and focus item. Only the wording changes.
- Nothing runs in the background. The AI wording is written when you open a brief, and reopening it later reuses it. No AI calls on your data while you are away.
- No emotional labels. The brief says "re-entered within 5 minutes of a loss", not "revenge trading" or "tilt". It describes what you did, with numbers, and lets you draw the conclusion.
Why this beats AI journals and "just ask ChatGPT"
| Pasting trades into a chatbot / typical "AI journal" | TradesViz AI Daily Brief | |
|---|---|---|
| Who does the math | A language model, across hundreds of rows | TradesViz, from your journal data |
| Are the numbers checked? | No | Every number and time in the AI's text is checked. Mismatches are removed. |
| Compared with what? | Nothing, unless you paste your whole history | Your last 60 sessions, and up to 250 on Platinum |
| Habit or bad day? | It guesses | Evidence labels based on your sessions, checked in older and newer history |
| Your stops, rules, tags, MFE/MAE | Only what is in the export | All of it, plus your rules and focus history |
| Next session | Nothing | Economic releases with your record on those days, earnings on your symbols, open positions and DTE |
| Memory | Starts from zero every chat | Grades yesterday's focus against today's trades |
| Effort | Export, paste, write a prompt, every day | Already waiting when you open TradesViz |
| What you can do next | Read more text | Open the trades, filter the dashboard, ask a follow-up, make it a rule, save it to your notes |
To be clear, we love AI for open questions. That is why TradesViz has AI Trade Chat, AI Query, AI Notes, and an MCP server that lets you talk to your trading journal from Claude or ChatGPT. But a chatbot is a tool you have to drive, every day, and it will happily give you a wrong number with total confidence. A daily review should be the opposite: correct by default, specific to you, and ready before you ask. That is what the AI Daily Brief is.
Three ways to use it
1. The 2-minute pre-market check
- Open TradesViz. On Overview, the Daily Brief line shows yesterday's session. Click Open brief.
- Read the headline and the first card. That is the one thing to remember today.
- Check Next session: is there a release at 08:30? What is your record on those days? Are you holding anything through earnings, or options close to expiry?
- Read your focus items (Platinum) and look at your hour map for today. If your afternoons lose money on this weekday, decide now when you stop.
2. The 5-minute post-close review
- After your trades sync, open the brief for today.
- Go through What stood out. Open the trades behind each card with Show trades, and click into the worst one.
- If a card is labeled Repeated across sessions, it is not bad luck. Click Make it a rule.
- Tag anything untagged with Review the day, so tomorrow's brief can measure it.
- Click Save › Day Note to keep the brief in your journal next to your own notes.
3. The weekly review
- Switch to Last 10 (or Last 5 if you trade a few days a week, Last 20 for a monthly look).
- Read the numbered insights top to bottom. They are ranked by money, so the first two are where your edge is leaking or coming from.
- Check the comparison with the previous period. Are you trading more, winning less, or paying more in fees?
- Click the worst bar in P&L by session to see that day in full, then Back to the last 10 sessions.
- Use View trades on the worst symbol or hour to dig into it with every chart in TradesViz, or Ask AI about this for a deeper question.
Pro and Platinum
| Feature | Pro | Platinum |
|---|---|---|
| Session brief: score against your last 60 sessions, P&L curve, flagged trades, best and worst trade | Yes | Yes |
| Rules kept and streak, journal hygiene | Yes | Yes |
| Next session: economic releases, earnings, open positions and DTE | Yes | Yes |
| AI wording, checked against your data | Yes | Yes |
| Overview line, sidebar dot, Day Explore button | Yes | Yes |
| Classic AI insights list | Yes | Yes |
| Every card measured against your history, with evidence labels | - | Yes |
| Your record on upcoming economic release days | - | Yes |
| Your weekday by entry hour, and how you trade after a day like this | - | Yes |
| Focus items graded automatically on your next session | - | Yes |
| Period review (Last 5, 10 or 20 sessions) | Top 4 insights | Top 8 insights, each compared with the previous period |
| Make it a rule | Yes | Yes, also from focus items |
On Pro, the brief shows one small hint where a Platinum comparison would appear, and one panel listing what Platinum adds. It never hides the parts of your brief you already have.
FAQ
Do I have to do anything for the brief to appear?
No. Import or sync your trades as usual. When you open TradesViz, the Overview line shows your latest session, marked New until you open it.
What data is sent to the AI?
For the brief, only the computed facts: totals, card summaries, symbols, tags and event names. Never your raw trades and never your account details. For the classic AI insights list, the trades in your chosen window are sent (times, symbols, sides, prices, P&L, fees and tags). Both use the same AI data consent as AI Notes and AI Chat, which you can turn on or off in Settings.
Does it use my AI allowance?
Writing the wording for a new brief, or generating an AI insights list, uses one of your daily AI summaries: 10 a day on Pro and 20 on Platinum. Reopening a brief you have already read does not. The numbers, charts, cards and focus items never use your allowance.
What if I don't want the AI at all?
Then don't turn on AI consent. The brief still shows everything, with our own wording instead of the AI's.
I trade futures and my session starts at 18:00. Does the brief follow that?
Yes. Sessions follow your trading day setting, exactly like your Calendar and Day Explore.
Does it respect my account selection and filters?
Yes. The brief uses the accounts and filters you have selected, just like every other tab.
What if I only have a few trades?
The session brief works from your first session. Comparisons with your history appear once you have enough sessions to compare, and the period review tells you when you have fewer sessions than you asked for ("2 sessions, all available") instead of padding the list.
Why do some cards say "Observation"?
Because it happened, but your history doesn't have enough sessions to call it a habit yet. We would rather tell you that than dress up a coincidence as a pattern.
Can I look at older sessions?
Yes. Use the arrows or the date box to open any session, or click a bar in the period review.
How is this different from the AI Coach Trading Review?
The AI Coach Trading Review scans your whole filter for the biggest long-running leaks. The AI Daily Brief is about your sessions: what happened in the last one, what to watch in the next one, and how your last few weeks compare. They work together, and the Daily Brief line sits right under Trading Review on Overview.
Is this financial advice?
No. The brief describes what you did and how it compares with your own history. It never predicts markets or recommends trades.
The AI Daily Brief is live for every Pro and Platinum account today. Open Tools › AI Daily Brief, or just look under Trading Review on your Overview tab. If there is a pattern you want the brief to catch, or a number you think is wrong, tell us at [email protected]. We read every one.