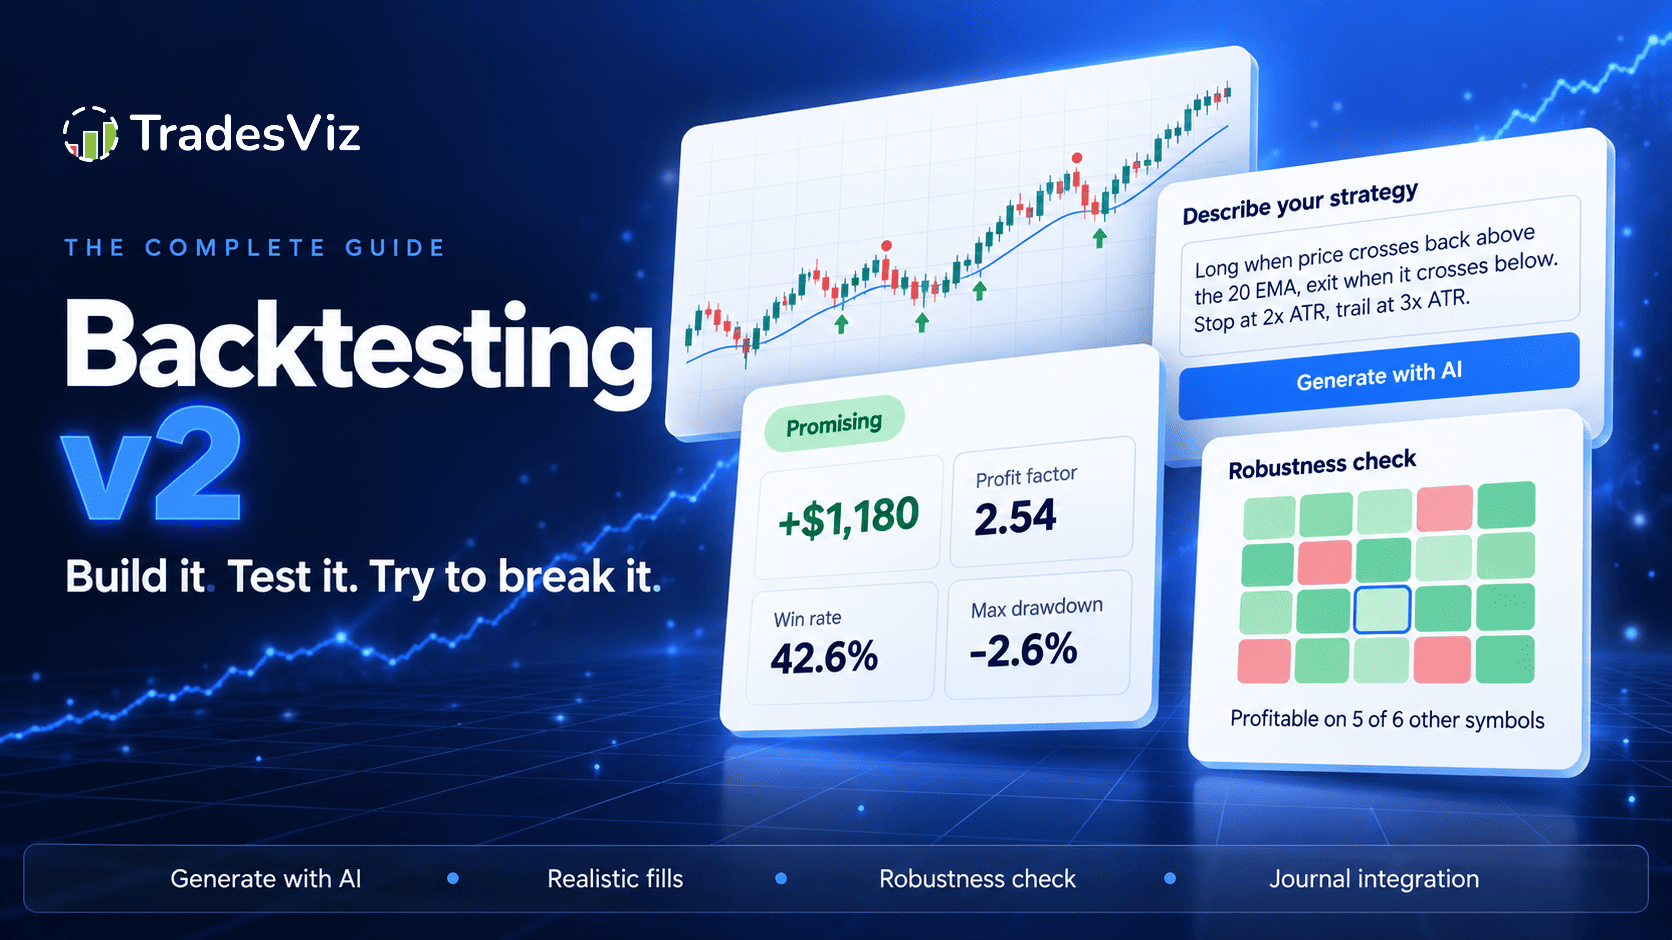
Backtesting a trading strategy is easy. Trusting the result is the hard part.
Type an EMA crossover into almost any backtester, pick a date range and you will get a profit, an equity curve and a win rate within seconds. What you usually will not get is an answer to the only question that matters: would this have worked if you had actually traded it, and will it keep working? Fills that assume perfect prices, stops that never gap, a profit carried by two lucky trades, settings tuned until the one window you tested looks great. Most backtests flatter the strategy, and most traders find out live.
This guide shows you how to backtest a trading strategy properly, step by step, using the rebuilt TradesViz Backtester v2: how to write entry and exit rules with 80+ indicators, how to add a stop loss, take profit and position sizing, how to read the results, and how to check whether a result is an edge or just luck before you risk real money on it. The backtesting examples use real runs; the sharing screenshots illustrate the workflow with a sample simulation.
What is backtesting?
Backtesting means applying a fixed set of trading rules to historical price data and recording every trade those rules would have taken: where it entered, where it exited and what it made or lost after costs. A backtest turns a trading idea such as "buy when the 10 EMA crosses above the 25 EMA" into numbers you can judge: how many trades, how often they win, how big the wins are compared with the losses, and how deep the drawdowns get.
A good backtest answers three questions:
- Did the rules make money on this market, timeframe and period, after commissions and slippage?
- How did they make it? From a few outsized winners or many small ones, with which exits, at what risk per trade?
- Is the result real? Would a strategy with no edge have done just as well by chance, and does it hold up on other periods, other symbols and slightly different settings?
Most tools stop at the first question. The third one is where trading strategies usually fall apart, so it gets as much attention in this guide as the first.
What backtesting cannot do is promise the future. Markets change, and a strategy that worked through one regime can stop working in the next. The goal is not certainty. The goal is to throw out bad ideas cheaply, and to know exactly how much confidence a good-looking result deserves.
What is new in TradesViz Backtester v2
The original TradesViz backtester launched as an indicator query engine: write an entry and an exit, get trades. Version 2 keeps that query language and rebuilds everything around it.
- A new simulation engine with realistic fills. Orders fill at the next bar's open or the signal bar's close, stop losses are stop-market orders that fill at the open when price gaps through them, and when one bar touches both the stop and the target, finer data decides which came first.
- Stop loss, take profit, trailing stop, breakeven and time exits. Stops in points, ticks, percent, ATR multiples or beyond the signal bar; targets in R multiples; flat at session end.
- Position sizing. Fixed size, percent of equity, or risk a percentage or dollar amount per trade sized from the stop distance.
- Long only, short only, or long and short with stop-and-reverse.
- Futures in dollars. P&L uses each contract's point value, so a micro and a full-size contract are no longer the same number.
- Multi-step setups such as "price pulls back to the EMA, then a strong candle forms within 5 bars".
- Generate with AI, powered by AI Trade Chat: describe a strategy in plain English and get rules, steps and risk settings that are compiled before they are applied.
- A run report written from your settings: a verdict, a plain-English readback of exactly what ran, warnings to read before trusting the numbers, and a breakdown of how signals turned into trades.
- A luck check on every run, built into the verdict.
- A bar inspector: click any candle to see which conditions were true and why a trade did or did not happen there.
- A robustness check: the same rules on earlier periods and other symbols, a grid of stops and targets, and a grid of the numbers in your conditions, all scored across periods so you are not just picking the luckiest setting.
- Risk presets, strategy templates, saved runs and run notes, and copying simulated trades into a journal account.
- Shareable strategy tests. Publish a saved report with your chosen rules, settings and results, share it by link or list it in the public strategy test library, and optionally let readers load the settings into their own backtester.
The rest of this guide walks through each of these while backtesting real strategies.
How to backtest a trading strategy, step by step
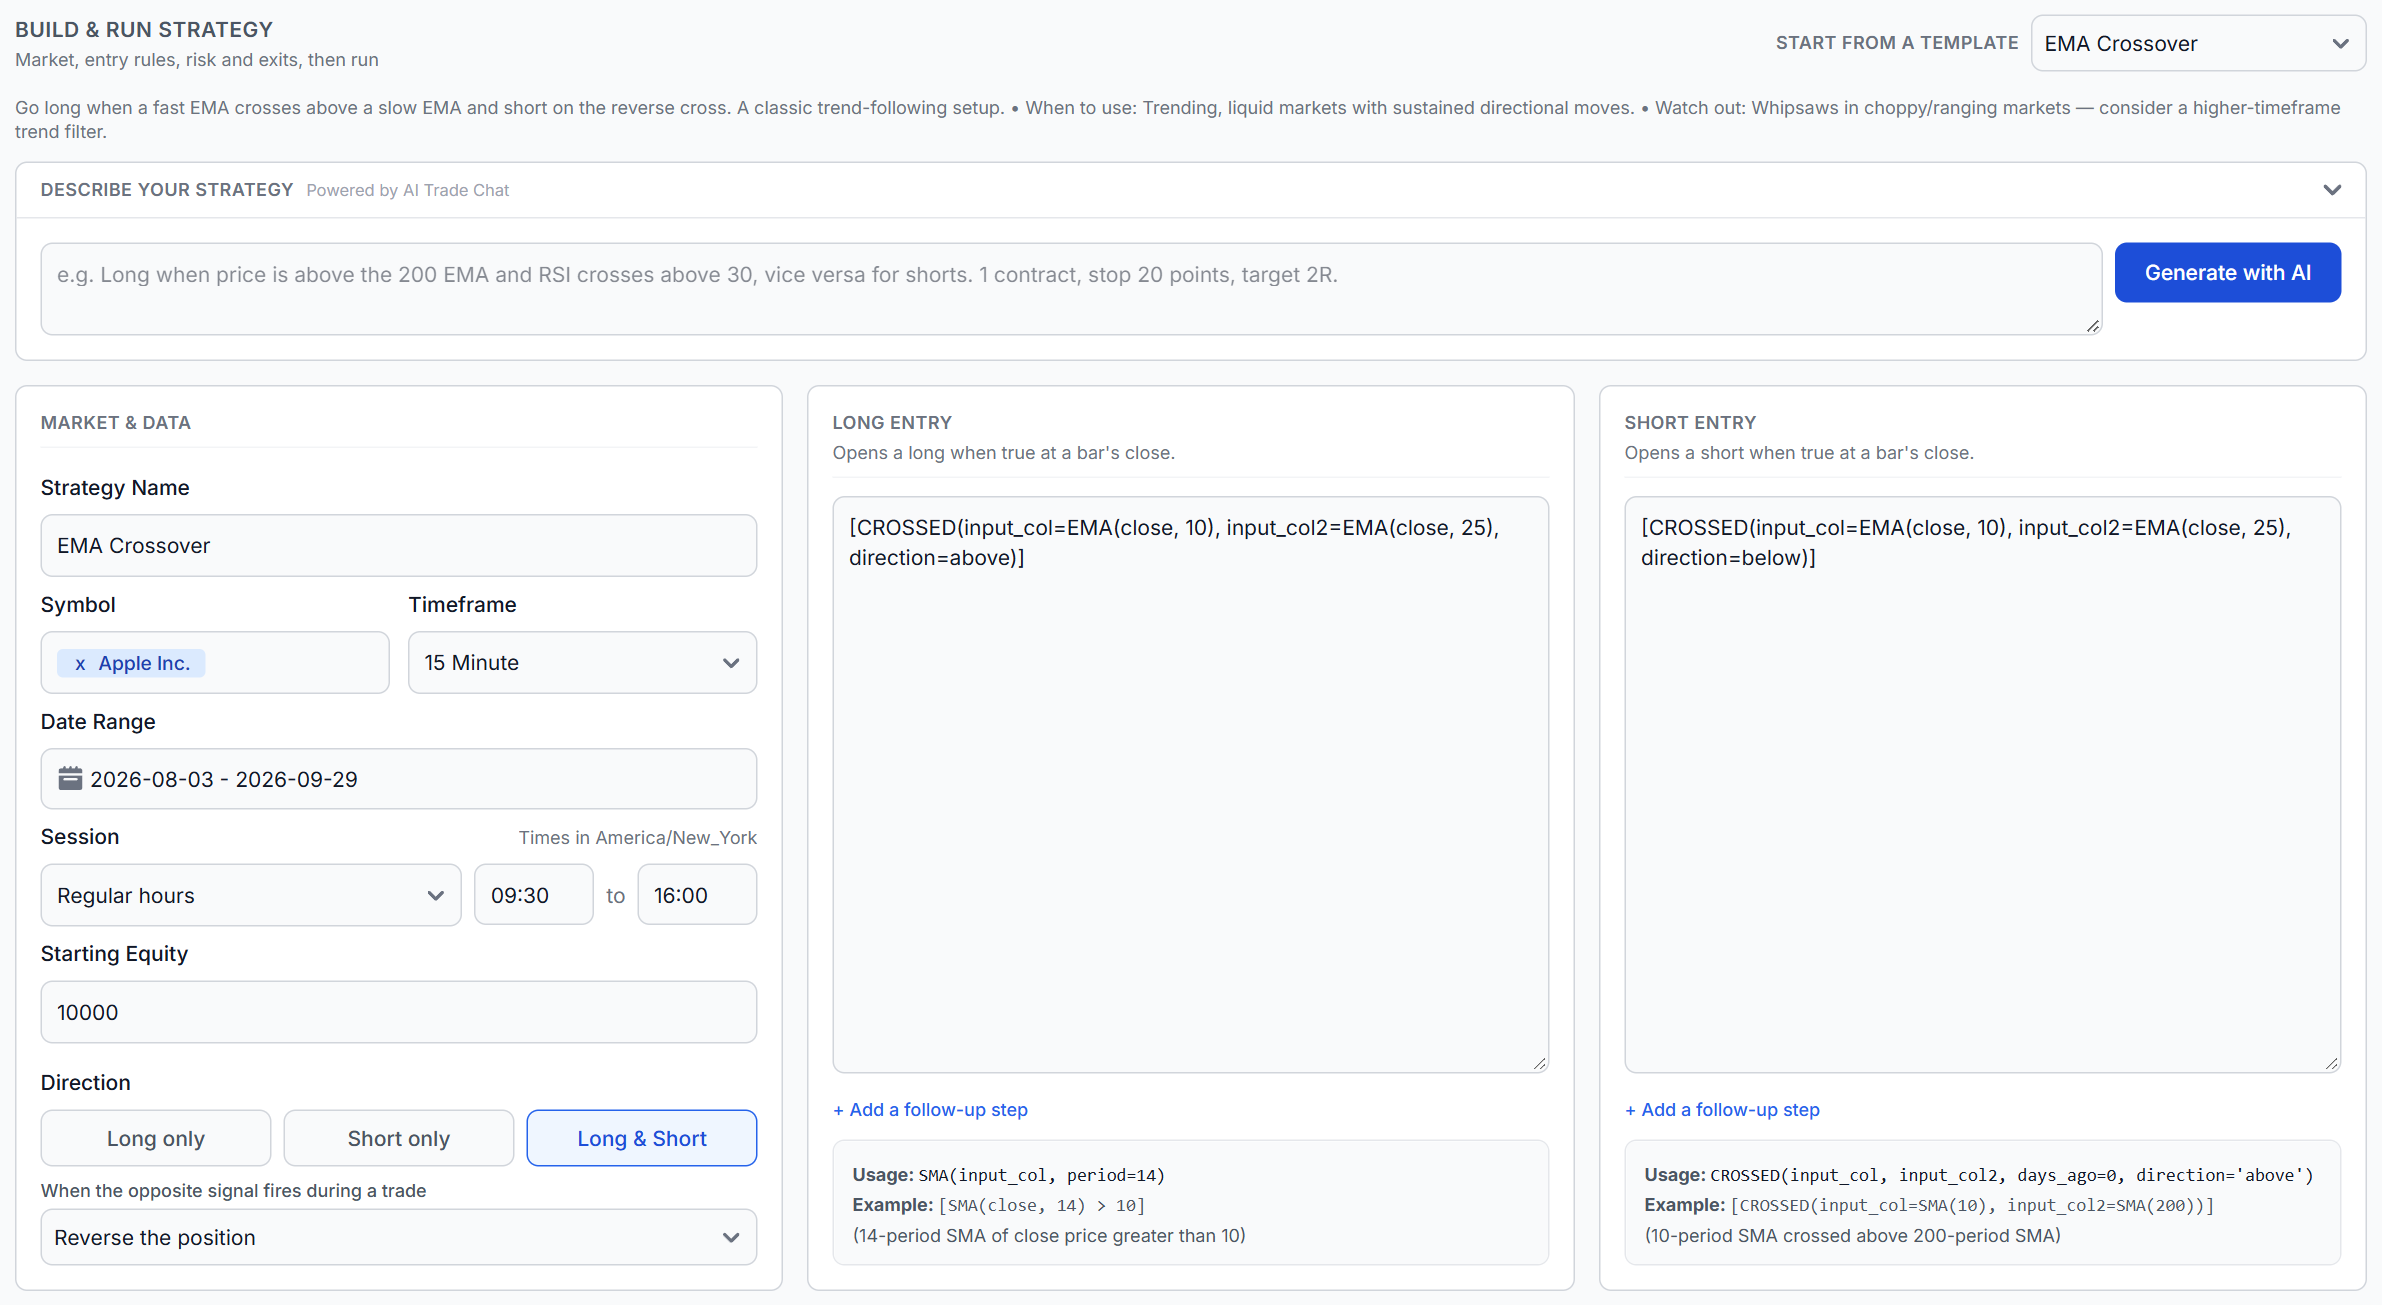
Open the backtester from the tools menu (the four-square icon at the top right of your dashboard) or go straight to tradesviz.com/backtester. The page reads top to bottom in the order you build a test: market and data, entry rules, risk and exits, then a one-line summary of what will run.
Step 1: Choose the market, timeframe and session
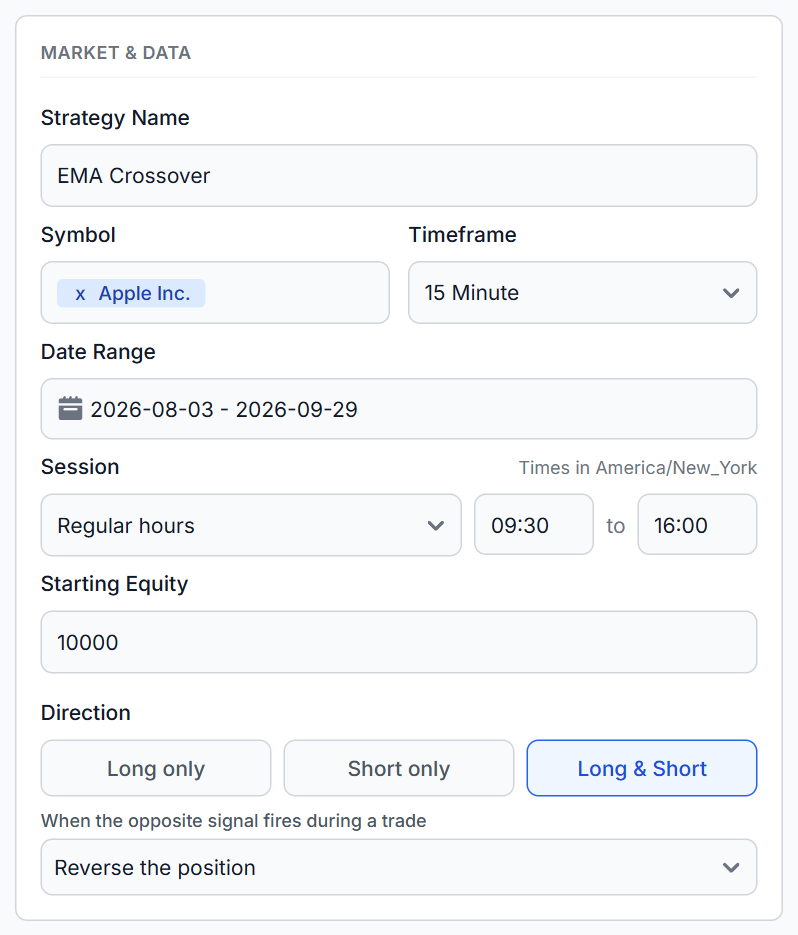
- Symbol. Stocks and ETFs, futures, forex, crypto and indices. Type to search.
- Timeframe. 1, 2, 3, 5, 10, 15, 20 and 30 minutes, 1, 2, 3 and 4 hours, or daily bars. Intraday and end-of-day backtesting use the same engine.
- Date range. The end date is included. The backtester loads extra history before the start date automatically so long indicators such as a 200-period moving average are already warmed up on the first day, instead of producing a burst of false signals.
- Session. Regular hours, extended hours, the full futures session, overnight, all day, or your own times, always in the exchange's own time zone. Daylight saving changes are handled bar by bar, and sessions that cross midnight work as one session.
- Starting equity. The account the strategy trades from. Percent-of-equity and risk-based sizing compound from it.
Step 2: Write your entry and exit rules with indicators
Rules are written as conditions in square brackets, joined with AND or OR. Each condition is checked at the close of every bar. The backtester has 80+ indicators and functions, including SMA, EMA, WMA, RMA, MACD, RSI, Stochastic, Stochastic RSI, Connors RSI, Bollinger Bands, Keltner Channels, Donchian Channels, ATR, ADX and DI, Aroon, CCI, Williams %R, Ichimoku, TRIX, KST, TSI, Ultimate Oscillator, Force Index and more, plus functions for crossovers, look-backs and arithmetic.
A few examples of common trading strategies written as backtest rules:
| Strategy | Entry | Exit |
|---|---|---|
| EMA crossover | [CROSSED(input_col=EMA(10), input_col2=EMA(25), direction=above)] |
[CROSSED(input_col=EMA(10), input_col2=EMA(25), direction=below)] |
| RSI oversold bounce | [CROSSED(input_col=RSI(14), input_col2=30, direction=above)] |
[CROSSED(input_col=RSI(14), input_col2=70, direction=below)] |
| MACD signal cross | [CROSSED(input_col=MACD_LINE(close, 12, 26, 9), input_col2=MACD_SIGNAL(close, 12, 26, 9), direction=above)] |
The same cross with direction=below |
| Trend filter | [close > SMA(50)] |
[close < SMA(50)] |
| Pullback in an uptrend | [close > EMA(close, 200)] AND [F_MIN(low, period=5) <= EMA(close, 20)] AND [close > open] |
A stop and target instead of an exit rule |
The rules that trip people up most often:
- One comparison per bracket.
[RSI(14) < 30] AND [close > SMA(200)], never[RSI(14) < 30 and close > SMA(200)]. - AND and OR apply left to right. Put an OR group first, then the AND conditions that must hold for all of it.
- Look-backs count bars, not days.
DAYS_AGO(close, 5)on 15-minute bars is 75 minutes ago. Compare with an earlier bar to test whether something is rising:[RSI(close, 14) > DAYS_AGO(RSI(close, 14), 5)]. - "Touched in the last N bars" uses the lowest low or highest high.
[F_MIN(low, period=5) <= EMA(close, 20)]is true when price reached the 20 EMA at any point in the last few bars.
Mistakes are caught before anything runs. An error points at the box, the condition and the character where the problem is. Screener-only functions that look at the last bars of a whole data set, such as WITHIN_LAST or TREND, are rejected with the per-bar version to use instead, because bar by bar they would quietly never fire. If you would rather not start from a blank box, the template menu loads five ready-made strategies: EMA Crossover, RSI Oversold Bounce, MACD Signal Cross, SMA Trend Filter and EMA Pullback.
Step 3: Long, short, or both
Pick Long only or Short only and the two boxes become an entry rule and an exit rule. Pick Long & Short and they become a long entry and a short entry, and you choose what happens when the opposite signal fires during a trade: reverse the position (stop and reverse) or ignore it. In long and short mode, every result is also split into All, Long and Short columns, so you can see whether one side is carrying the other.
Step 4: Build multi-step setups
Many real setups are sequences, not single conditions: a pullback, then a confirmation candle. Under each entry box, + Add a follow-up step adds a step that must happen within a number of bars after the previous one. You can chain up to three steps, and the entry fires on the bar of the last one.
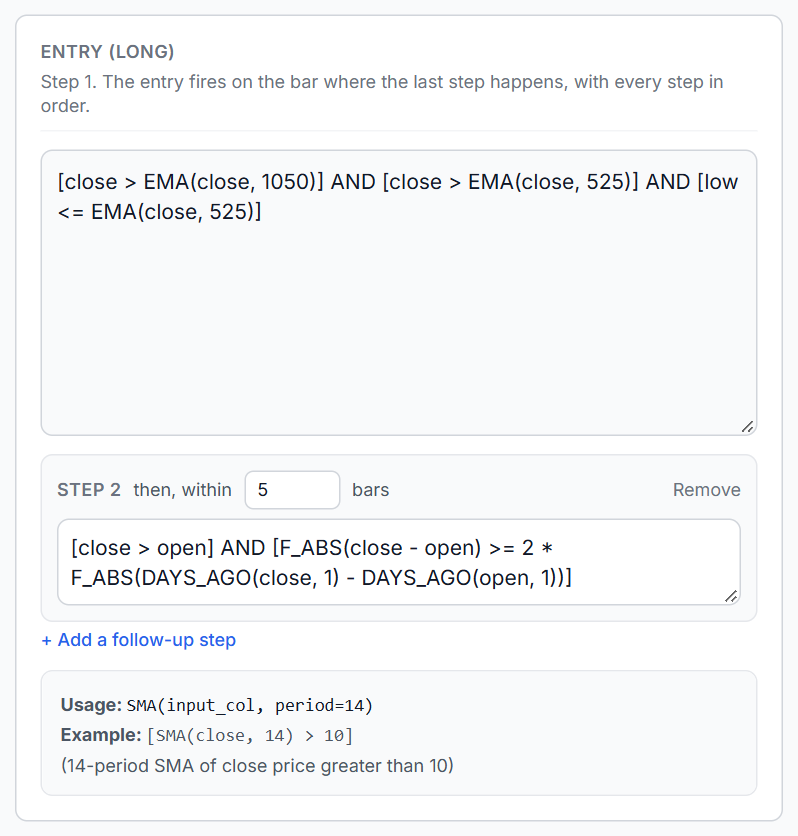
For example, a pullback-and-reversal setup on a trending market:
- Step 1:
[close > EMA(close, 1050)] AND [close > EMA(close, 525)] AND [low <= EMA(close, 525)](in an uptrend, price dips to the 525 EMA) - Step 2, within 5 bars:
[close > open] AND [F_ABS(close - open) >= 2 * F_ABS(DAYS_AGO(close, 1) - DAYS_AGO(open, 1))](a bullish candle at least twice the size of the previous one)
Each step must happen on a later bar than the one before, inside the same session. When a setup never completes, the run report says which step never followed instead of just showing zero trades.
Step 5: Set your stop loss, take profit and position size
Exits are where most of a strategy's character comes from, and where most backtesters cut corners. The Risk & Exits section has every common exit, and every trade closes on whichever one is hit first.
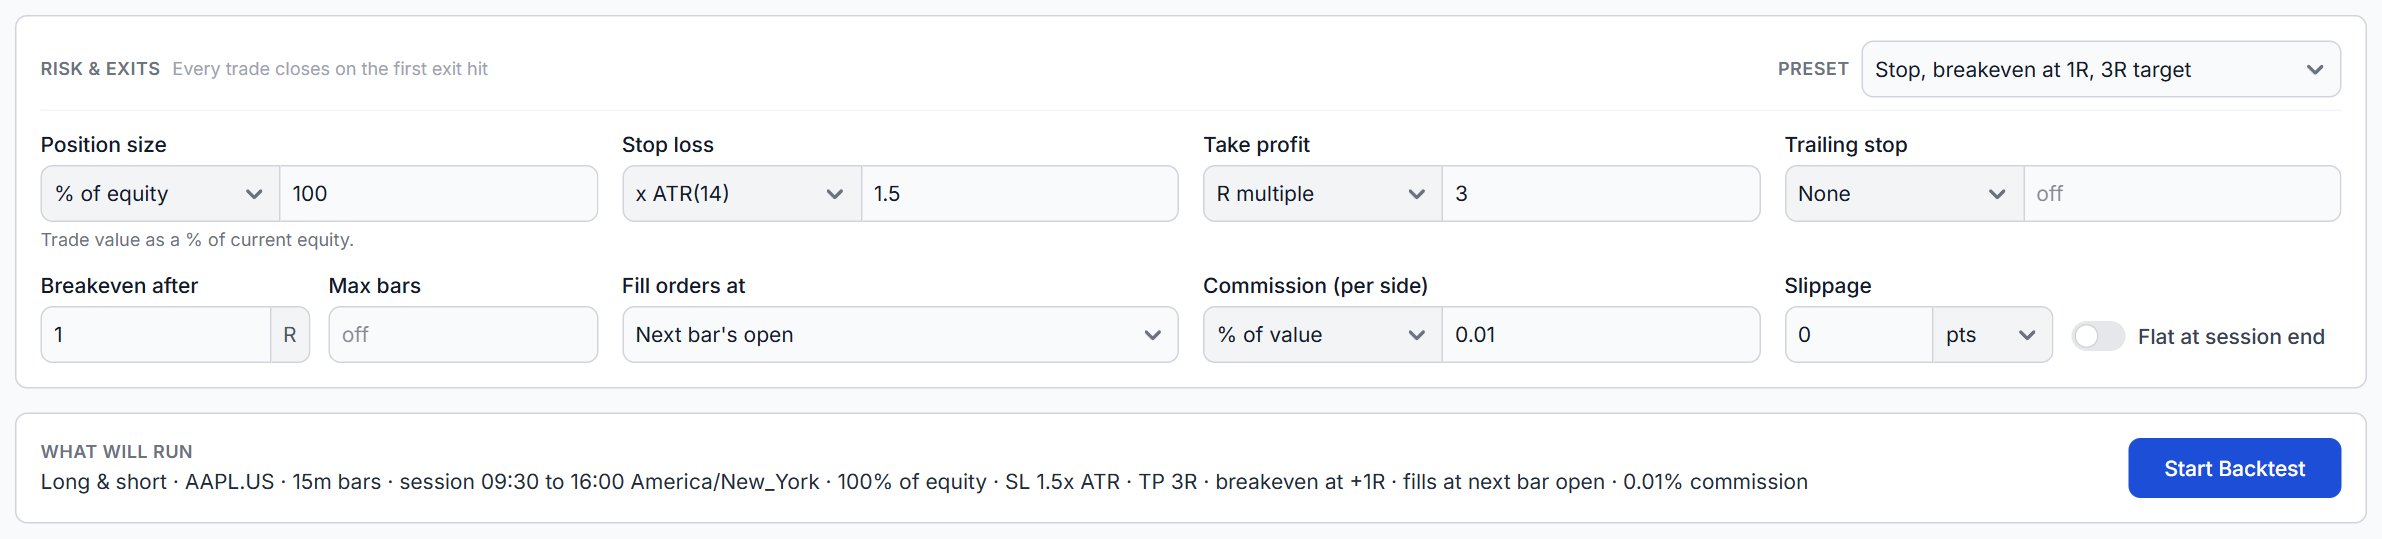
- Stop loss: points, ticks, percent of the entry price, a multiple of ATR(14), or just beyond the signal bar's low (longs) or high (shorts).
- Take profit: points, ticks, percent, ATR multiple, or an R multiple of the stop distance, so "3R" means three times what the trade risked.
- Trailing stop in points, ticks, percent or ATR, and move to breakeven once a trade is a set number of R in profit.
- Max bars in trade (a time stop) and flat at session end for day-trading strategies.
- Position size: a fixed number of shares or contracts, a percent of equity, or a risk of a percentage or dollar amount per trade, sized from the stop distance. Risk-based sizing that cannot afford even the minimum size skips the trade rather than quietly forcing one contract and risking more than you set.
- Commission and slippage: commission as a percent of trade value or per share or contract, per side; slippage in points or ticks per fill.
- Fills: at the next bar's open (the realistic default) or at the signal bar's close.
If you are not sure where to start, the Preset menu fills these in with one click and every value stays editable: Signals only, Stop + 2R target, Stop with breakeven at 1R and a 3R target, Trend follower (trailing stop), Scalp (1R target, max 10 bars), Day trade (2R, flat at close), Risk 1% per trade, and Fixed hold (exit after 10 bars). Change anything and the preset switches to Custom. The What will run line under the settings always shows the whole test in one sentence before you press Start Backtest.
Or describe the strategy in plain English
Above the rules, Describe your strategy takes an idea in your own words, for example "Long when price is above the 200 EMA and RSI crosses above 30, vice versa for shorts, 1 contract, stop 20 points, target 2R", and Generate with AI turns it into conditions, follow-up steps and risk settings.
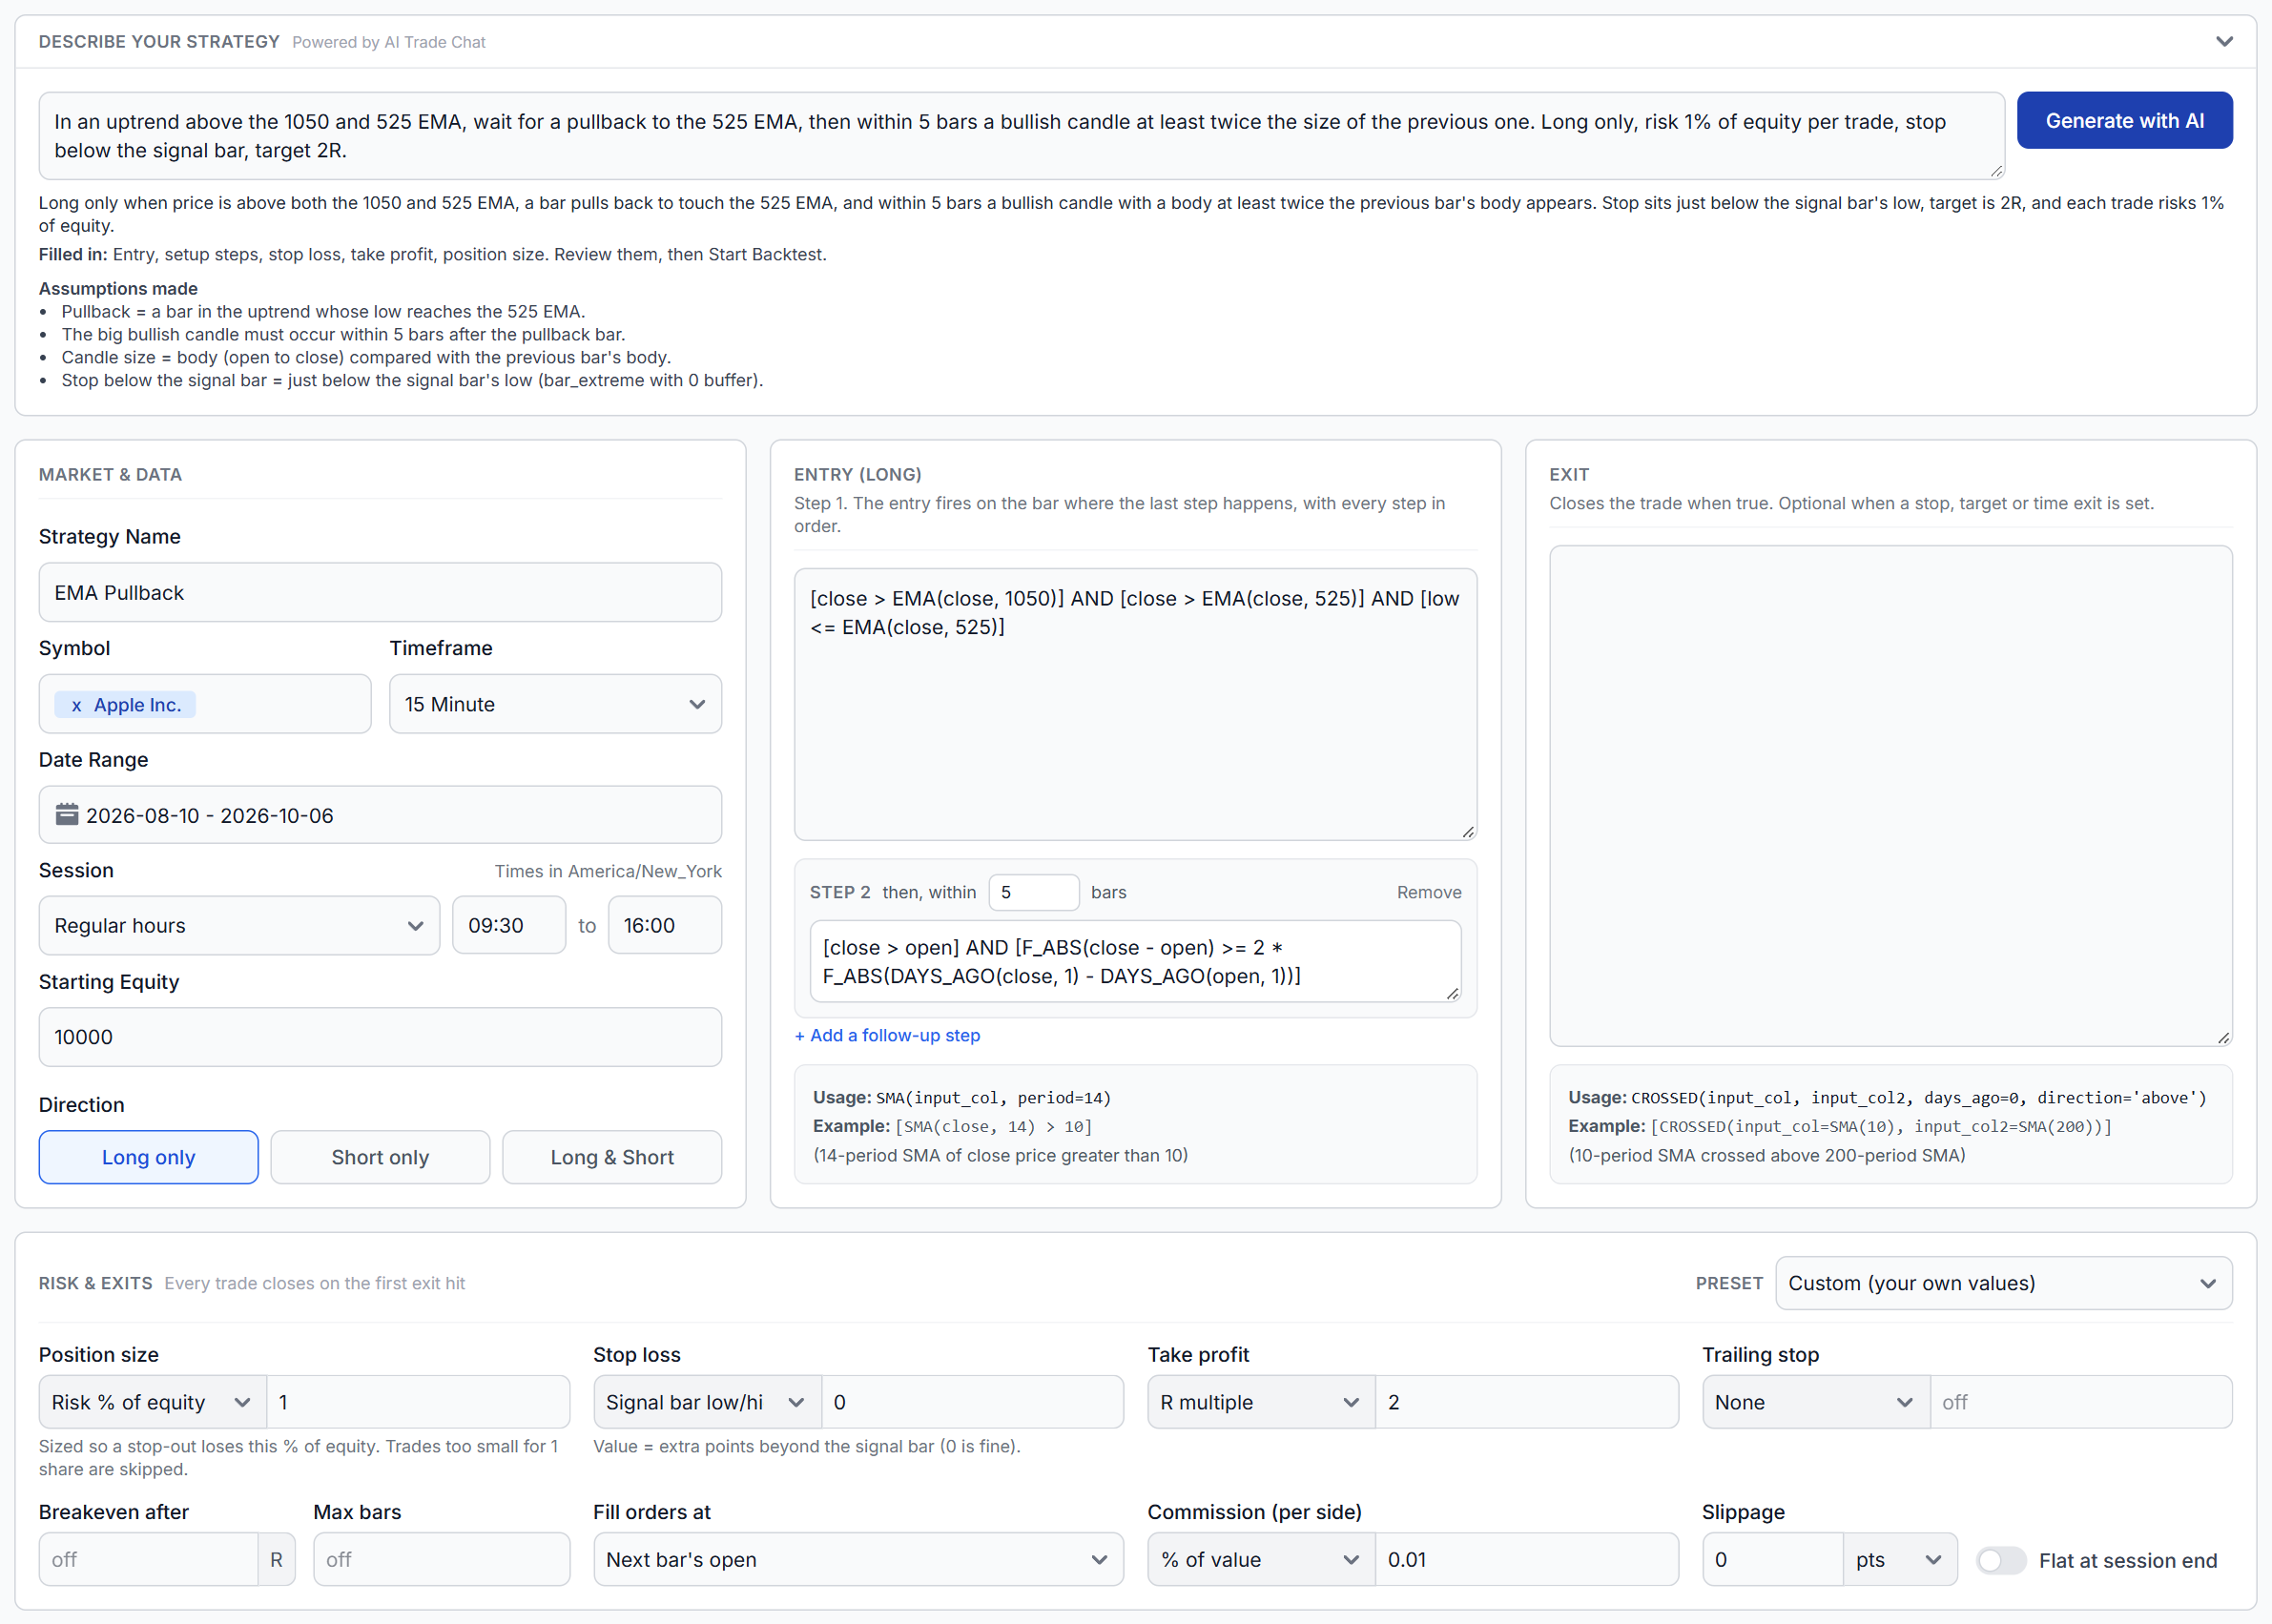
Two things make this different from asking a chatbot for code. First, every draft is compiled before it is applied: a draft that does not compile is never put into your boxes and does not use up an AI credit. Second, the AI has to show its work. Every interpretation of a vague phrase is listed as an assumption ("Pullback = a bar whose low reaches the 525 EMA"), and anything the backtester cannot do yet is listed as not applied instead of being silently dropped. You review it, edit it, and run it.
Step 6: Run the backtest and read the report
Press Start Backtest. The report opens with a verdict and the headline numbers, followed by a plain-English description of exactly what ran, generated from your settings rather than written by the AI, so you can check that the test is the one you meant.
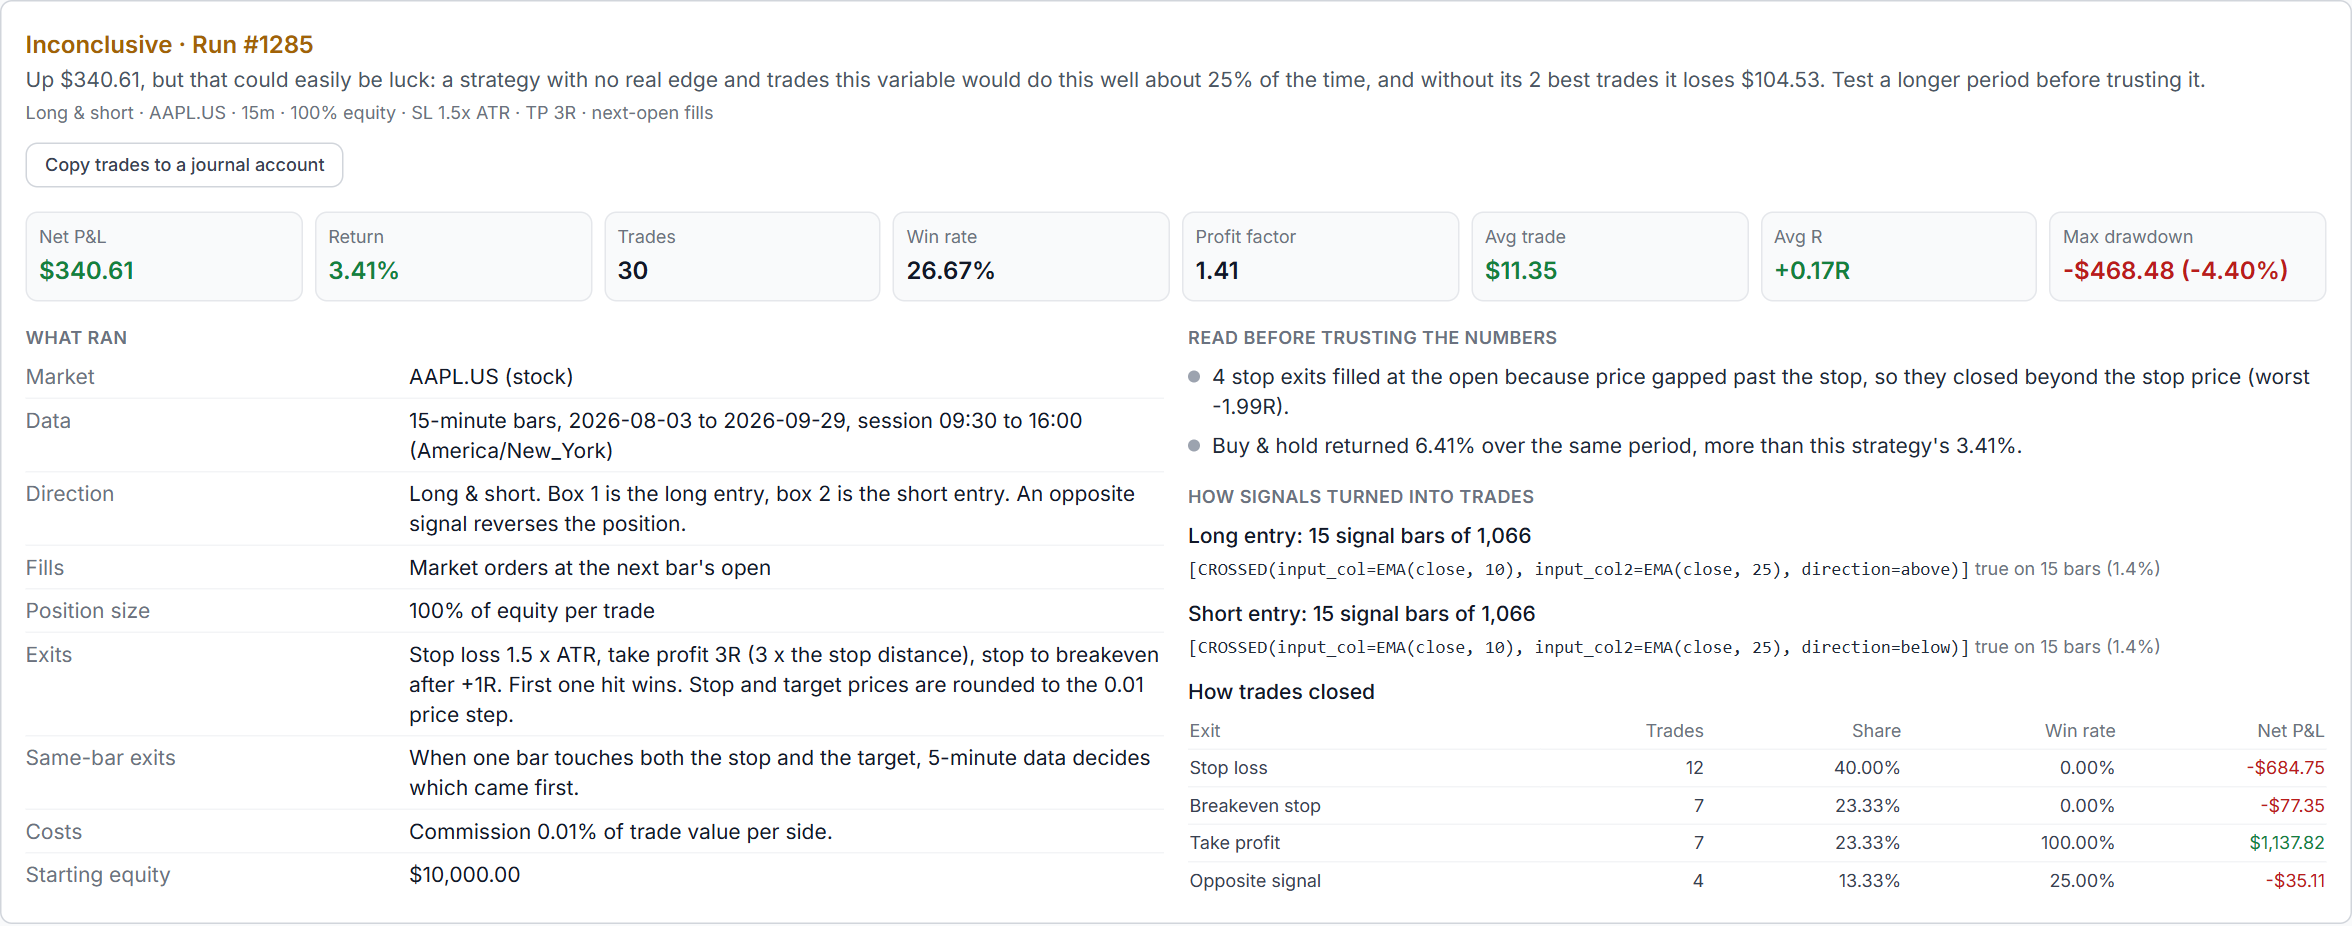
Below the readback are two sections most backtesters do not have:
- Read before trusting the numbers. Warnings written for this run: too few trades to judge, stops that filled beyond the stop price because of a gap, a trade still open at the end of the test, missing price data, buy and hold beating the strategy, no commission or slippage applied.
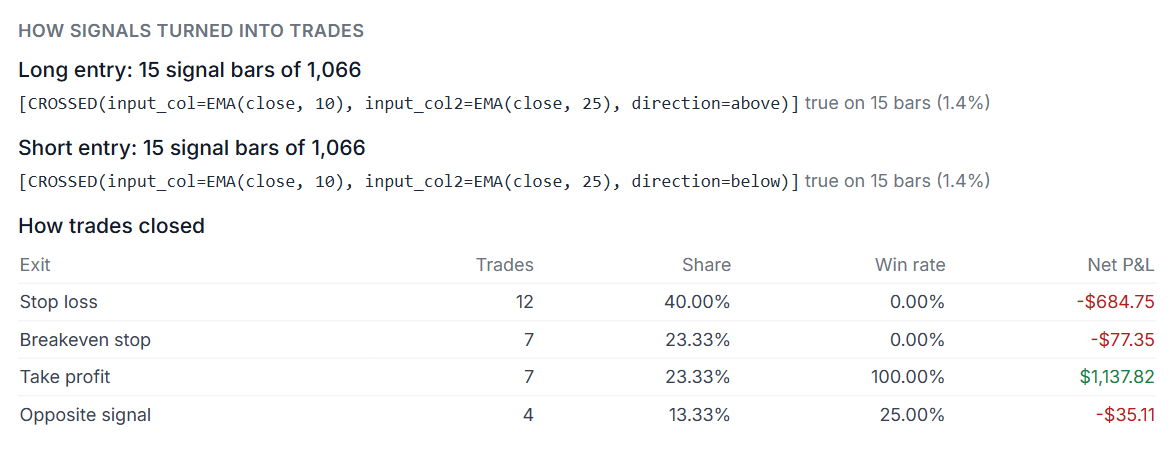
- How signals turned into trades. For each entry rule, how many bars each condition was true on, how many bars all of them were true together, and how many signals became trades and why the rest did not. When a strategy makes no trades, this is where you find the one condition that never fired.
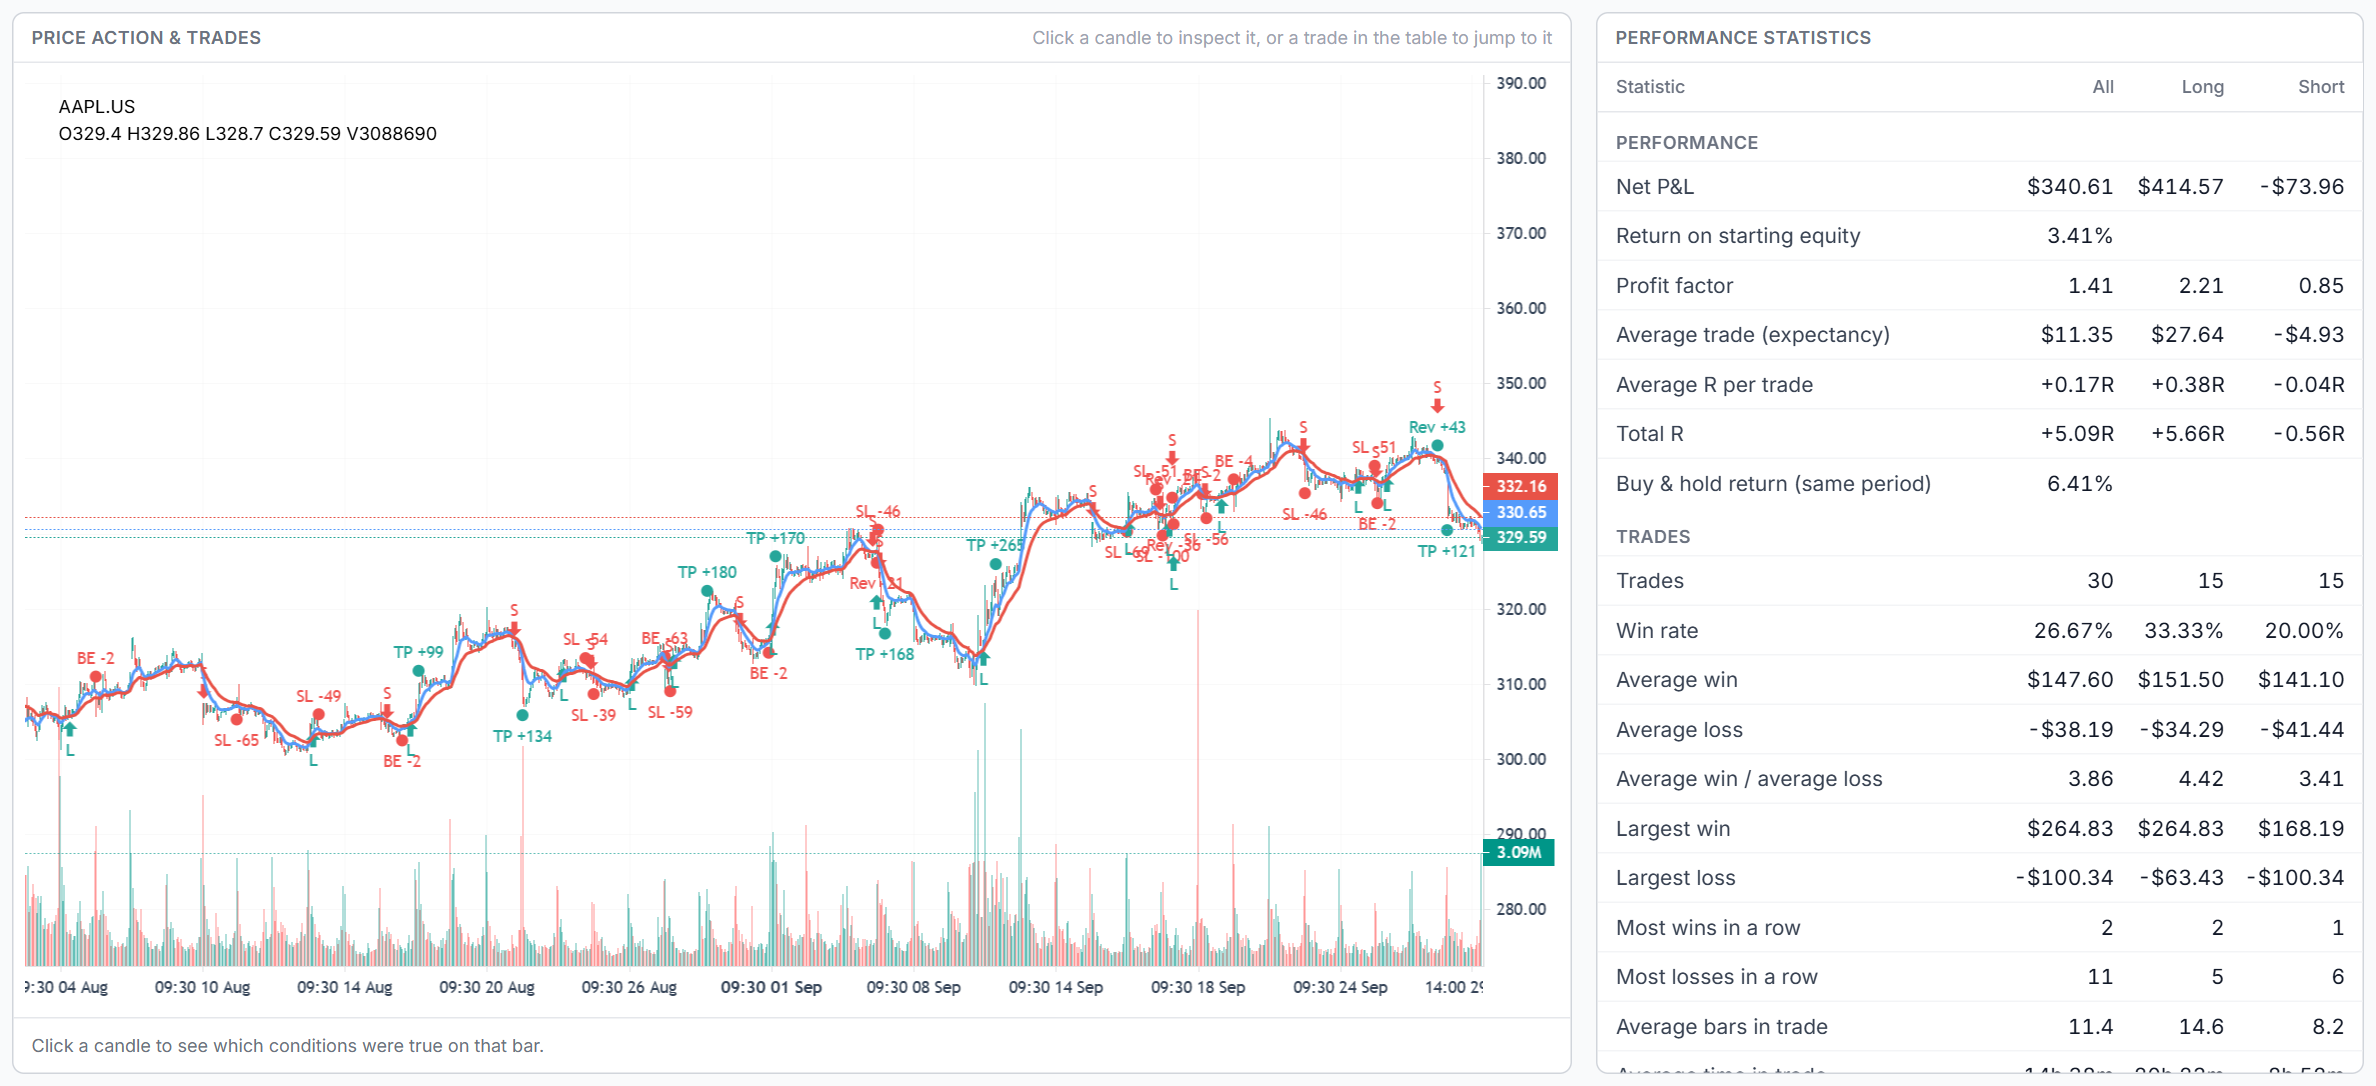
Then come the chart with every entry and exit marked, the full statistics table, the list of simulated trades and the equity curve. Click any trade in the table to jump the chart to it.
How to read backtest results
A backtest result is only as useful as your reading of it. Each number answers one question and quietly leaves others open.
| Metric | What it tells you | What it does not |
|---|---|---|
| Net P&L and return | What the rules made after costs in this window | Whether that will repeat, or how much was luck |
| Win rate | How often trades win | Whether the strategy makes money. A 30% win rate with 3R winners beats a 70% win rate with tiny wins and full losses |
| Profit factor | Gross profit divided by gross loss. Above 1 is profitable | Whether a few outliers produced it |
| Expectancy and average R | The average result per trade, in dollars and in units of risk | How uneven the individual trades are |
| Average win / average loss | How big wins are compared with losses | How often each happens |
| Max drawdown and longest drawdown | The deepest and longest fall from a peak, the pain you would have sat through | The worst drawdown still to come |
| Sharpe and Sortino ratio | Return per unit of daily volatility (Sortino counts only downside volatility) | Much, on a short test. A few weeks of daily returns makes them noisy |
| MAE and MFE | How far trades went against you and in your favor while open | Where the ideal exit was in advance |
| Buy and hold return | What simply holding the symbol made over the same window | The risk you avoided by being out of the market |
| Time in the market | The share of bars with a position open | Whether that exposure was well timed |
Every row in the statistics table is shown for All trades and, in long and short tests, for Long and Short separately. Annualized return and the Calmar ratio only appear on tests of six months or longer, because turning a few weeks into a yearly figure produces numbers nobody earned. For a deeper dive into the core metrics, see R-value and profit factor explained.
Is it an edge or is it luck?
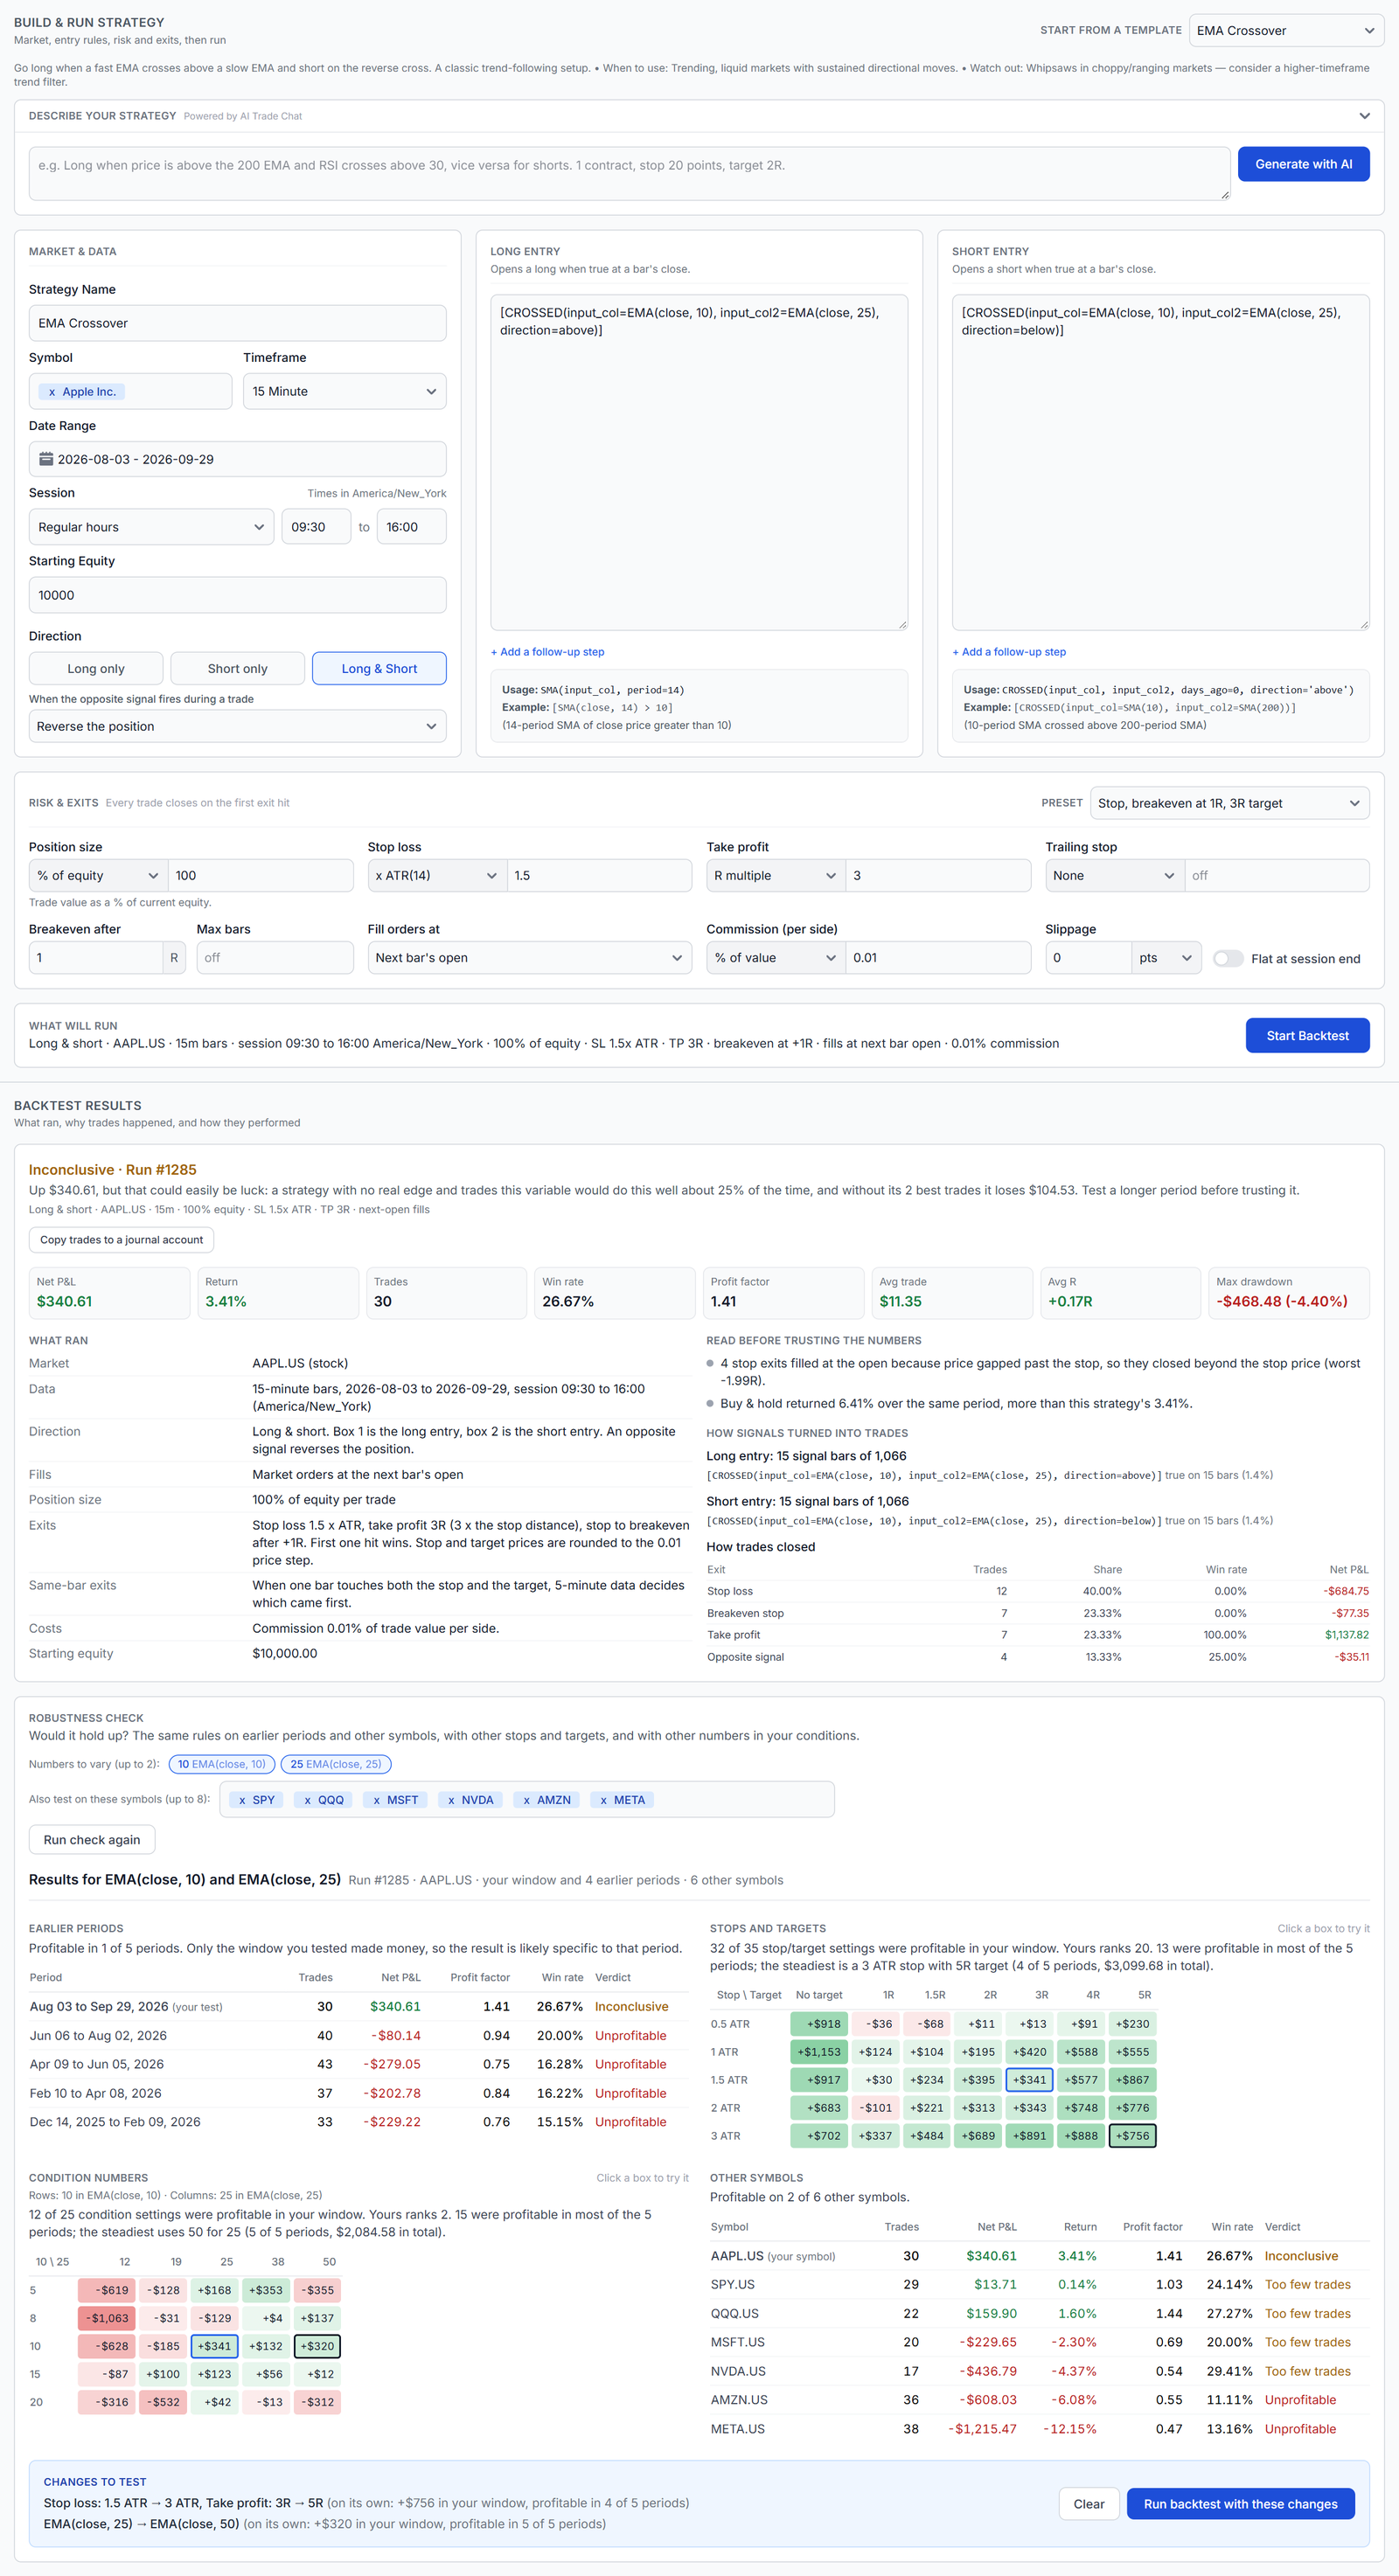
Here is a real backtest. AAPL on 15-minute bars from August 3 to September 29, 2026, a 10/25 EMA crossover traded long and short with stop and reverse, 100% of equity per trade, a stop at 1.5 times ATR, a 3R target, the stop moved to breakeven at 1R, and 0.01% commission per side.
- Net P&L: +$340.61 (3.41%)
- 30 trades, 26.67% win rate, profit factor 1.41
- Average R: +0.17R per trade
- Max drawdown: -$468.48 (-4.40%)
A profit factor of 1.41 over 30 trades looks like a working strategy. The verdict disagrees:
Inconclusive. Up $340.61, but that could easily be luck: a strategy with no real edge and trades this variable would do this well about 25% of the time, and without its 2 best trades it loses $104.53.
That is the luck check, and it runs on every backtest. It looks at two things:
- The chance a no-edge strategy does this well. A statistical test (a one-sided t-test on per-trade returns) asks how often trades with no real edge, but the same spread of wins and losses as yours, would average at least this much. An average of +0.17R means little when individual trades swing from -1R to +3R. Here the answer is about one time in four.
- The result without the 2 best trades. If removing two trades turns a profit into a loss, the strategy is two lucky trades, not an edge.
The verdict combines these with the trade count and profit factor:
| Verdict | When |
|---|---|
| Too few trades | Fewer than 30 trades, too few to tell skill from luck |
| Unprofitable | The strategy lost money in this window |
| Inconclusive | Profitable, but a no-edge strategy would do as well 5% of the time or more, or the profit disappears without the 2 best trades |
| Thin edge | Profitable and unlikely to be luck, but with a profit factor below 1.2, so small changes in costs could erase it |
| Promising | Profitable, profit factor of 1.2 or more, unlikely to be luck, and still profitable without its best trades |
Even "Promising" ends with check it on other periods before trusting it, which is exactly what the robustness check does. Both luck figures also appear at the bottom of the statistics table.
Why most backtests look better than live trading
The gap between a backtest and live results usually comes from a handful of simplifications. Here is how the Backtester v2 engine handles each one.
- Look-ahead bias. Conditions are evaluated on a bar's close, and by default the order fills at the next bar's open. A rule can never trade at a price it only learned about after the fact.
- Stops that never gap. A stop loss is a stop-market order. If the next bar opens beyond your stop, the trade exits at that open, not at the stop price, exactly as it would in a live account. Those trades are labelled gap open in the trade list, and the report tells you how many there were and the worst R they cost.
- Stop and target on the same bar. When one bar touches both, a bar alone cannot say which came first. The backtester looks inside the bar using finer data, for example 5-minute bars under a 15-minute test. When even that cannot separate them, it assumes the stop was hit first, never the target, and counts how often that happened.
- Impossible prices. Stop, target and trailing levels are rounded to the instrument's price step, such as $0.01 for stocks or 0.25 points for E-mini futures, because no exchange accepts an order at 307.8134.
- Trailing stops that see the future. Trailing and breakeven stops move only at a bar's close and apply from the next bar, so a bar's high can never move a stop that the same bar's low then hits.
- Free trading. Commission and slippage are applied to every fill, and the report warns when both are zero.
- Futures in points. P&L uses each contract's point value, so one NQ makes ten times what one MNQ makes on the same move. Futures margin is not modelled, and the report says so.
- Cold indicators. Extra history is loaded before the start date so every indicator is ready on day one.
Why did a trade happen here, or not happen there?
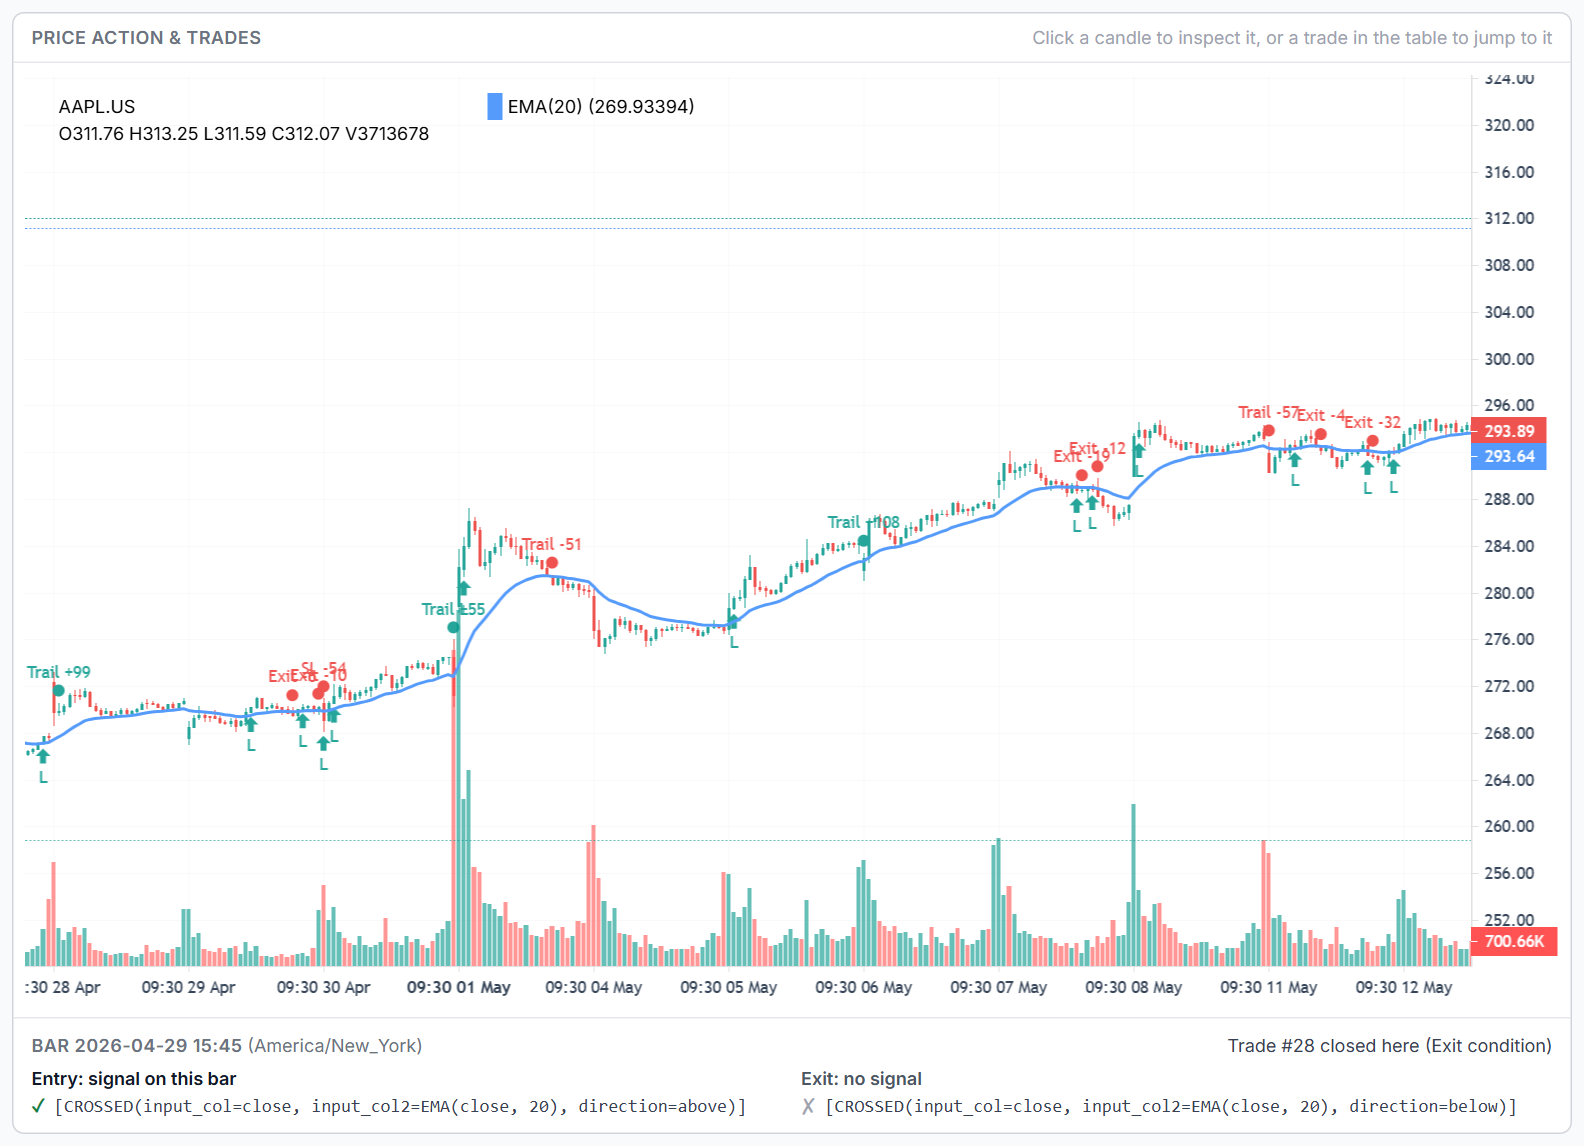
Click any candle on the chart and the bar inspector shows what the backtester saw on that bar: each condition marked true or false, whether each step of a multi-step setup completed there, whether a trade entered, and if a signal fired but was not taken, why (already in a trade, not enough equity, the stop could not be placed). It answers the most common backtesting question, "why didn't it buy here?", without guesswork.
The robustness check: would it hold up?
A backtest on one symbol over one window is a single sample. The most common way to fool yourself is to test one window, tweak settings until it looks good, and stop there. That is overfitting, or curve fitting: the settings end up describing the noise in that window rather than an edge.
The Robustness check card under every run report tests the same strategy four more ways with one button. Choose up to two numbers in your conditions to vary and up to eight other symbols (it suggests some), then press Run robustness check. A bold header above the results always says which numbers were varied and how many periods and symbols were tested, and it flags the results as out of date if you change those settings afterwards.

Earlier periods: out-of-sample testing
The same rules and settings run on up to four earlier windows of the same length, each from fresh equity. This is the simplest form of out-of-sample testing: windows you did not use to build or tune the strategy.
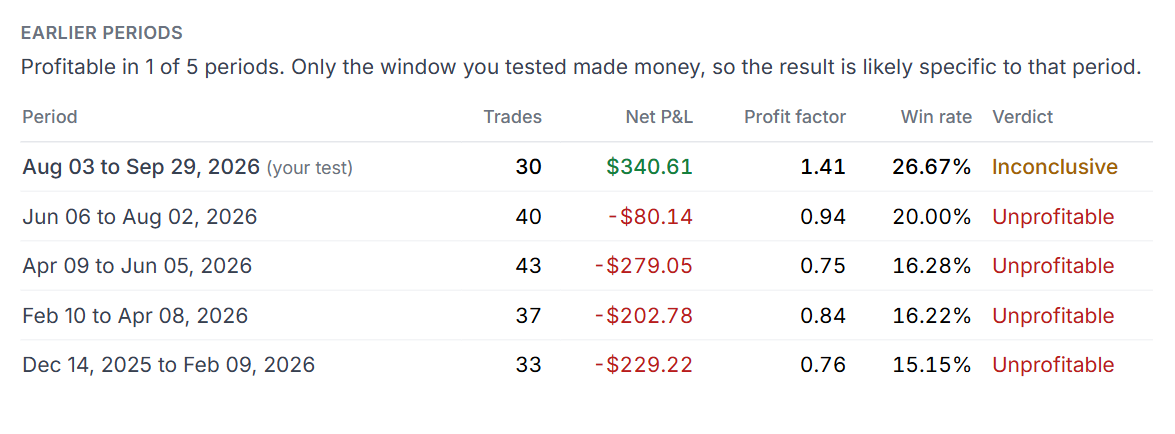
For the EMA crossover above, the answer was blunt: profitable in 1 of 5 periods. Only the window you tested made money, so the result is likely specific to that period. The four earlier windows all lost.
Other symbols
The same rules, window and settings on other symbols you choose, each with its own contract size, price step, time zone and data. Results show net P&L and return percent side by side, because dollar P&L is not comparable across instruments of different prices. A strategy that only works on the one symbol it was built on is a much weaker idea than one that holds up on similar markets.
Stops and targets
A heatmap re-runs your exact entries with a grid of stop losses (rows) against take profits (columns) around your own values, green for profit and red for loss, with your setting outlined. If your run has no stop at all, the grid shows what adding one would do.
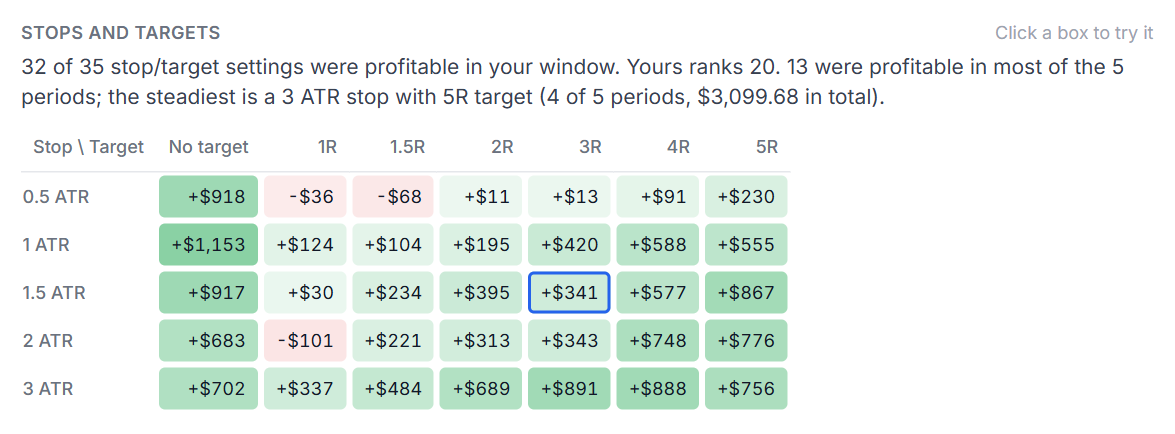
The important part is underneath. Every cell is also run on the earlier periods, and the summary names the setting that was profitable in the most periods, not just the one that made the most in your window. The best cell of a single window is usually the most overfit one; a setting that holds up across periods is not. For the EMA crossover, 32 of 35 stop and target combinations were profitable in the tested window, but only 13 were profitable in most of the five periods, and the steadiest of them, a 3 ATR stop with a 5R target, was profitable in 4 of 5.
When no exit setting works across periods, the check says so directly: the entries are the problem, not the exits. That single sentence saves hours of tuning stops on a strategy whose entries have no edge.
Condition numbers: parameter optimization without overfitting
The same idea applied to the numbers inside your rules. Pick up to two, such as the 10 and 25 in an EMA crossover, and the check tries each at half, three quarters, one, one and a half and two times its value, a 5 by 5 grid. Every occurrence of a number changes together, so a mirrored long and short rule stays in sync, and changing 10 never touches 1050.
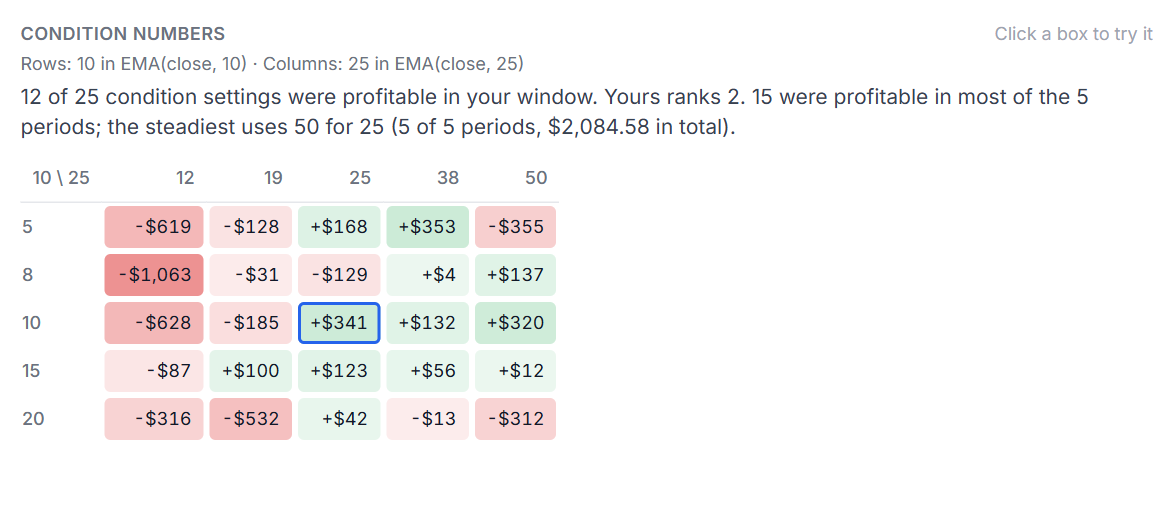
For the EMA crossover, a slower 50 EMA in place of the 25 was profitable in all 5 periods. That is a lead worth testing, not a conclusion: with 25 settings tried, some will look good by chance, which is exactly why the next step is to test it on symbols that were not used to pick it.
Try a change in one click
Click any box in either heatmap and it is added to a Changes to test list at the bottom of the card, showing each change from and to (EMA(close, 25) → EMA(close, 50)) with that box's result. Nothing touches your form until you press Run backtest with these changes, which applies them and starts the backtest. Clear empties the list.

A complete example: from idea to a tested strategy
Putting it all together with a second strategy: a 20 EMA pullback on AAPL, long only, entering when price crosses back above the 20 EMA and exiting when it crosses below, with the Trend follower preset (a stop at 2 times ATR and a trailing stop at 3 times ATR), 100% of equity per trade and 0.01% commission, on 15-minute bars from April 1 to May 31, 2026.
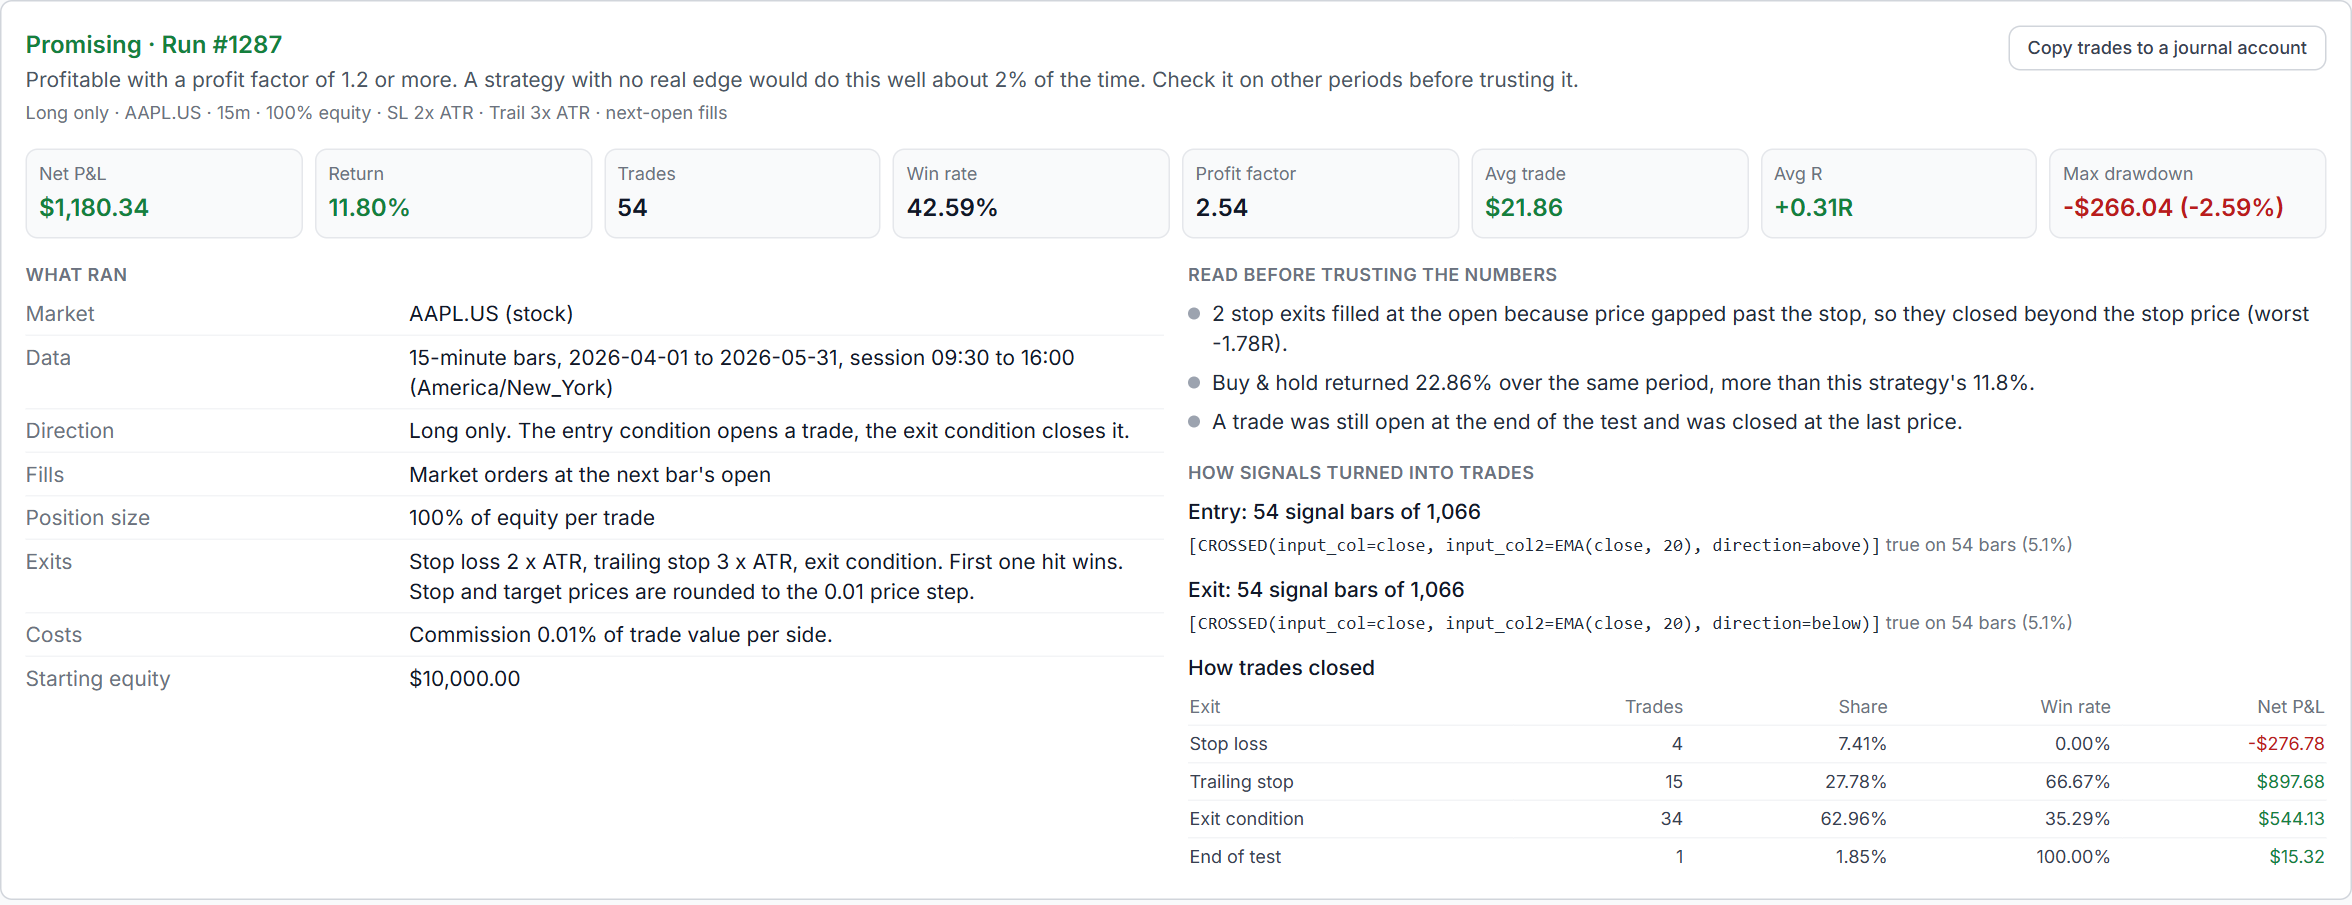
- The run: +$1,180.34 (11.80%) over 54 trades, a 42.59% win rate, profit factor 2.54 and a max drawdown of -2.59%. Verdict: Promising, with a no-edge strategy doing this well only about 2% of the time.
- The warnings: buy and hold returned 22.86% over the same window, more than the strategy's 11.80%. A long-only strategy that is in the market only part of the time will often trail a strong rally. Whether that trade-off is worth it depends on the drawdowns you avoid, so it is worth knowing before you decide.
- Earlier periods: profitable in 3 of 5. Two earlier windows lost money, so this is not a strategy for every market condition.
- Other symbols: profitable on 5 of 6. SPY +3.71%, QQQ +7.84%, MSFT +6.19%, NVDA +2.33% and AMZN +20.86%, while META lost 9.17%.
- Stops and targets: all 25 combinations were profitable in the tested window, and the setting that held up best across periods was the one already in use.
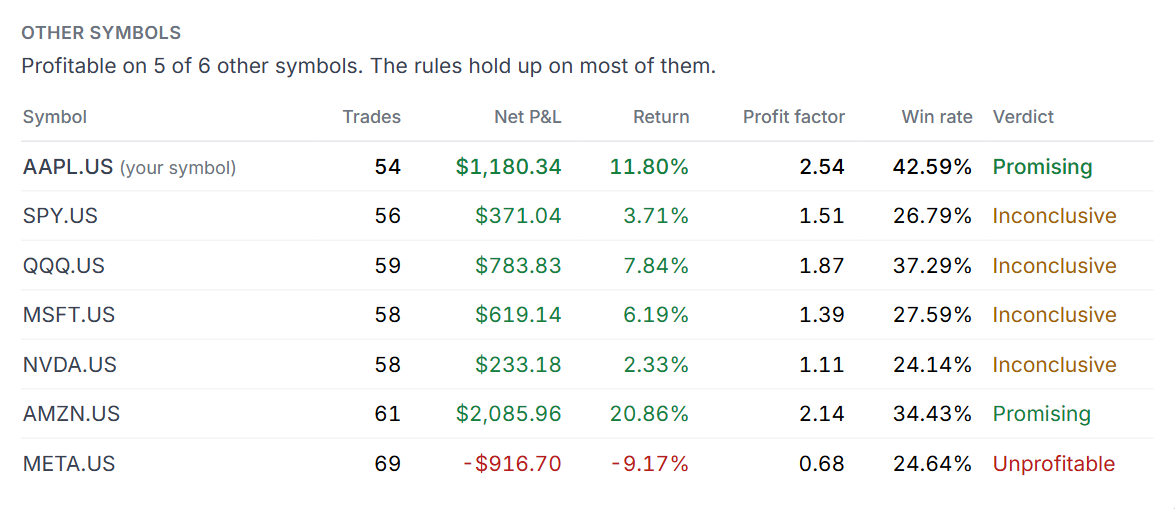
Compare that with the EMA crossover: one window profitable, four not, and an Inconclusive verdict. Neither run proves the future. But the second one survived every check that could have killed it, and the first one did not survive any, which is the difference a backtest is supposed to reveal.
From backtest to trading journal
A backtest is a hypothesis. Your trading journal is where it meets reality.
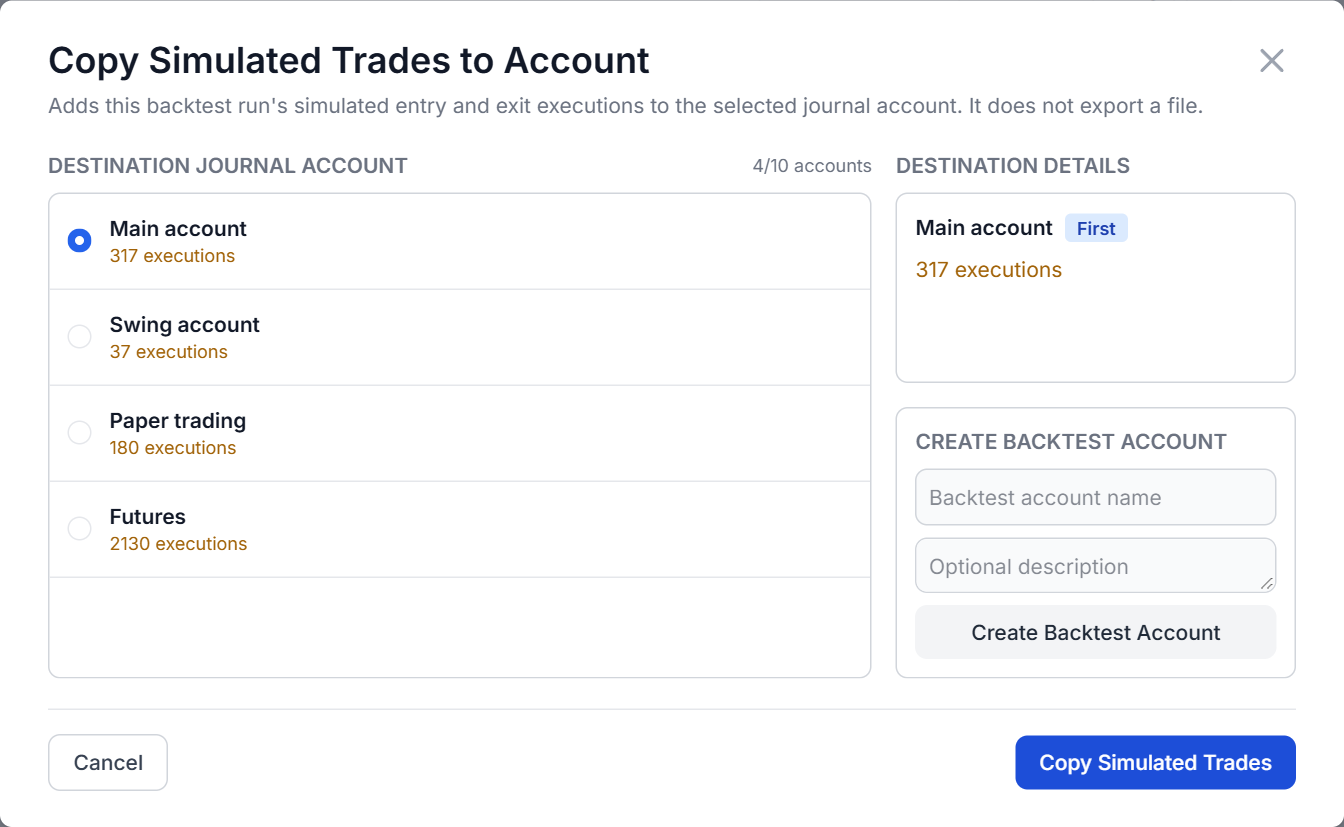
- Copy trades to a journal account. Add a run's simulated entries and exits to a journal account of your choice, so you can analyze them with the same 600+ stats, charts and reports you use for your real trades, and compare the strategy side by side with how you actually trade it.
- Run notes. Write down what you learned from each run, saved with the run.
- Strategy Lab. Recent runs are kept with their full settings, so you can rerun any of them later on new data.
If you prefer to backtest by hand, bar by bar, the trade replay simulator and the other TradesViz trading simulators let you practice a strategy manually on historical data, and the stop loss and profit target simulator replays your own journal trades with different exits. For options strategies, see the options strategy backtester, and for candlestick setups, the candlestick pattern backtesting guide.
Share backtest results as a public strategy test
A useful shared backtest lets someone inspect what was tested, how orders were filled and what the result leaves uncertain. Backtester v2 turns a completed run into a report with a shareable link. You choose what to include, and the report keeps its historical simulation label, tested market and dates visible.
Choose who can see the report
Open Saved Runs at the top of the Backtester and select Share in the run's sharing column. There is also a Share button beside the current results. After publishing, use the sharing settings in the same row or Manage sharing beside the results to make changes.
- Private: the report is not available to other readers.
- Link only: anyone with the link can read it, without a listing in the public library.
- Public: the report also appears in the strategy test library, where visitors can browse and search without signing in. The Strategy tests tab sits alongside shared Trades and Days.
Decide what to include, then copy the link
For a new share, all available options under Choose what to include start checked. Select or clear a whole card to include performance and verdict, strategy rules, execution settings, the equity curve, simulated trades, saved robustness results, run notes, your public display name, and Allow "Test your version". Saved choices are preserved when you reopen settings. Robustness results and testing another version require both strategy rules and execution settings to be shared.
Public commentary starts with an editable description built from the saved run: its symbol, timeframe, dates, rule expressions and indicators, parameters, execution settings and results when available and included. This uses the saved data, not AI. You can edit the text or use Generate from run to rebuild it. The generated text follows your selected sections; review any commentary you write yourself before publishing.
Press Save sharing settings. The share link, copy button and Facebook and X share buttons appear in a separate section at the top of the modal, so they stay accessible while you review the settings. View published report opens exactly what readers can see.
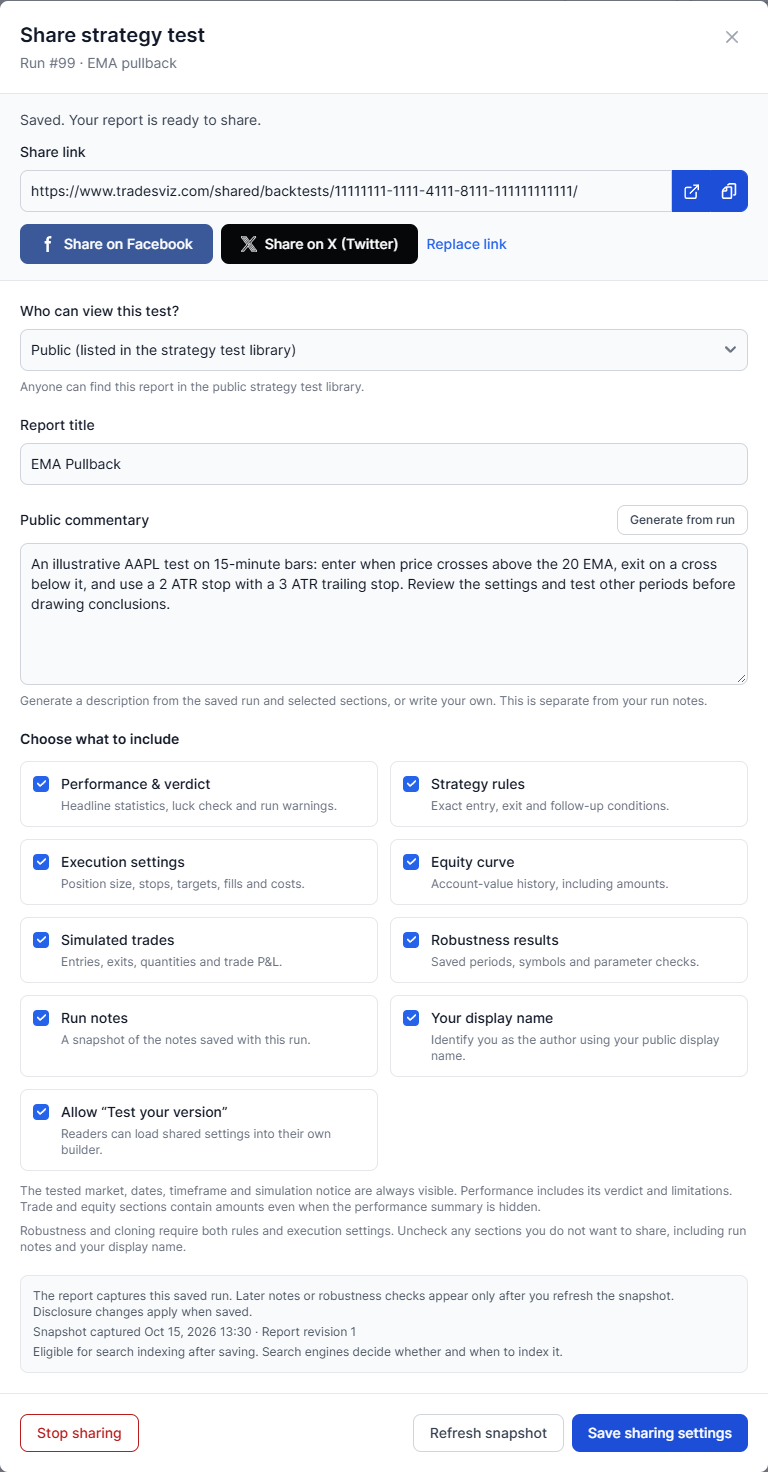
Example sharing settings for a sample simulation. Choose the audience and included sections before sharing the link.
Read the report and test your version
The public page shows the selected sections from the saved snapshot, including its capture date and report revision. Where included, readers can inspect the verdict and warnings, All/Long/Short statistics, rule expressions, risk and execution settings, equity and drawdown, and completed robustness checks. Hiding one section lets the remaining content use the available space.
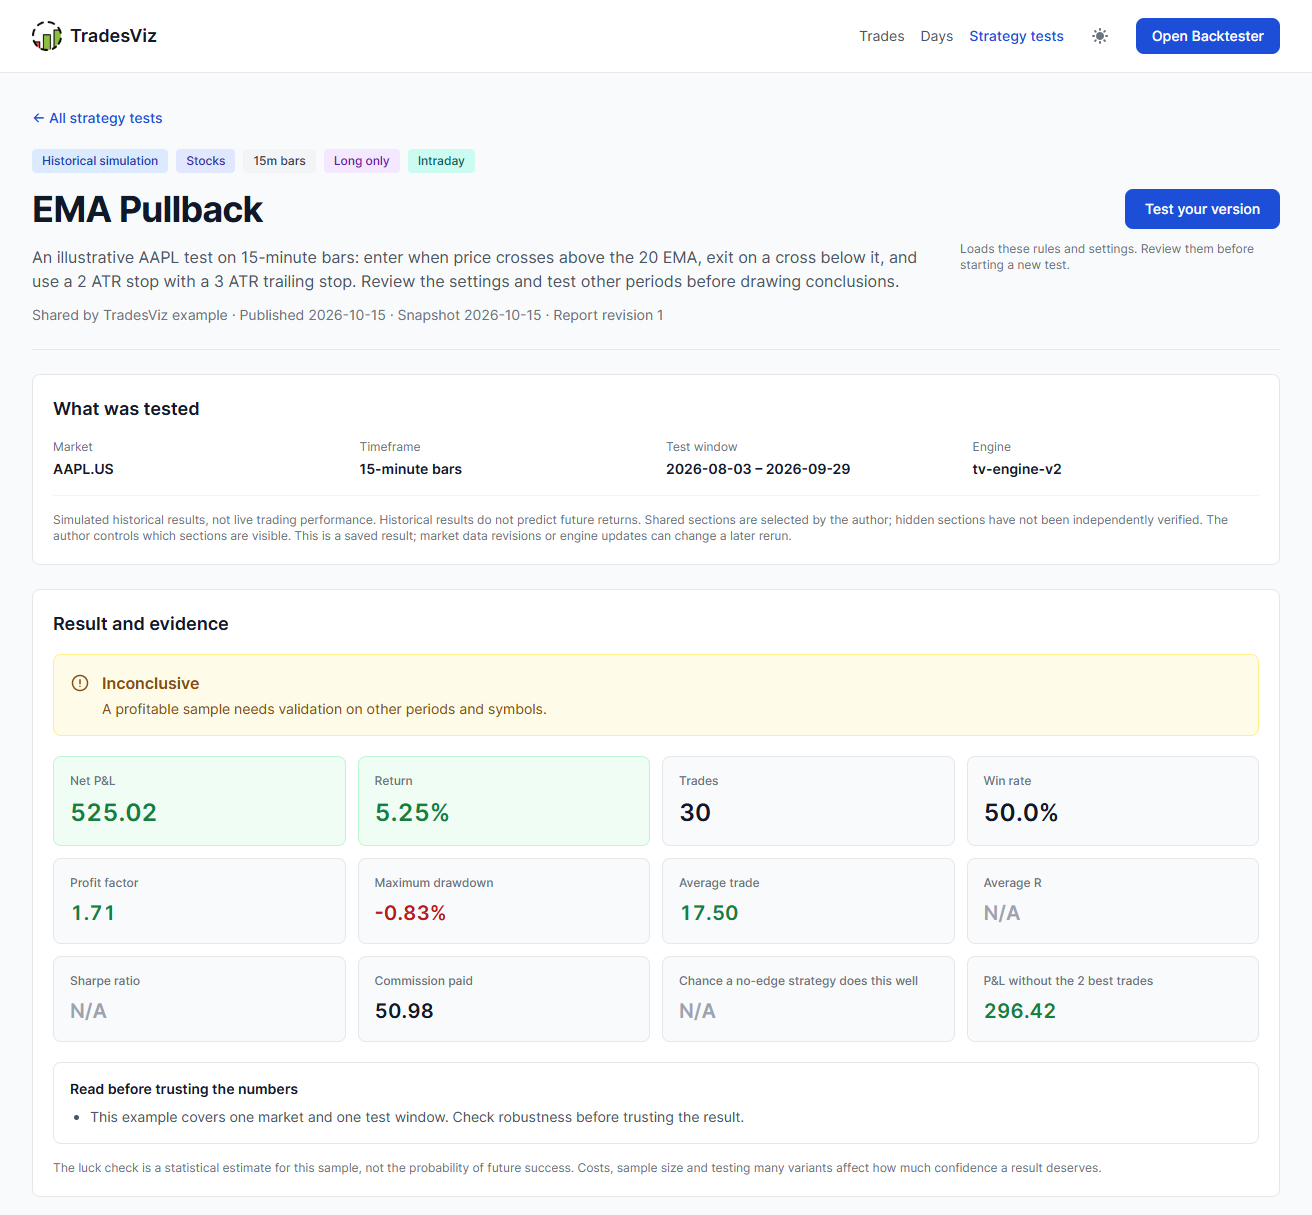
A sample public strategy test. These are simulated results, not a record of live trading or a prediction of future performance.
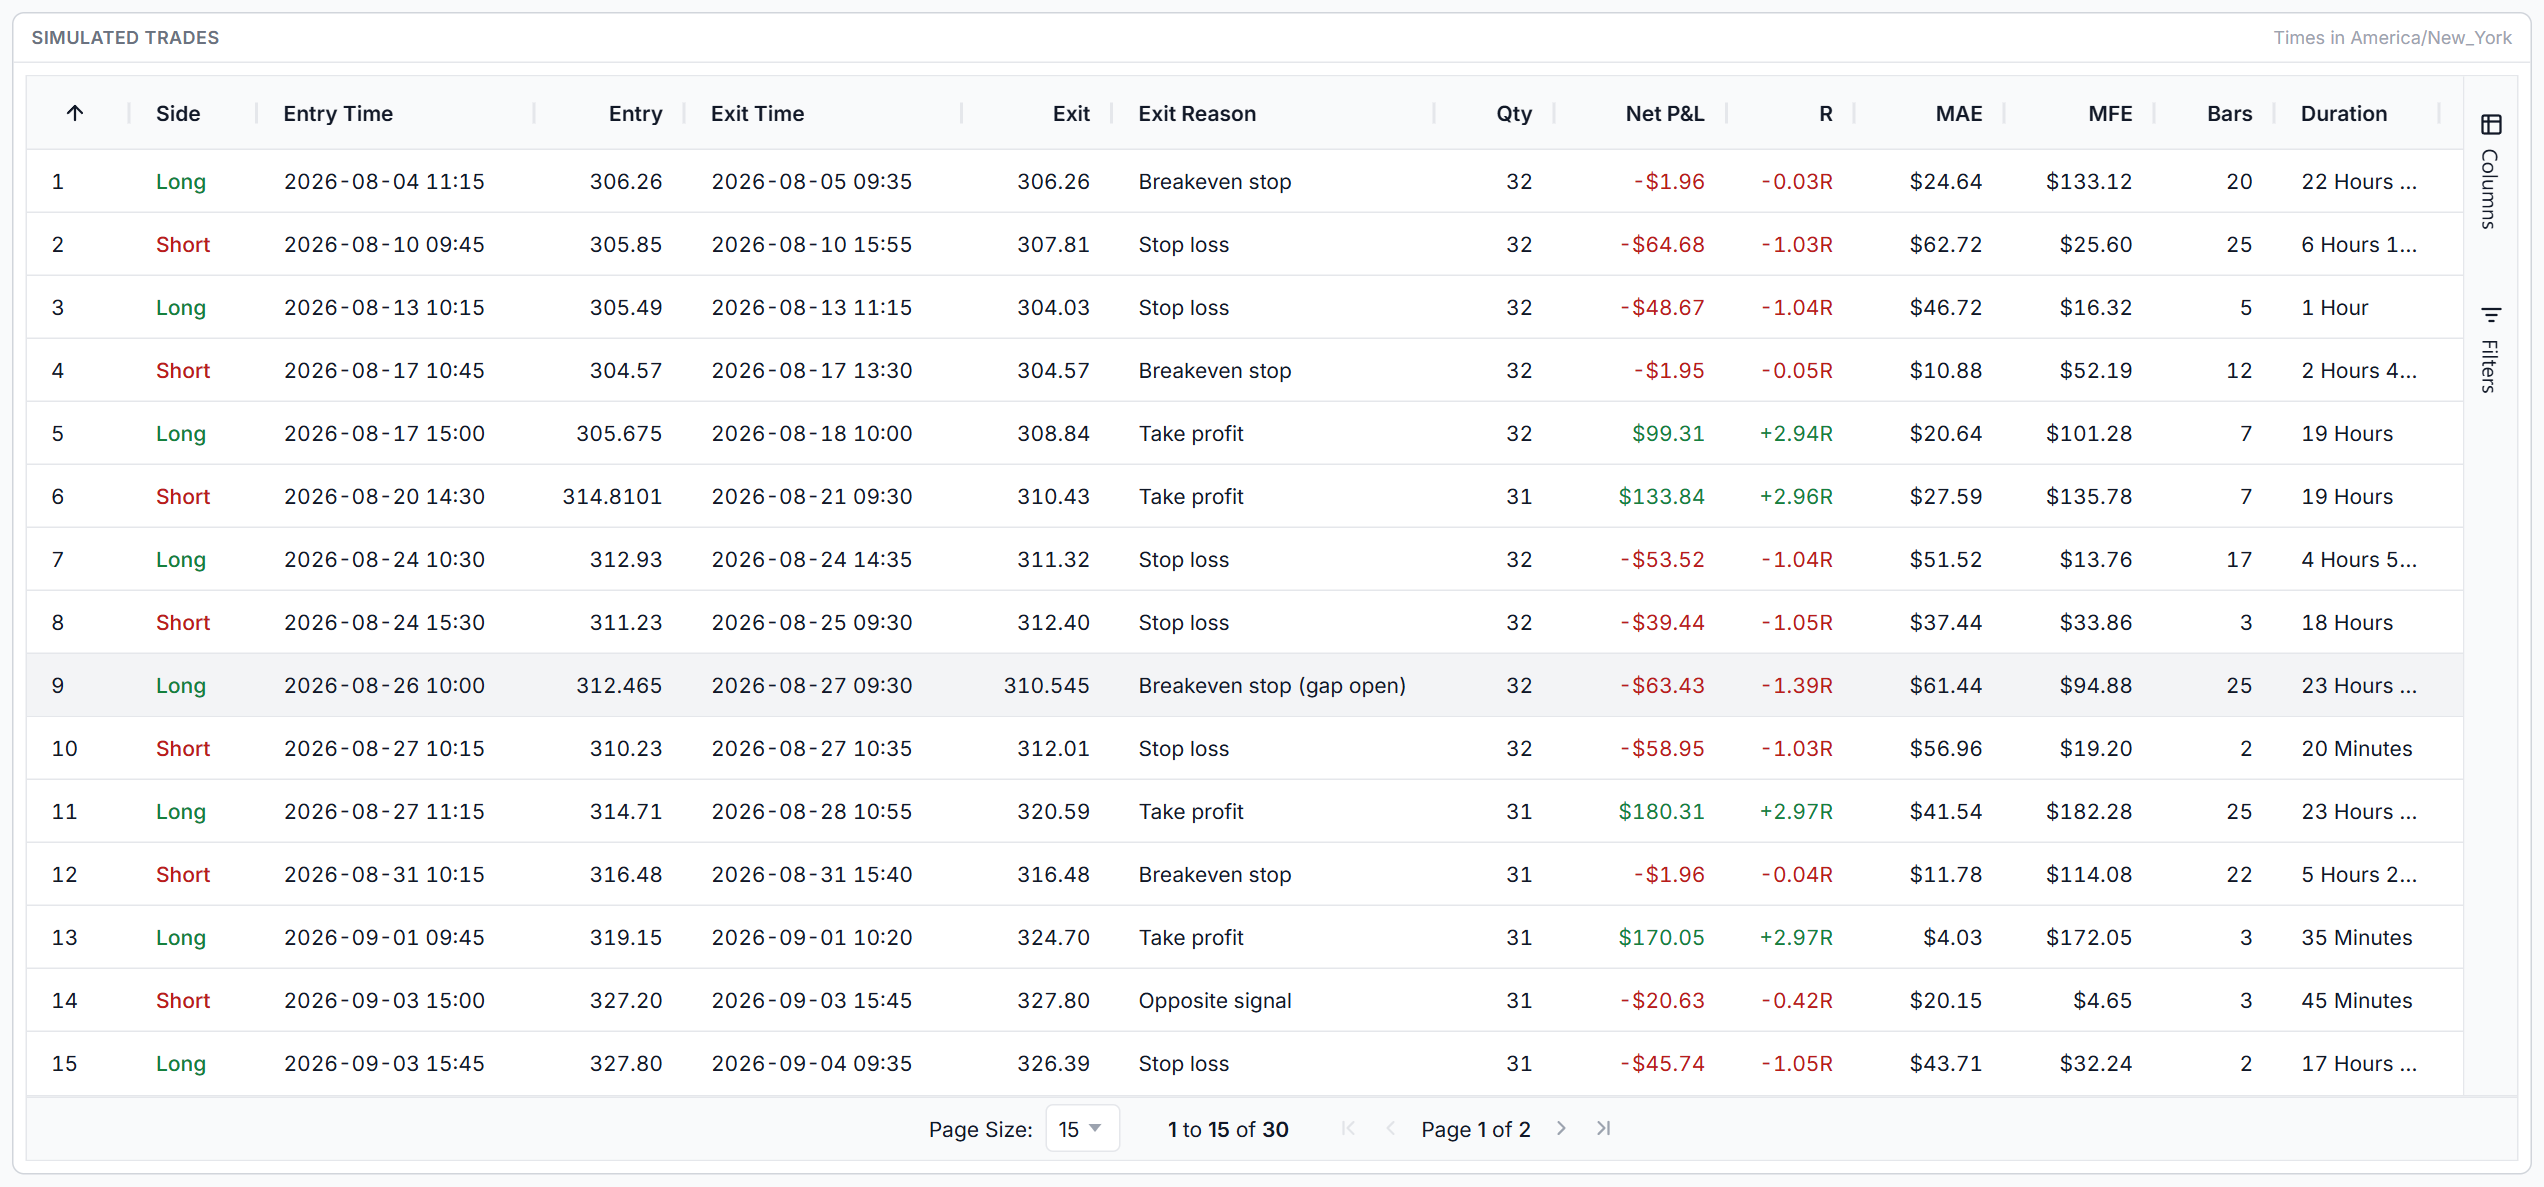
The Simulated trades table supports sortable columns, column filters, search and pagination, making it easier to inspect entries, exits and outcomes instead of relying on headline numbers alone.
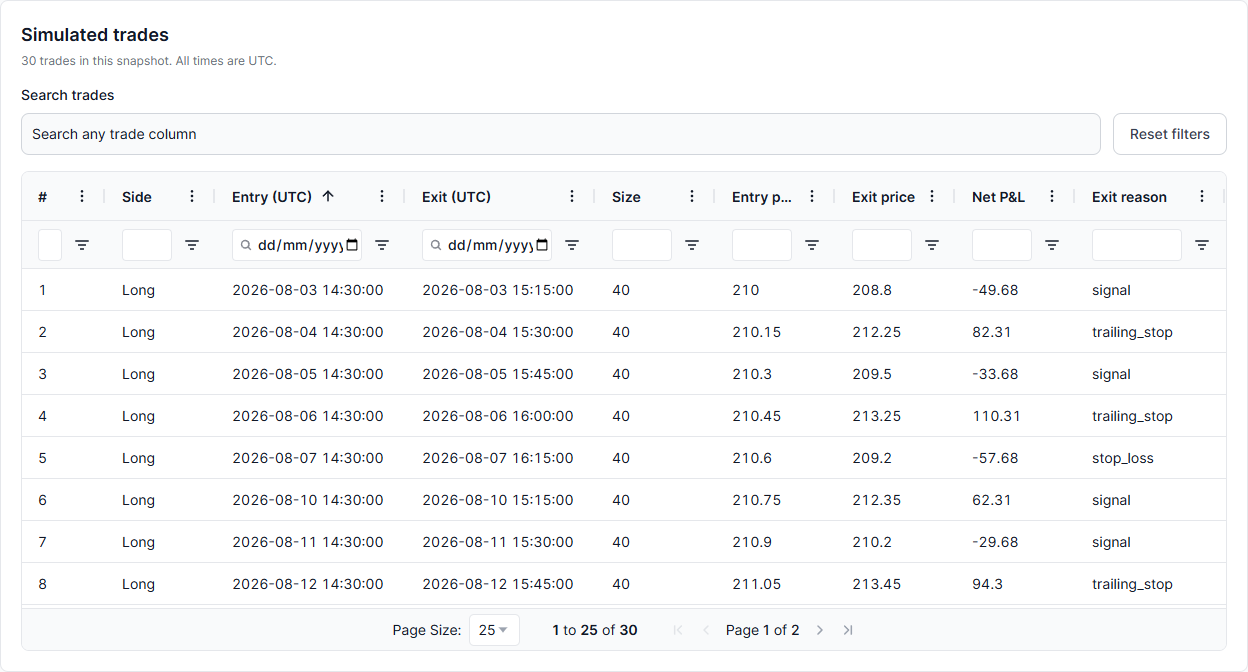
Example trades from a sample simulation, shown in the public report's sortable and filterable table.
If the author enables it, Test your version loads the shared rules and settings into your Backtester. It does not start a backtest. Sign in, review the inputs, change the symbol, dates or parameters as needed, then start your own test. Running it requires the usual Backtester plan access.
Manage a shared report later
Sharing captures a snapshot of the saved run. Later notes or robustness checks appear only after you choose Refresh snapshot; saved changes to visibility, commentary and included sections apply without rerunning the strategy. Use Replace link to issue a new URL and invalidate the old one, or Stop sharing to make the report unavailable. Publishing again after stopping creates a new link.
Browse public strategy tests to see what other traders have chosen to share, or open your saved runs to share one of your own.
Backtesting mistakes to avoid
- Trusting too few trades. Under about 30 trades, almost any result can be luck. Test a longer period or a faster timeframe.
- Judging by win rate. Win rate without the size of wins and losses tells you nothing about profitability. Look at profit factor and average R.
- Ignoring costs. Commission and slippage turn many marginal strategies into losers, especially on fast timeframes. Always add them.
- Tuning until it works. Every setting you adjust to improve one window makes that window less trustworthy. Use the robustness grids, which score settings across periods, and prefer settings whose neighbors also work.
- Testing one window. A strategy that only made money in the period you tested is the most common result in backtesting. Check earlier periods.
- Testing one symbol. Check whether the edge holds on similar markets that played no part in building it.
- Ignoring drawdown. A strategy you abandon halfway through its worst drawdown makes nothing. Look at the depth and length of drawdowns, and size so you could live through them.
- Using rules you cannot actually trade. Fills at prices you could not have known, stops that never gap, sizes your account could not afford. The engine guards against these, but your rules should reflect how you would really trade.
Current limitations
So you know exactly what you are testing:
- Each backtest runs on one symbol and one timeframe. Other symbols are tested through the robustness check, and conditions on a second timeframe are not supported yet.
- Indicators are calculated by the TradesViz indicator engine, so values can differ slightly from another charting platform's. Exponential moving averages in particular are calculated over a fixed window of recent bars rather than the full price history.
- Saved runs can be rerun on new data. A shared snapshot can be read without rerunning the test, but it does not include the full historical price chart or bar inspector.
Backtesting FAQ
How do I backtest a trading strategy?
Write the strategy as fixed rules: when to enter, when to exit, how much to risk and what it costs to trade. Run those rules on historical data for your market and timeframe, after costs. Then check whether the result is more than luck: enough trades, a profit that does not depend on a couple of outliers, and results that hold up on earlier periods, other symbols and nearby settings. In TradesViz you choose a symbol and timeframe, write the entry and exit conditions (or describe the strategy and use Generate with AI), set the stop loss, take profit and position size, press Start Backtest, and then run the robustness check.
Can I backtest a strategy without coding?
Yes. Conditions are short expressions such as [RSI(14) < 30] rather than a programming language, five ready-made templates cover common strategies, and Generate with AI turns a plain-English description into rules, steps and risk settings that are checked before they are applied.
Can I backtest intraday, futures, forex and crypto strategies?
Yes. Timeframes range from 1-minute to daily bars, and the backtester covers stocks and ETFs, futures (with dollar P&L from each contract's point value), forex, crypto and indices. Sessions are set in the exchange's own time zone, including overnight futures sessions.
How many trades does a backtest need?
At least 30 before a result says much, and more is better. Below 30, TradesViz labels the result "Too few trades". Even with more, a profit that a no-edge strategy would match a large share of the time is labelled Inconclusive.
What is a good profit factor in a backtest?
Above 1 means the strategy made money. Below about 1.2, small increases in commission or slippage can erase the edge, so TradesViz calls it a thin edge. A high profit factor from few trades, or one that collapses without the best two trades, is not evidence of an edge by itself.
How do I avoid overfitting a trading strategy?
Test on periods and symbols you did not use to build the strategy, prefer settings that work across a range of nearby values rather than one perfect value, keep the number of rules small, and judge settings across periods instead of within the single window you tuned them on. The TradesViz robustness check does all of this from one button.
Does the backtester include commissions and slippage?
Yes. Commission can be a percent of trade value or a fixed amount per share or contract, per side, and slippage can be set in points or ticks per fill. Stop losses also fill at the open when price gaps through them, the most common source of hidden slippage.
Is the TradesViz backtester free?
The backtester is included in the TradesViz Platinum plan. Reading the public strategy test library and shared reports does not require an account. Running your own version requires signing in and the usual Backtester plan access. You can sign up for TradesViz to get started.
How do I share my backtest results?
Choose Share from Saved Runs or beside the current results, select Link only or Public, choose which sections to include, and save the sharing settings. Copy the report link or use its social share buttons. You can return to the sharing settings to change included sections, refresh the snapshot, replace the link or stop sharing.
Where can I see public strategy tests?
Visit the TradesViz strategy test library, or select Strategy tests beside the shared Trades and Days tabs. You can browse and read public reports without signing in. Each report shows only the sections its author chose to share.
Does Test your version automatically run a shared strategy?
No. When the author allows it, Test your version loads the shared rules and settings into your Backtester for review and editing. You must sign in and have the usual Backtester plan access to run a test yourself. A historical result is not a guarantee that another test or live trading will perform the same way.
Start backtesting
A good backtest does not end with a profit number. It ends with an answer to whether you should trust it. Build your rules, run them with realistic fills and costs, read the luck check, and let the robustness check try to break your strategy before the market does.
Open the TradesViz Backtester or sign up for TradesViz to start backtesting your trading strategies, then journal the results alongside your real trades. To explore shared examples first, browse public strategy tests without signing in.