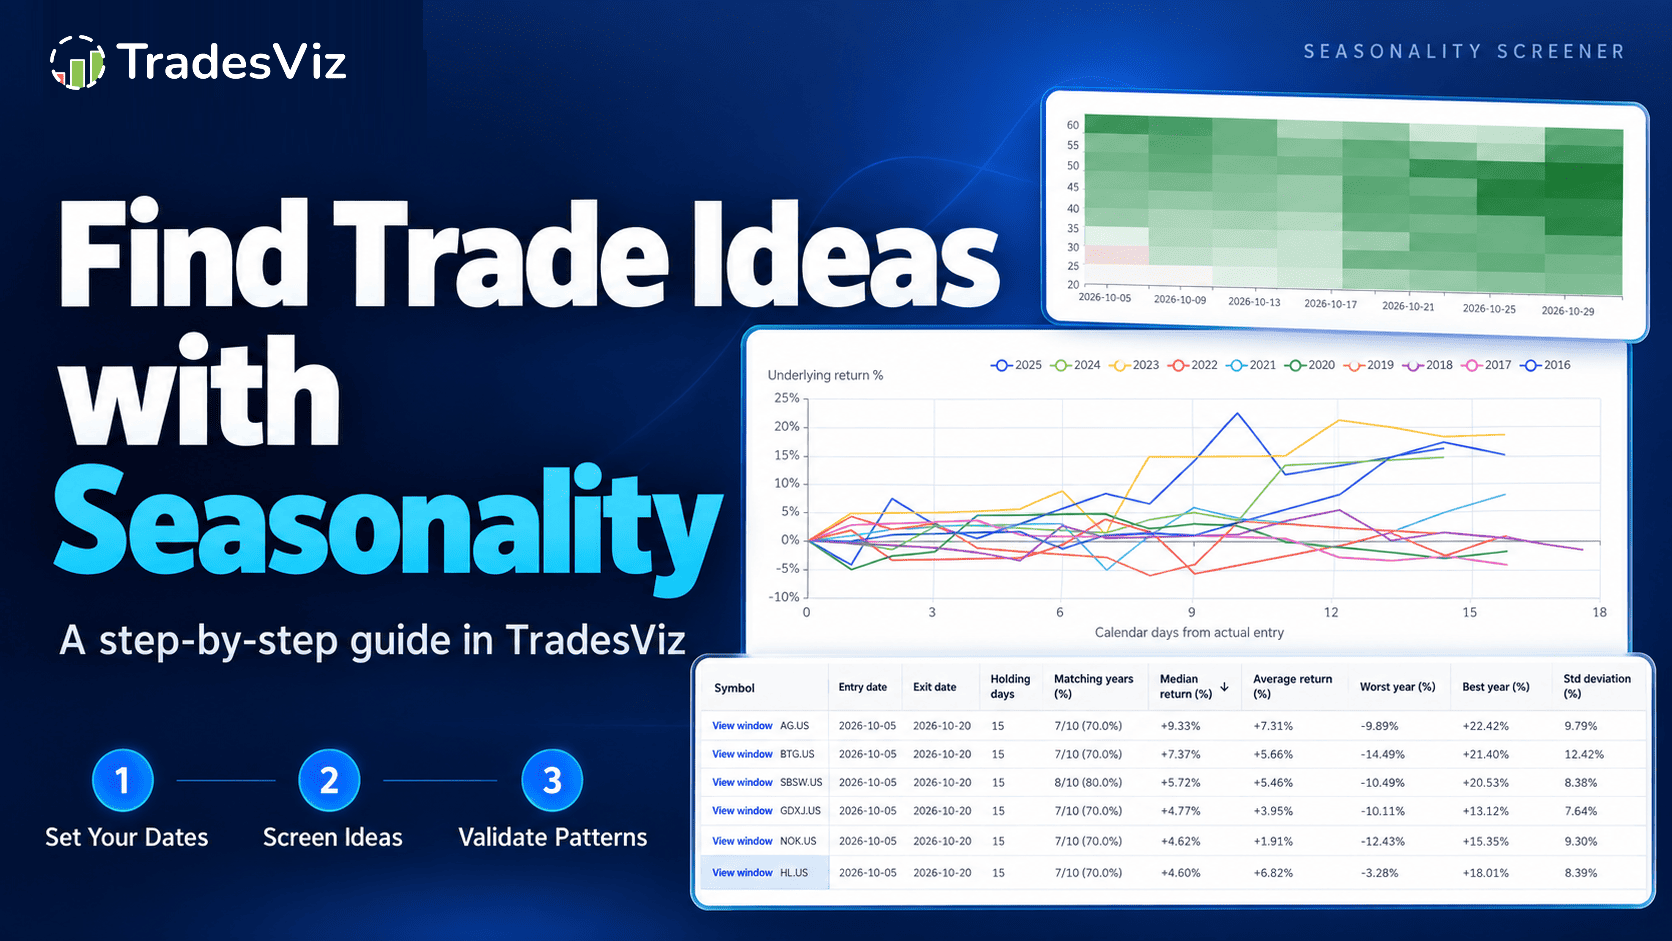
Most seasonality charts answer a question you rarely trade: how did this stock do in October?
You do not buy on October 1 and sell on October 31 because the calendar turned. You enter when your setup triggers, maybe next Monday, and you hold for two weeks or six. The move you care about starts mid-month and often ends in the next one.
So we rebuilt the seasonality suite around that. The headline is a new tab called Upcoming Windows, which screens symbols over the exact dates you plan to hold. Around it we rebuilt the calendar Screener, added options-activity filters, and spent most of our time on the part seasonality tools usually skip: checking whether a pattern deserves your trust.
Seasonality has been part of TradesViz since 2022. The current suite combines that calendar analysis with exact holding windows, options-activity filters and your trading journal.
The scan examples below were run on September 30, 2026, with prices through September 29. The separate Returns example was captured on October 2. We kept the ugly results in, because they teach more than the pretty ones. To follow along, open Seasonality and select Upcoming Windows. For every individual control, see the seasonality walkthrough.
1. Start with your dates, not the month
Before looking at any leaderboard, write down your question. A trader who wants to enter next week and hold for two weeks is asking something different from one who can enter any time this month and hold for up to two months. The seasonality page now has a view for each.
| Your question | Where to start | What you get back |
|---|---|---|
| Which symbols have tended to rise in a particular month, quarter or week? | Screener | A calendar-period shortlist |
| How have symbols behaved from my planned entry date over my planned hold? | Upcoming Windows: Fixed window | One window, compared across symbols and years |
| Within the dates I have, which entry and holding period had the strongest history? | Upcoming Windows: Find historical windows | A selected entry date, exit date and holding period per symbol |
| What does the wider year look like for a symbol I already follow? | Returns and Heatmap | Context around the window you are researching |
| How did a particular stock perform between two exact dates? | Returns: Seasonal window | A draggable date selection, summary, yearly paths and annual results for the selected symbol |
2. Fixed window: screen the dates you plan to hold
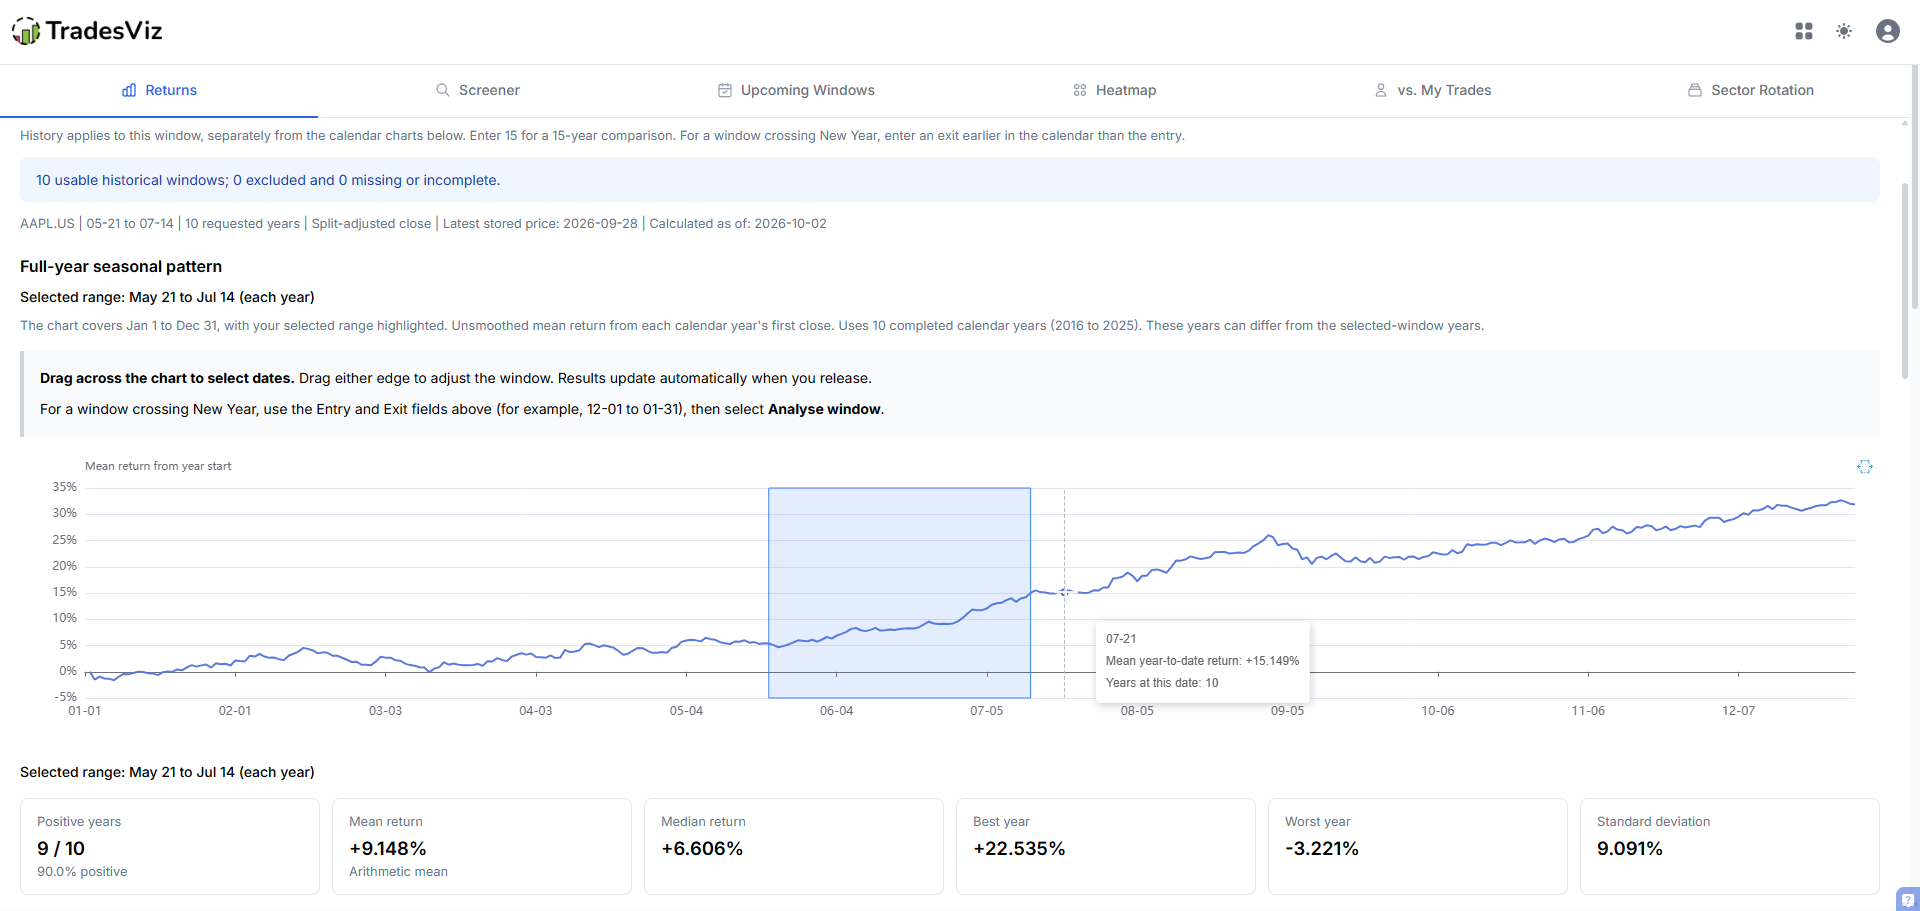
If you already have a stock in mind, inspect it directly in Returns. Select the symbol, enter the entry and exit month/day under Seasonal window, choose 1 to 20 history years, and select Analyse window. You can also drag the selection on the full-year chart; a spinner appears while the previous results stay in place. Below the yearly paths, the annual bars and grid show each completed outcome side by side. Grid filters change the bars, while Exclude years changes the underlying calculation. The Returns guide explains the tooltips and includes a CBOE date example. This direct analysis does not require the stock to qualify for a screener.
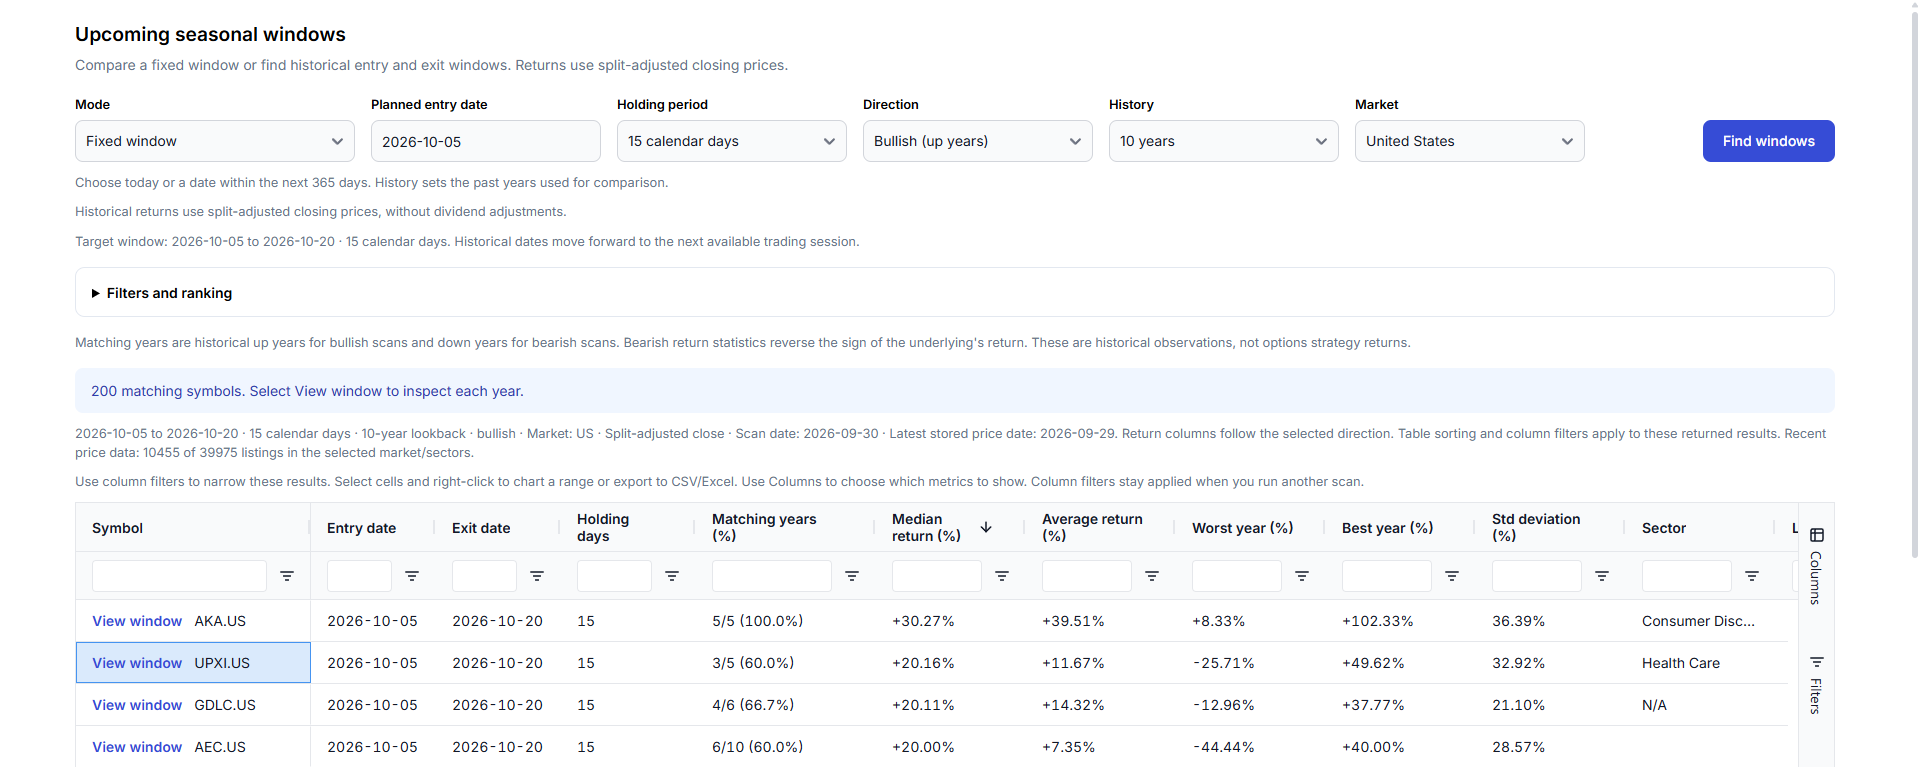
Open Upcoming Windows and leave Mode on Fixed window. You set:
- Planned entry date: today or any date in the next 365 days.
- Holding period: 15, 30, 45, 60 or 90 calendar days, or a custom 7 to 180.
- Direction: Bullish (up years) or Bearish (down years).
- History and Market: 5, 10 or 20 years, across the United States, India and Canada. Available history varies by symbol.
The Target window line under the controls confirms the exact start and end. Click Find windows and every symbol is measured over that same window in each past year: same month and day in, same number of calendar days held. One window, applied to thousands of symbols, so you are comparing like with like.
A real scan, straight out of the box
We set an entry of October 5, 2026, a 15-day hold ending October 20, Bullish, 10 years, United States, and left Filters and ranking on its defaults: at least 5 usable years, 60% matching years, a median of 0% or better, top 200 by median. The scan filled all 200 rows. Here is the top of the list:
| Symbol | Matching years | Median | Average | Worst year | Best year |
|---|---|---|---|---|---|
| AKA | 5/5 (100%) | +30.27% | +39.51% | +8.33% | +102.33% |
| UPXI | 3/5 (60%) | +20.16% | +11.67% | -25.71% | +49.62% |
| GDLC | 4/6 (66.7%) | +20.11% | +14.32% | -12.96% | +37.77% |
| AEC | 6/10 (60%) | +20.00% | +7.35% | -44.44% | +40.00% |
| BNKK | 3/5 (60%) | +18.84% | +3.10% | -35.45% | +23.23% |
A 20% to 30% median over 15 days sounds incredible, and it should make you suspicious. Four of these five have six years of history or fewer. The one with ten years, AEC, lost 44% in its worst year. BNKK's median is six times its average, which means the good years and the bad years are nowhere near each other.
This is what ranking by return tends to do to a loosely filtered universe: it floats short histories and extreme movers to the top. Nothing is wrong with the scan. The filters are the part you have to bring.
3. Matching years is a count, not a probability
The column most people read first is Matching years. AKA shows 5/5 (100%): all five usable windows went up. Three details here are deliberate:
- The denominator is the usable sample, not the lookback. We asked for 10 years. AKA has five, so it shows five. We never let a 5/5 look like a 10/10.
- A flat year is not a match. It did not move your way, so it does not count.
- Bearish flips the sign. In a bearish scan, a 4% fall shows as +4%. Returns always read as "how much did it move my way".
We never call this a win rate or a probability. Five years is five observations. It tells you what happened, not what will happen.
Frequency can also hide the size of the losses. Picture a window that gained 1% in nine years and lost 15% in the tenth. Matching years: 90%. Median: +1%. Average: -0.6%, because (9 × 1 - 15) / 10 = -0.6. So read the whole row together:
| Column | What it tells you |
|---|---|
| Matching years | How often the window moved your way. Always read the numerator and denominator. |
| Median return | The middle outcome. Harder for one huge year to distort. |
| Average return | Compare it with the median. A big gap means one or two years are doing the work. |
| Worst and best year | The range. Check whether rare losses outweigh frequent small gains. |
| Std deviation | How much the years disagree with each other. |
4. Open every result before you trust it
A median hides how you got there. So every row has a View window link. Here is AKA:
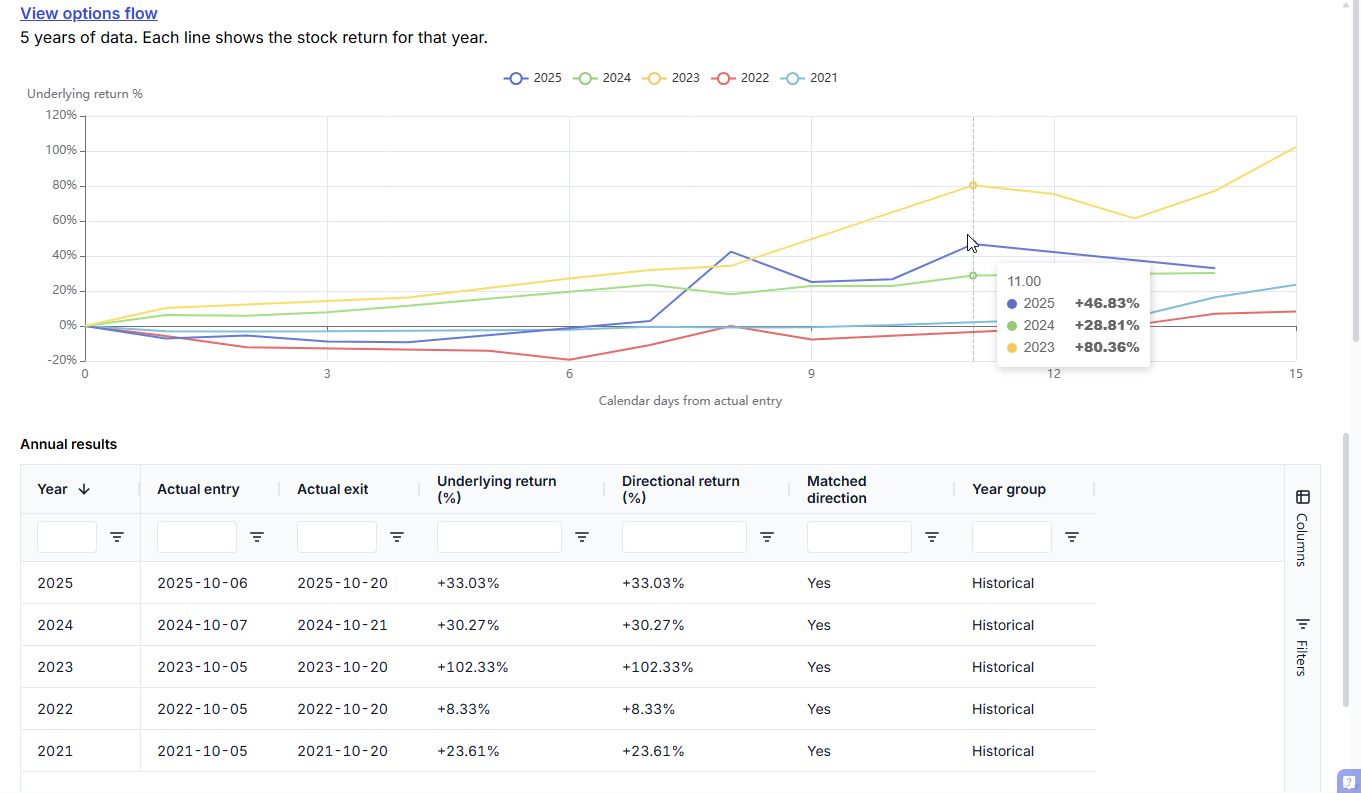
The chart draws one line per year, each starting at 0% on that year's actual entry date. The Annual results grid below it lists the real entry and exit sessions and each year's return:
| Year | Actual entry | Actual exit | Return |
|---|---|---|---|
| 2025 | 2025-10-06 | 2025-10-20 | +33.03% |
| 2024 | 2024-10-07 | 2024-10-21 | +30.27% |
| 2023 | 2023-10-05 | 2023-10-20 | +102.33% |
| 2022 | 2022-10-05 | 2022-10-20 | +8.33% |
| 2021 | 2021-10-05 | 2021-10-20 | +23.61% |
Two things jump out in about two seconds. First, 2023 returned +102%. Take it out and the average falls from +39.51% to +23.81%. Second, "every year was positive" hides the path: in 2022 the stock was down close to 20% six days in before it finished up 8%. Plenty of stop-losses would have triggered long before the ending that the grid calls a match.
Notice the dates too. October 5, 2024 was a Saturday, so that year's entry moved to Monday, October 7, and the exit to October 21. Every year uses the next available trading session, and the grid shows you exactly which one.
You can sort and filter that grid, export it to CSV or Excel, or select cells and right-click Chart Range. Keep the export with your scan settings if you want to revisit the idea later.
5. Tighten the filters before you look at results
Open Filters and ranking. You can pick sectors, set a latest price range, and filter on recent liquidity: average daily volume and average daily traded value over up to 20 recent sessions. Recent matters. A stock that traded well five years ago is not necessarily one you can get in and out of today.
Then set your historical bar. We reran the same October 5, 15-day window with three changes: Minimum years of data 8, Min matching years 70%, and Min avg options volume 5,000 contracts a day. The list went from a full 200 rows to 61 symbols.
These are screening choices, not validated trading rules. Write them down before you run the scan so you can tell your original idea apart from later tinkering.
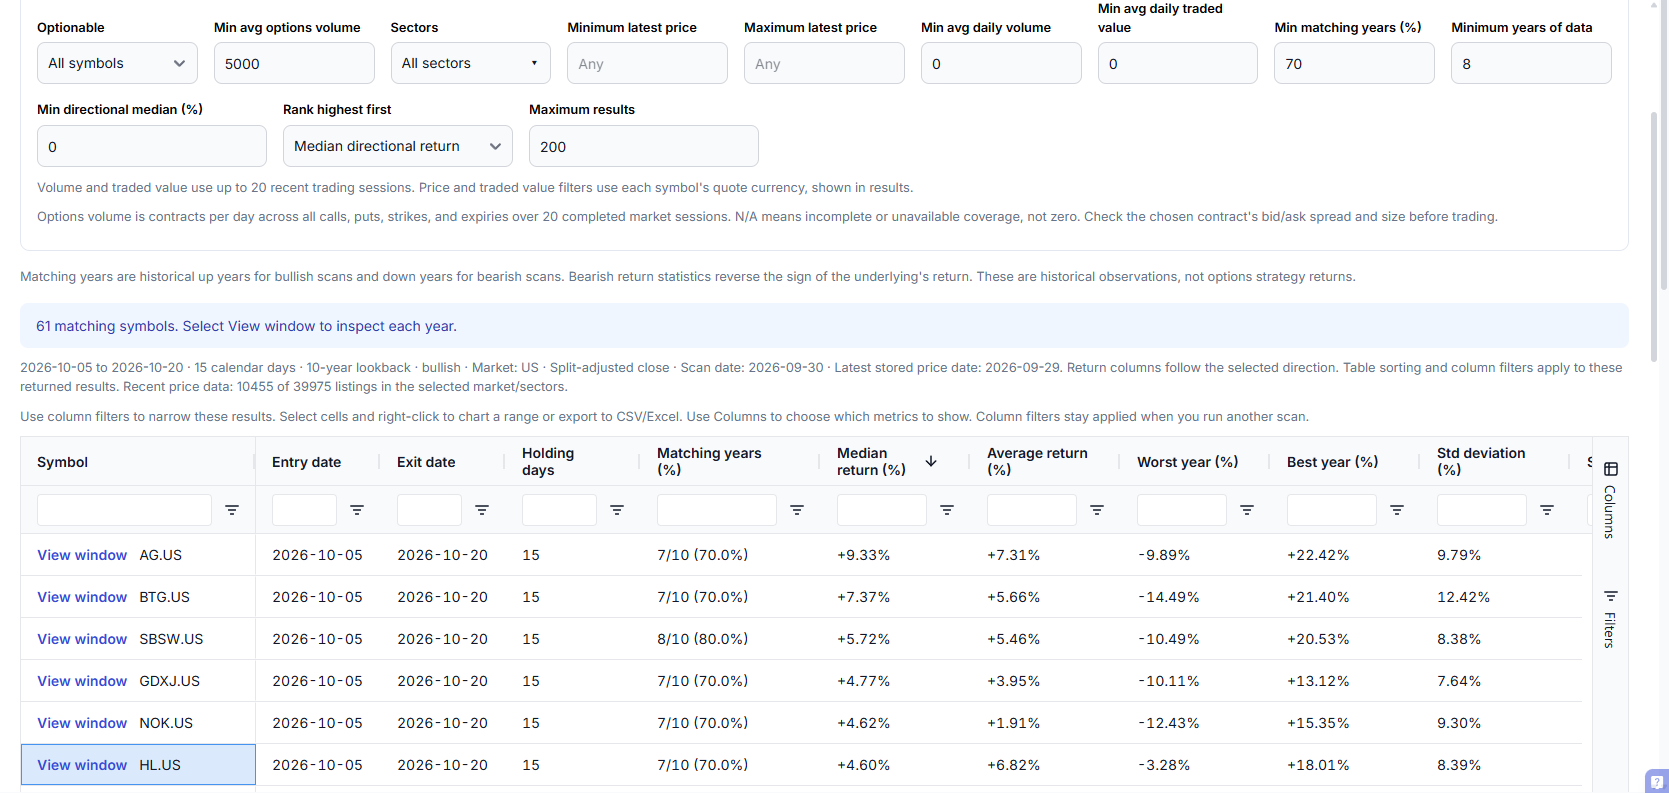
| Symbol | Matching years | Median | Average | Worst year | Best year | Std deviation |
|---|---|---|---|---|---|---|
| AG | 7/10 (70%) | +9.33% | +7.31% | -9.89% | +22.42% | 9.79% |
| BTG | 7/10 (70%) | +7.37% | +5.66% | -14.49% | +21.40% | 12.42% |
| SBSW | 8/10 (80%) | +5.72% | +5.46% | -10.49% | +20.53% | 8.38% |
| GDXJ | 7/10 (70%) | +4.77% | +3.95% | -10.11% | +13.12% | 7.64% |
| NOK | 7/10 (70%) | +4.62% | +1.91% | -12.43% | +15.35% | 9.30% |
| HL | 7/10 (70%) | +4.60% | +6.82% | -3.28% | +18.01% | 8.39% |
The medians dropped from 20% to 30% down to 5% to 9%, which is a lot closer to what a two-week move in a liquid stock looks like. Every row now stands on ten years.
Look at the names, though. AG, BTG, SBSW, HL and the GDXJ junior gold miners ETF are all precious-metals miners. That is not five independent ideas. It is one idea, "precious metals miners in early October", showing up five times. If you shortlist all five, you have one position in five tickers.
Look at the averages as well. NOK's median is +4.62% but its average is only +1.91%, because a -12.43% year drags it down. HL is the opposite: the shallowest worst year on the list at -3.28%, and an average above its median. That makes HL the one worth opening.
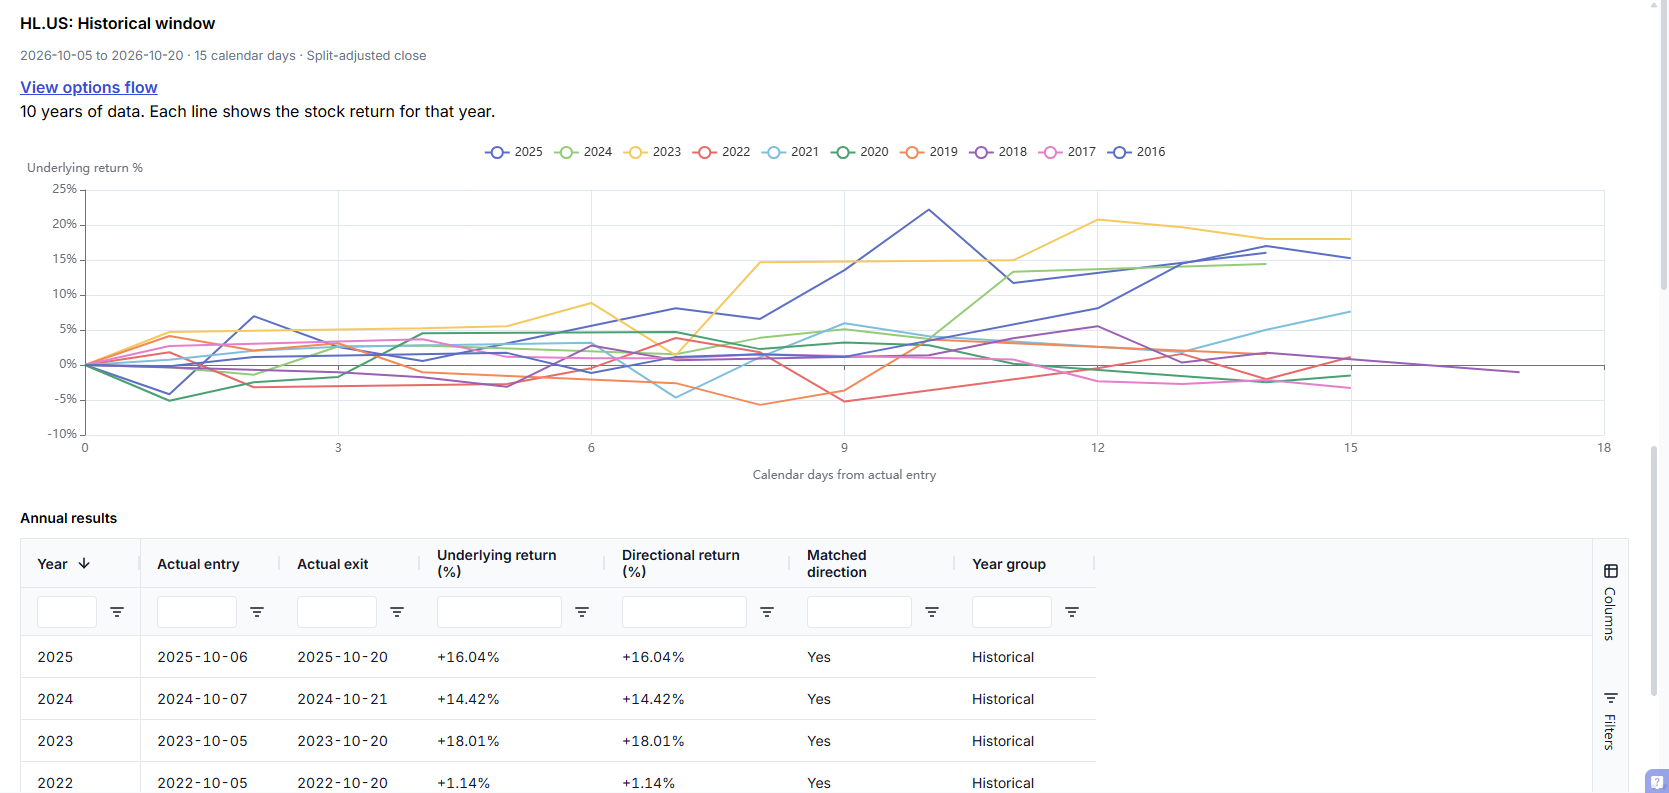
Ten lines this time. Three recent years were strong (+16.04% in 2025, +14.42% in 2024, +18.01% in 2023), the losing years finished within about 3% of flat, and no single year carries the result. The finish hides some of the ride: several paths were down around 5% partway through the hold. This is what a candidate worth researching further looks like. It is still not a trade: it is the same precious-metals idea as the rows above it, and it needs your chart, your risk and your entry rules before it becomes one.
6. Find historical windows: let it search
Fixed window is for when you already know your dates. Often you do not. You know roughly when you want in and roughly how long you want to hold.
Switch Mode to Find historical windows and give it ranges instead:
- Planned entry date and Last possible entry, up to 60 days apart, plus the Entry step (days) between tested dates.
- Minimum holding days and Maximum holding days, plus the Holding step (days).
- How many Recent validation years to hold back.
It tests up to 240 entry and holding combinations per symbol and returns the strongest qualifying one: a proposed entry date, exit date and holding days. Range endpoints are always tested. A coarse step leaves days in between untested, and the result never pretends otherwise. If more than 1,500 symbols qualify, the search asks you to narrow the filters rather than quietly picking a subset, so start with sector, price and liquidity filters.
One detail if you rank by stock or options volume: median directional return still picks each symbol's window, and volume only orders the symbols. Volume says nothing about which holding period is better, so it never chooses one.
We describe the result carefully: it is the best historical window within the range you tested. It is not a forecast of when a move will start, and not a claim about how long one will last.
Our search:
| Setting | Value |
|---|---|
| Entry range | October 5 to October 30, 2026 |
| Entry step | 4 days: Oct 5, 9, 13, 17, 21, 25, 29 and 30 (the end of the range is always tested) |
| Holding range | 20 to 60 calendar days |
| Holding step | 5 days: 20, 25, 30, and so on up to 60 |
| History | 10 years, with 2 recent validation years |
| Rank highest first | Median directional return |
That is 8 entry dates × 9 holding periods = 72 combinations per symbol. With 2 years held back, the older 8 years choose the window.
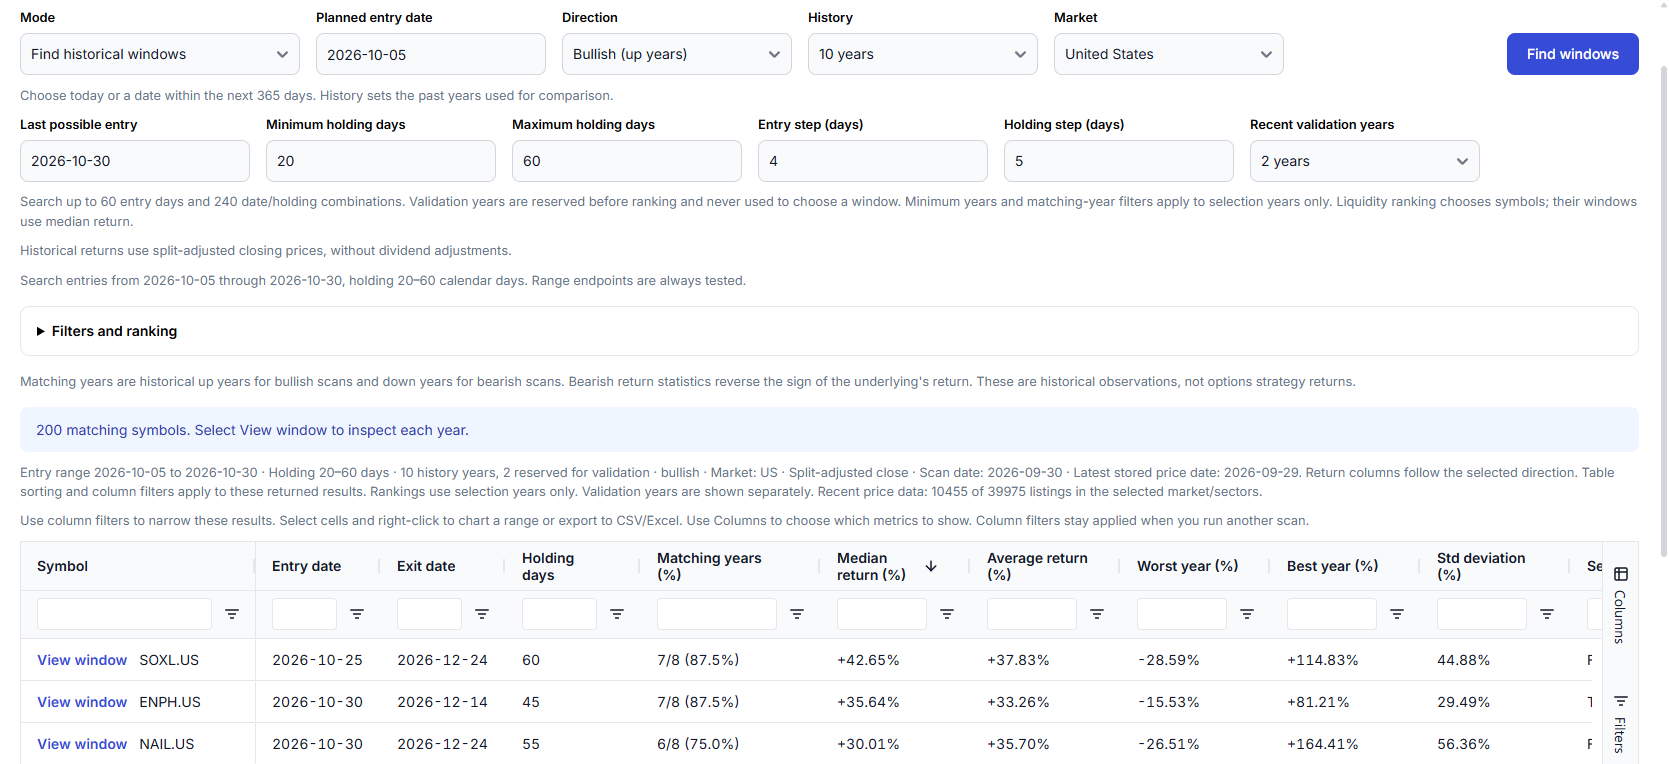
| Symbol | Selected window | Days | Matching (selection) | Median | Worst year | Best year |
|---|---|---|---|---|---|---|
| SOXL | Oct 25 to Dec 24 | 60 | 7/8 (87.5%) | +42.65% | -28.59% | +114.83% |
| ENPH | Oct 30 to Dec 14 | 45 | 7/8 (87.5%) | +35.64% | -15.53% | +81.21% |
| NAIL | Oct 30 to Dec 24 | 55 | 6/8 (75%) | +30.01% | -26.51% | +164.41% |
Three patterns here are worth recognizing, because you will see them in your own searches:
- Leveraged ETFs rise to the top. SOXL and NAIL are 3x leveraged funds. They amplify moves in both directions, which is exactly why their worst years are -28.59% and -26.51%. Filter them out, or read them as leveraged bets on a sector's seasonality.
- The winners sit on the edge of the range. ENPH and NAIL both picked October 30, the last date we allowed. When the best window is on the boundary, the real best may lie outside it. Widening the range is fine, but treat that as a new experiment.
- Longer holds can have an edge in the ranking. Returns are not annualized, so a longer hold gives a stock more room to build a bigger median. SOXL and NAIL chose 60 and 55 days, at or near our maximum.
7. The part we spent the most time on
Searching is dangerous. Test 72 windows across 8 years of data and one of them can look brilliant by luck alone. That is not a flaw in any particular tool. It is what happens whenever you search hard enough through noise. It is tempting to show the winner and stop. We built three checks around it instead.
1. Validation years the search never sees. With 10 years and 2 held back, the search picks the window using only the older 8. The two most recent years are then reported separately, with their own count and median. They never choose the winner and never qualify it for the list.
2. The neighborhood. View window shows a heatmap of every entry date and holding period tested, including the ones that failed your thresholds, plus the share of nearby windows that were also positive. A real seasonal tendency is usually a region. If a window only works entering on October 12 and falls apart on October 9 and 15, it looks less like seasonality and more like a lucky date.
3. Alternatives. You also get up to two distinct alternative windows, so you can see whether the winner is part of a broader pattern or standing alone.
One warning we cannot enforce for you: if you keep tweaking the search until the validation years look good, you have quietly used them to select the window too. Write down your first setup and treat every later run as a new experiment.
ENPH: passes every check but one
ENPH is the second row above and, on the selection years, it is close to a textbook result. Open it:
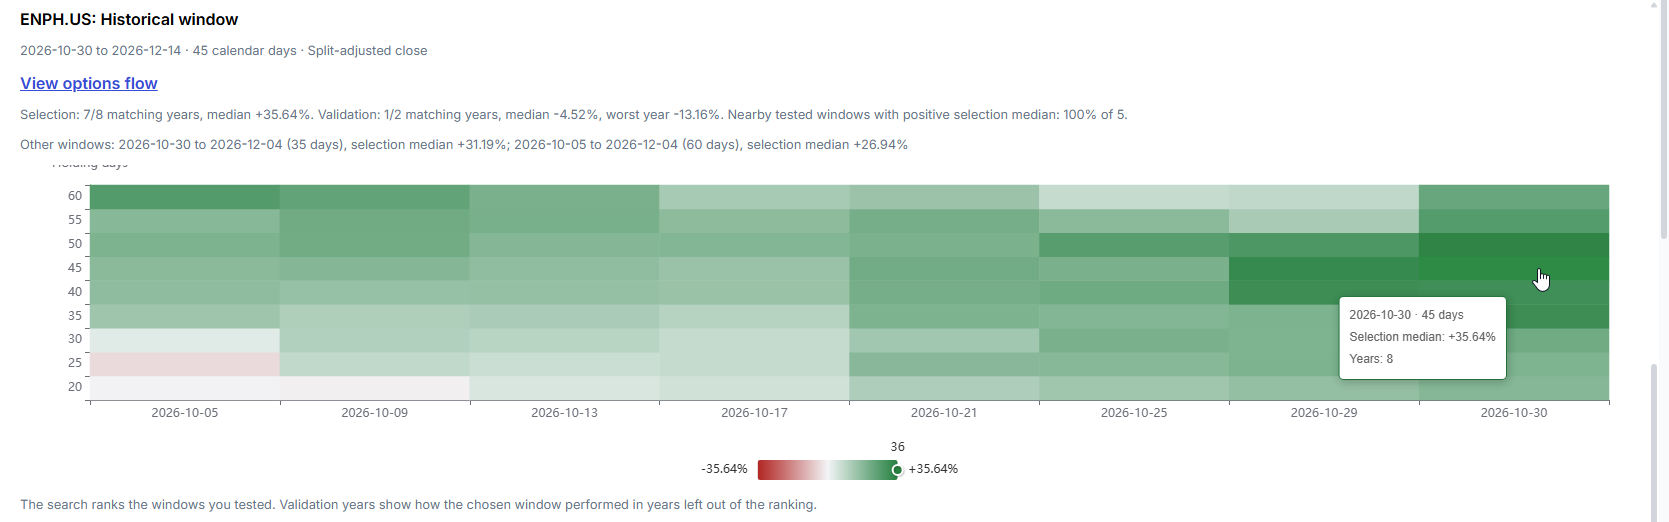
The summary line tells the story in one sentence:
- Selection: 7/8 matching years, median +35.64%.
- Neighborhood: 5 of 5 nearby tested windows positive. The heatmap is green almost everywhere, strongest for late-October entries held 40 to 50 days.
- Alternatives: October 30 held 35 days (+31.19%) and October 5 held 60 days (+26.94%) are also strong.
- Validation: 1/2 matching years, median -4.52%.
Scroll down to the annual results and the reason is plain:
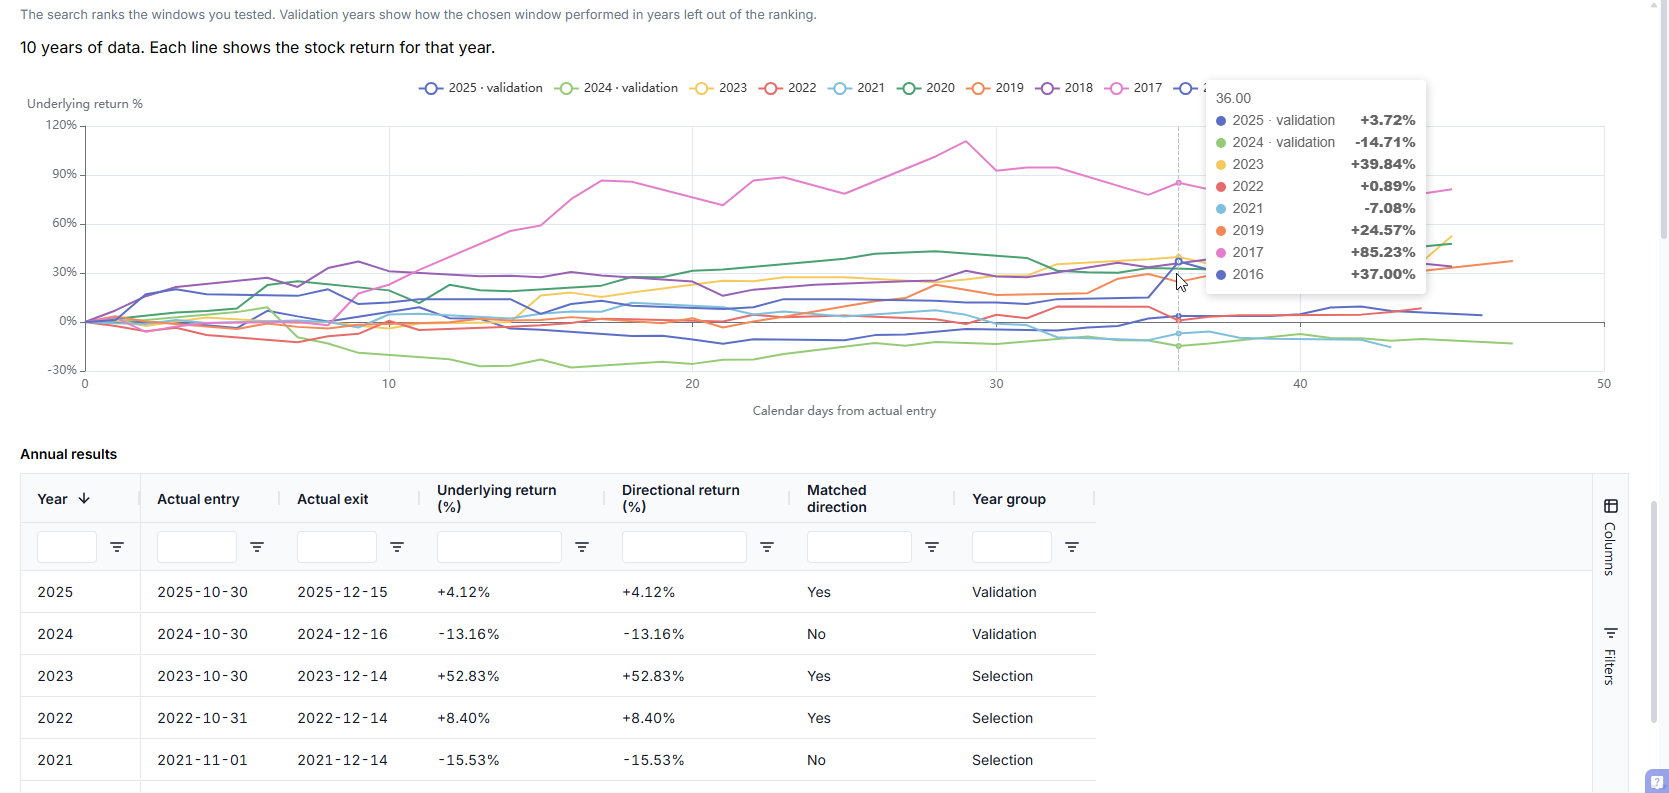
| Year | Actual entry | Actual exit | Return | Year group |
|---|---|---|---|---|
| 2025 | 2025-10-30 | 2025-12-15 | +4.12% | Validation |
| 2024 | 2024-10-30 | 2024-12-16 | -13.16% | Validation |
| 2023 | 2023-10-30 | 2023-12-14 | +52.83% | Selection |
| 2022 | 2022-10-31 | 2022-12-14 | +8.40% | Selection |
| 2021 | 2021-11-01 | 2021-12-14 | -15.53% | Selection |
The two years the search never saw returned -13.16% and +4.12%. Meanwhile the selection median leans on some enormous years: 2017 was the best at +81.21%, and 2023 added +52.83%. With a standard deviation near 30%, this is a volatile stock that happened to have several huge Novembers.
The heatmap and the validation years answer different questions. The heatmap asks whether the result depends on one exact date, and ENPH passes easily. Validation asks whether the pattern held up in years the search did not use, and ENPH does not. The neighbors cannot rescue it, because every nearby window is built from the same eight selection years.
Two years do not prove the pattern broke. But they are a good reason not to trust a +35.64% median. Our call: ENPH goes on a watch list, not a shortlist. The tool does not issue a pass or fail on validation. It shows you the evidence, and the judgment is yours.
8. Bearish ideas read in the other direction
Switch Direction to Bearish (down years) and matching years now means down years. Directional returns flip the sign: a fall from $100 to $96 is -4% underlying and +4% directional. The price-path chart still slopes down, because it always shows the underlying. This keeps bearish candidates comparable. It does not include borrow costs, margin, option premiums or fees.
Apply the same checks as for bullish ideas: usable years, the size of the adverse years, validation and the path. And be willing to find nothing. An empty bearish shortlist is a valid answer, not a failed scan.
9. Filter for options activity, and know what that number means
A lot of you research seasonal moves to set up options trades. So both the Screener and Upcoming Windows now have an Optionable filter, a Min avg options volume filter and an average options volume column.
The number is contracts per day across all calls, puts, strikes and expiries over the last 20 completed market sessions, built from OCC's daily equity-options reports. It covers supported US-listed underlyings, and it is separate from the large-trade feed in Options Flow. We were strict about the edge cases:
- Missing or incomplete coverage shows N/A, never a made-up zero. A positive volume minimum excludes N/A rows.
- Unknown optionability is shown as unknown. We do not assume a stock has no options just because we have no record of them.
Use it to shortlist, not to decide. A floor like our 5,000 contracts also drops names with active but smaller options markets, and any name showing N/A, so set it to fit what you trade. And heavy total volume on a symbol says nothing about the spread on the strike and expiry you want. Check the chain: bid/ask, quoted size, volume and open interest.
And remember seasonal returns describe the underlying. HL rising through a 15-day window does not mean a call spread on HL made money: premium, strikes, time left and implied volatility all matter (how option prices behave). For US symbols, the View options flow link in every window opens that symbol in Options Flow. To test a spread idea, use the Options Payoff Chart.
10. What the numbers are built on
We want you to be able to reproduce any number you see.
- Prices: end-of-day closes, split-adjusted, with no dividend adjustment. A 2-for-1 split turns a $100 close into $50 without anyone losing a cent, so unadjusted prices would show a fake 50% loss. Dividends are not added back, and ex-dividend drops stay in the price path.
- Returns:
(exit close / entry close - 1) × 100, before trading costs. - Dates: holding periods are calendar days. Each past year uses the same month and day, with February 29 mapped to February 28. If a boundary is not a trading day, the next available session within seven days is used, which is why AKA's 2024 entry was October 7 and ENPH's 2021 entry was November 1. Only completed windows with valid prices at both ends count.
- Paths: the yearly lines use daily closes, so they will not show every intraday swing against you.
- Universe: currently active listings. Delisted stocks are not in the history, which can flatter results slightly.
- Freshness: every scan prints its scan date, the latest stored price date and how many listings had recent prices. Ours: scan September 30, prices through September 29, recent price data for 10,455 of 39,975 US listings.
A calendar-month chart and an exact holding window can give different answers because their boundaries differ. Compare identical dates and the same usable years before treating a difference as an error.
11. When to drop a candidate
Rejecting ideas is half the job. Every example in this post hit at least one of these:
- Too few usable years, even when every one of them was positive (AKA, 5 years).
- One exceptional year carries the average (AKA's +102% in 2023).
- Rare large losses drag the average well below the median (AEC's -44% worst year, NOK's average at less than half its median).
- Several "ideas" are really one idea (five precious-metals miners in one list).
- The selected window looks great, but the held-back years tell a weaker story (ENPH).
- The winner sits on the edge of your search range, or it is a leveraged product (SOXL, NAIL).
- The price or options data is stale or incomplete, or the contracts you would trade have wide quotes and thin size.
- An earnings date or corporate action inside the window changes the trade you would be taking.
If a scan returns nothing, read the status message first. Strict filters can empty the list, but so can missing data, and loosening a threshold cannot create history that is not there.
12. Close the loop in your journal
This is where a journal earns its place. A seasonal screener tells you what the calendar has done. It cannot tell you whether seasonal trades work for you.
- Write the setup down first. Scan date, market, dates or ranges, steps and every filter, before you look at results.
- Inspect before you shortlist. View window on every candidate: losing years, paths, neighborhood, validation, and the options chain if it is an options idea.
- Tag the trade. Add a tag such as Seasonality when you take it, and keep it even when the trade loses. See the tags guide.
- Review later. Filter by that tag, or use Tags Analysis and pivot grids, to compare seasonal trades with the rest. Did you enter near the window? Did you hold as planned? MFE and MAE and Exit Insights show how the trades developed.
A short research note makes that review honest. It stops you from rerunning the search later until something looks familiar.
| Record | Example |
|---|---|
| Question | Bullish candidates for a 15-day hold from October 5 |
| Inputs | Scan date, market, entry and holding ranges, history, steps, every filter |
| Evidence | Matching years, median, average, worst year, usable count, validation |
| Decision | Shortlist, reject or watch, with one line of reasoning ("ENPH: watch, validation median -4.52%") |
| Actual trade | Fills, size, costs and exit reason, recorded in the journal |
The vs. My Trades tab adds broader context: your own monthly results next to a symbol's seasonal history. After a few months you will have an answer a screener alone cannot give you: did these ideas actually make you money?
Everything else that changed
- Calendar Screener: monthly, quarterly and weekly scans across thousands of symbols, 5/10/20-year lookbacks, sector and consistency filters, now with the same options filters. Click a symbol to open its full seasonality in Returns.
- Recent liquidity filters: average daily volume and traded value from recent sessions, in the symbol's own currency.
- Searchable multi-select sectors.
- A proper grid: sort, filter, rearrange columns, Chart Range, and CSV or Excel export with numbers kept numeric. The annual results grid works the same way.
- Settings saved automatically when you run a scan.
- Clearer empty results: missing data is reported separately from "nothing matched your filters", so you know whether to widen a filter or wait for data.
For your first pass, pick one market and one holding horizon. Set a minimum of 8 usable years, run the scan, open a handful of candidates, and write down why each one stays or goes. Start in Upcoming Windows.
New to TradesViz? The seasonality screener overview covers what is included and how to try it.
A seasonal pattern is a question, not an answer. Upcoming Windows helps you ask it properly, and your journal tells you how it went.
Tell us what you want next at [email protected].