As we are wrapping up the year 2023 on TradesViz's feature development list, we wanted to end the year with a feature a lot of users have been asking for a long time!
Since we introduced the equity curve/money transactions tab - a way to easily manage and visualize your overall trading equity curve with deposits, withdrawals, and pnl, there has not been much improvement other than the flexibility of being able to filter out certain types of transactions.
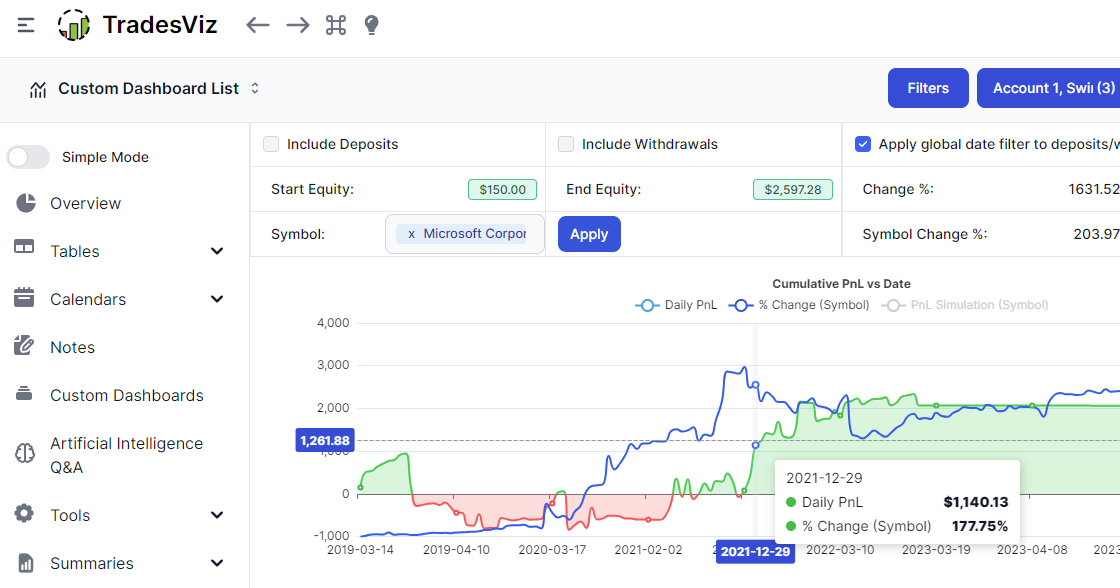
With this update, we bring the ability to compare your chart/graph with any symbol's %-change in the same duration. Here's an example showing the performance of SPY from 2019 to 2021 compared to the sample import file's performance curve:
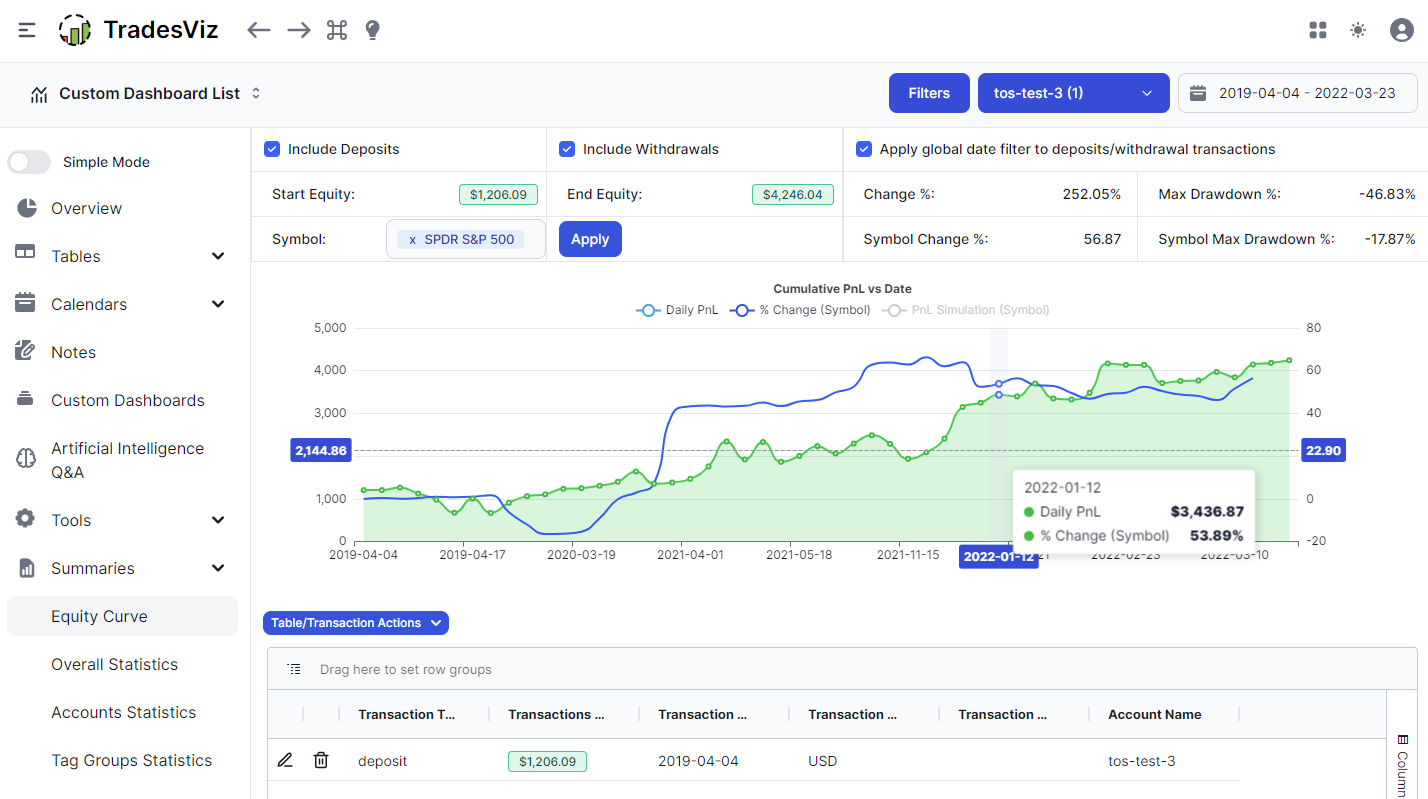
Just click on the input box search for any symbol and click apply. You will see a blue line overlayed on top of the equity curve. Notice that there is also another series called PnL Simulation which shows what your total pnl would have been if you had invested the same initial deposit at the start date in the given symbol (100% allocation).
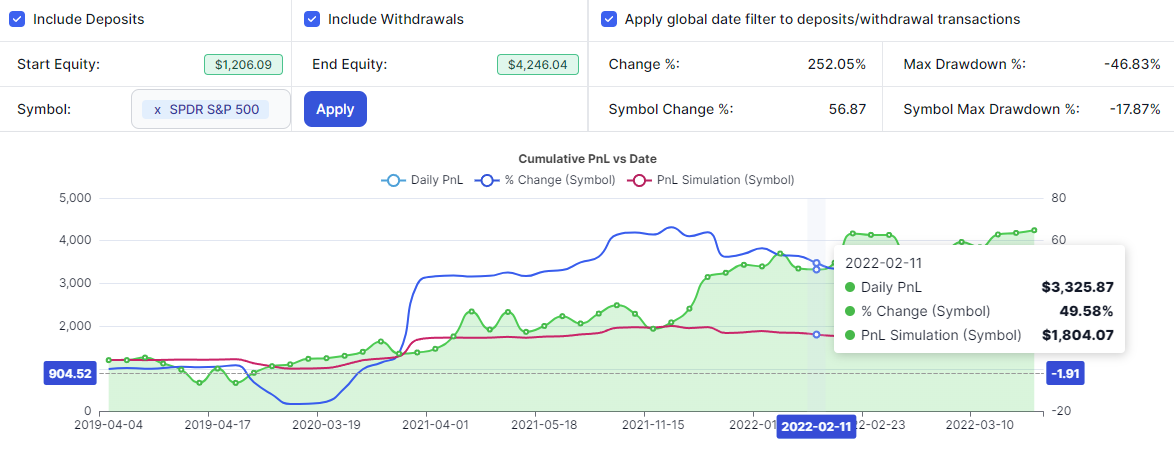
To make sure the PnL simulation works as you expect it to, make sure to add a deposit at the beginning of your trading - i.e. on the first trading date because it only uses the first data point in the series.
Along with the 2 comparison series (% change and the PnL simulation), you are also able to see the total change % and the max drawdown % at the top right corner.
We want to keep this tab simple and easy to use as it's very frequently used by a lot of traders with multiple portfolios.
Use this feature to see how well you compared against the markets - not just SPY or US-specific markets, but also popular global indices such as DAX, NIFTY, etc.,
We hope this feature gives you a good idea about a summary of your trading performance for this and all previous years!
As always, let us know your feedback and feature requests by emailing us at [email protected].