Real-Time Stock Screener: 18 Strategies, Live Charts, Journal Integration
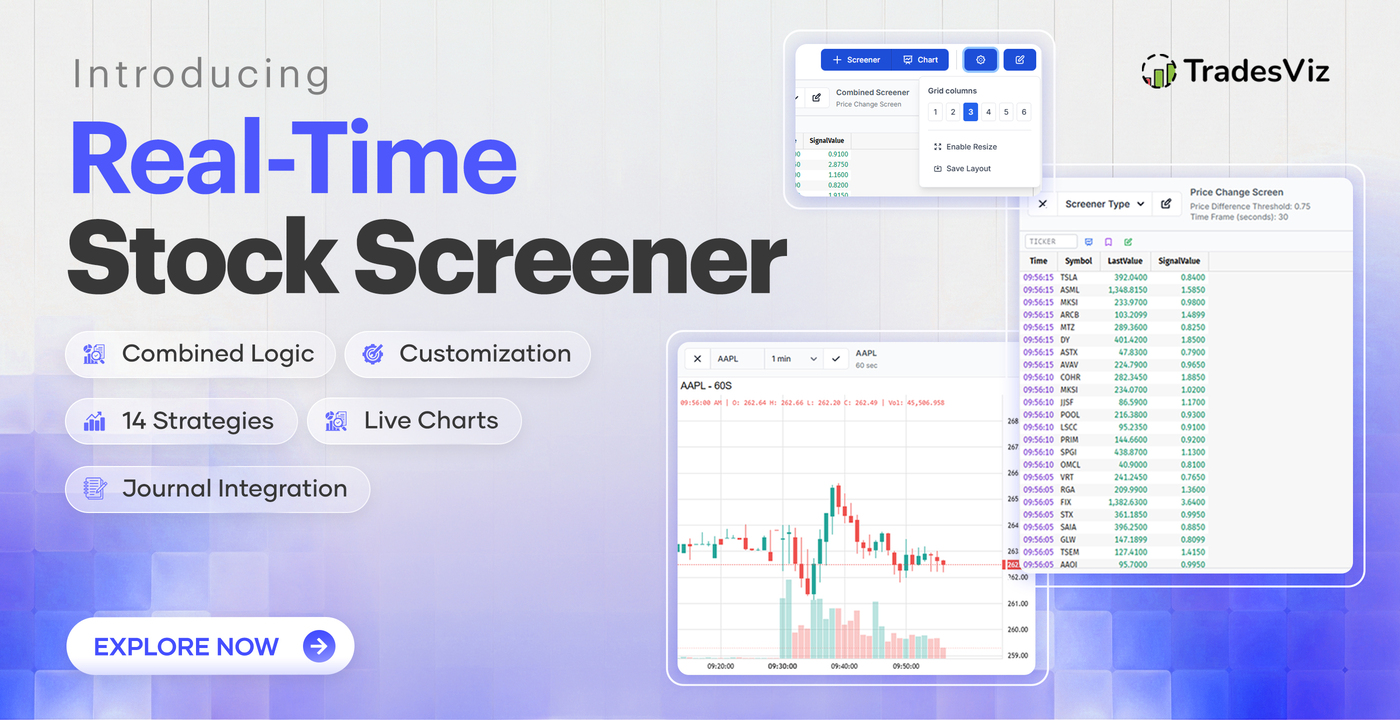
TradesViz is the first trading journal with a built-in real-time stock screener. 18 screening strategies, live charts, and one-click journal integration - all in one place.
Guides, changelogs, deep dives and everything trade journaling.
TradesViz is the first trading journal with a built-in real-time stock screener. 18 screening strategies, live charts, and one-click journal integration - all in one place.
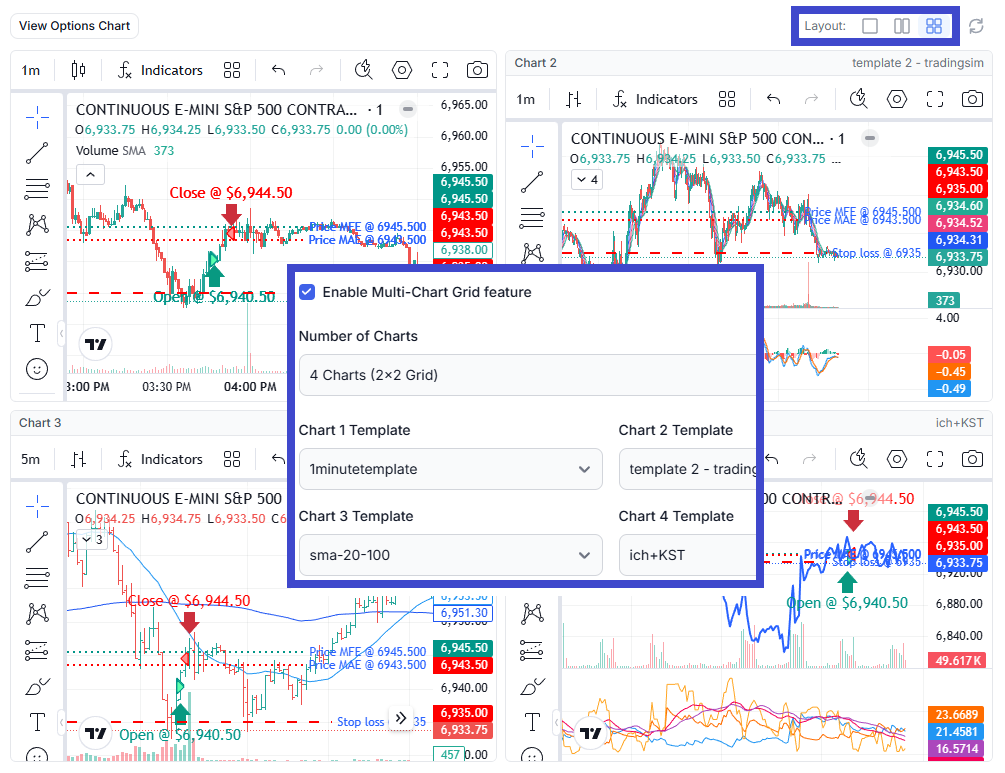
Introducing Multi-Chart Grid Layout for Trade Explore - a powerful new Platinum feature that lets you display up to 4 TradingView charts simultaneously, each with its own unique indicator template. Analyze your trades from multiple timeframes and indicator perspectives at once, without switching between chart configurations. Perfect for multi-timeframe analysis, strategy validation, and accelerating your trade review workflow.
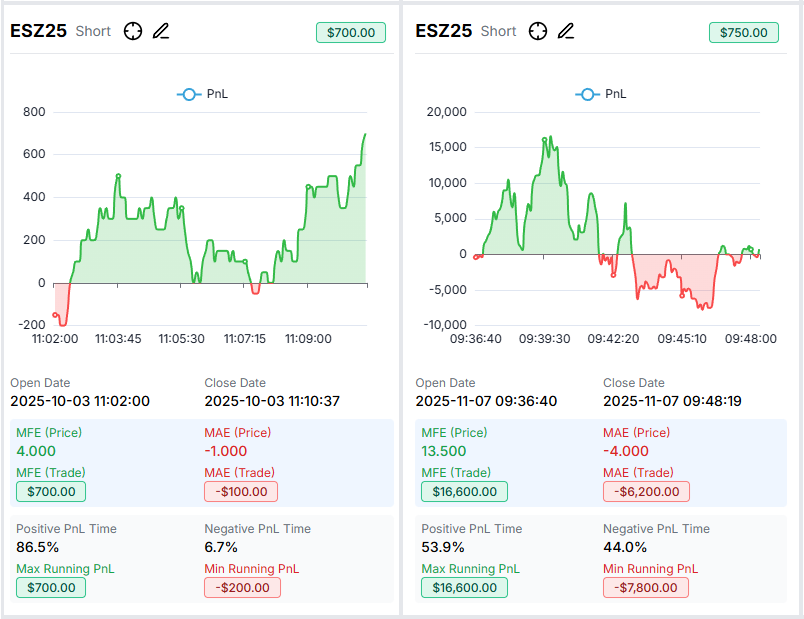
Introducing the Drawdown View - a new way to visualize running PnL charts for multiple trades at once. Quickly scan through your trades to spot drawdown patterns, compare MFE/MAE stats, and see how long you spent in profit vs loss across your positions. Perfect for identifying risk management patterns and exit timing issues without clicking into each trade individually.
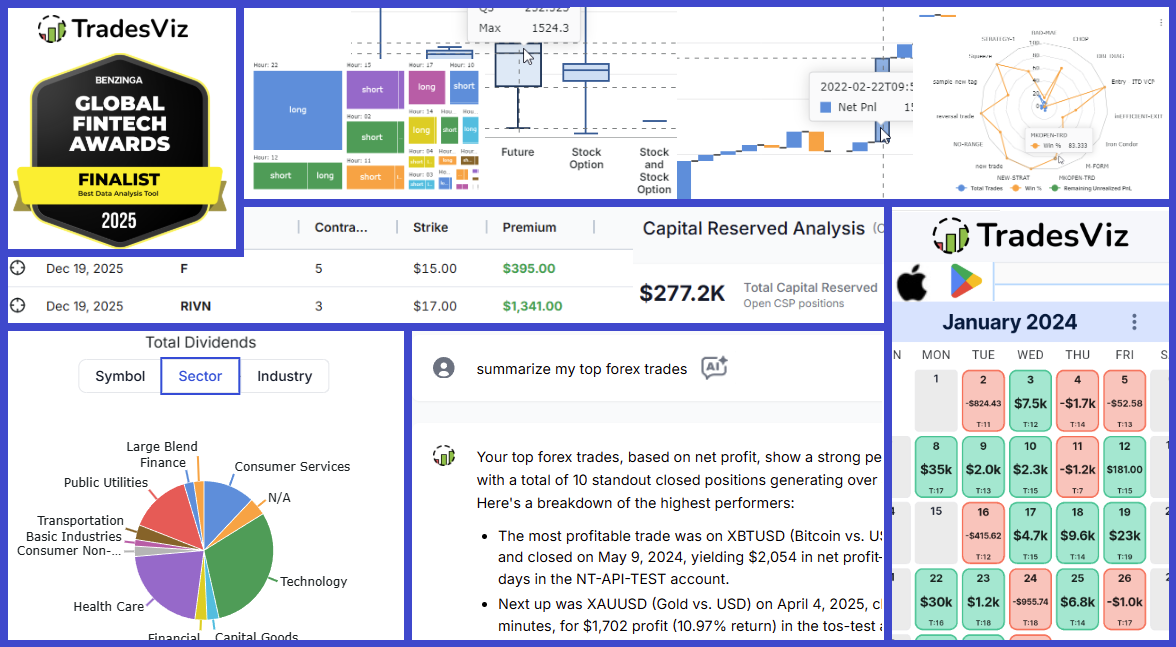
H2 2025 brought massive upgrades: The launch of the Options Command Center, AI Trade Chat, and a completely rebuilt Mobile App v2. Read the full recap of our Benzinga FinTech Award nomination, running PnL for spreads, and six months of rapid innovation.
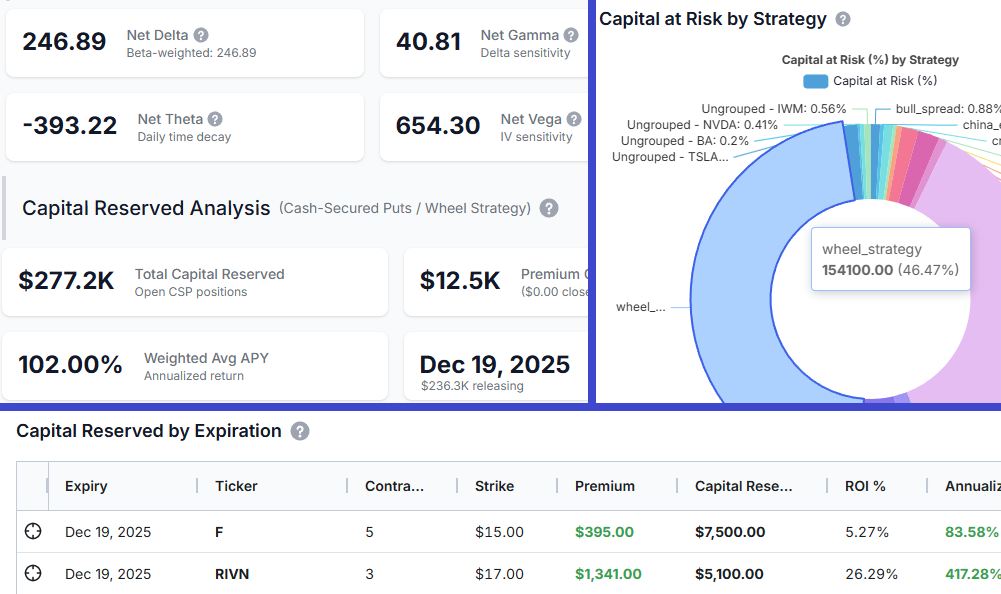
Introducing TradesViz's new Options Command Center Dashboard - a portfolio management hub for options traders. View aggregated Greeks (Delta, Gamma, Theta, Vega) across all positions, group multi-leg strategies with tags, analyze capital at risk with interactive treemaps, and track position-level details with drill-down leg views.
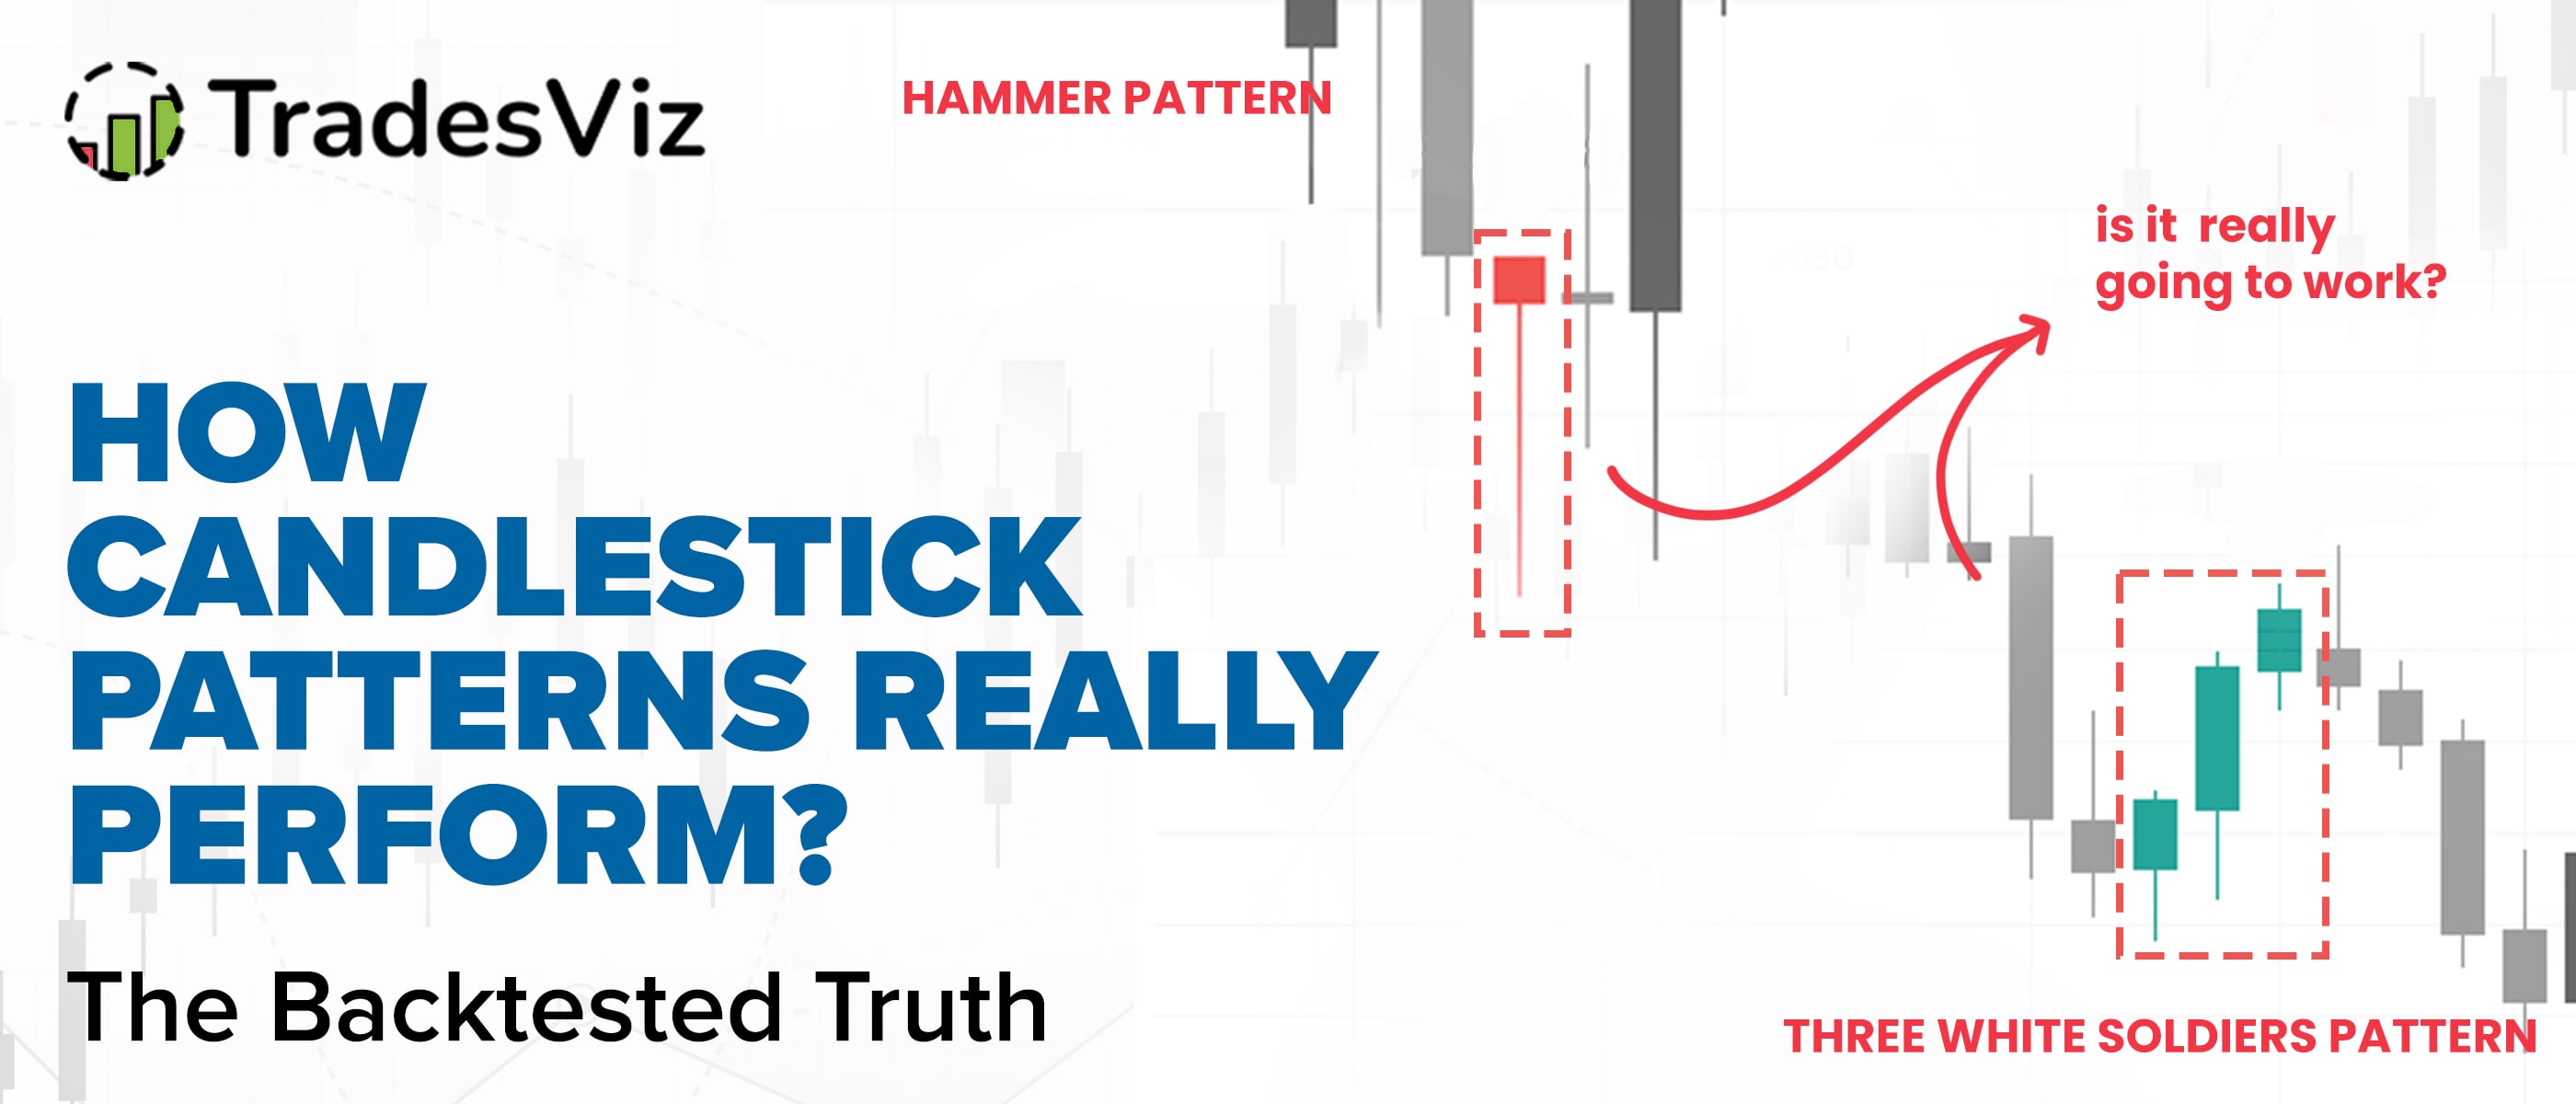
Discover how to scientifically validate candlestick patterns using TradesViz's powerful backtester. This comprehensive guide reveals surprising results from backtesting classic patterns on ES futures and AAPL, including why the Bearish Engulfing pattern actually performs as a bullish signal with 75%+ win rates. Learn the exact EZstockscreener query syntax for pattern detection, see real performance metrics, and master data-driven trading strategies that actually work.
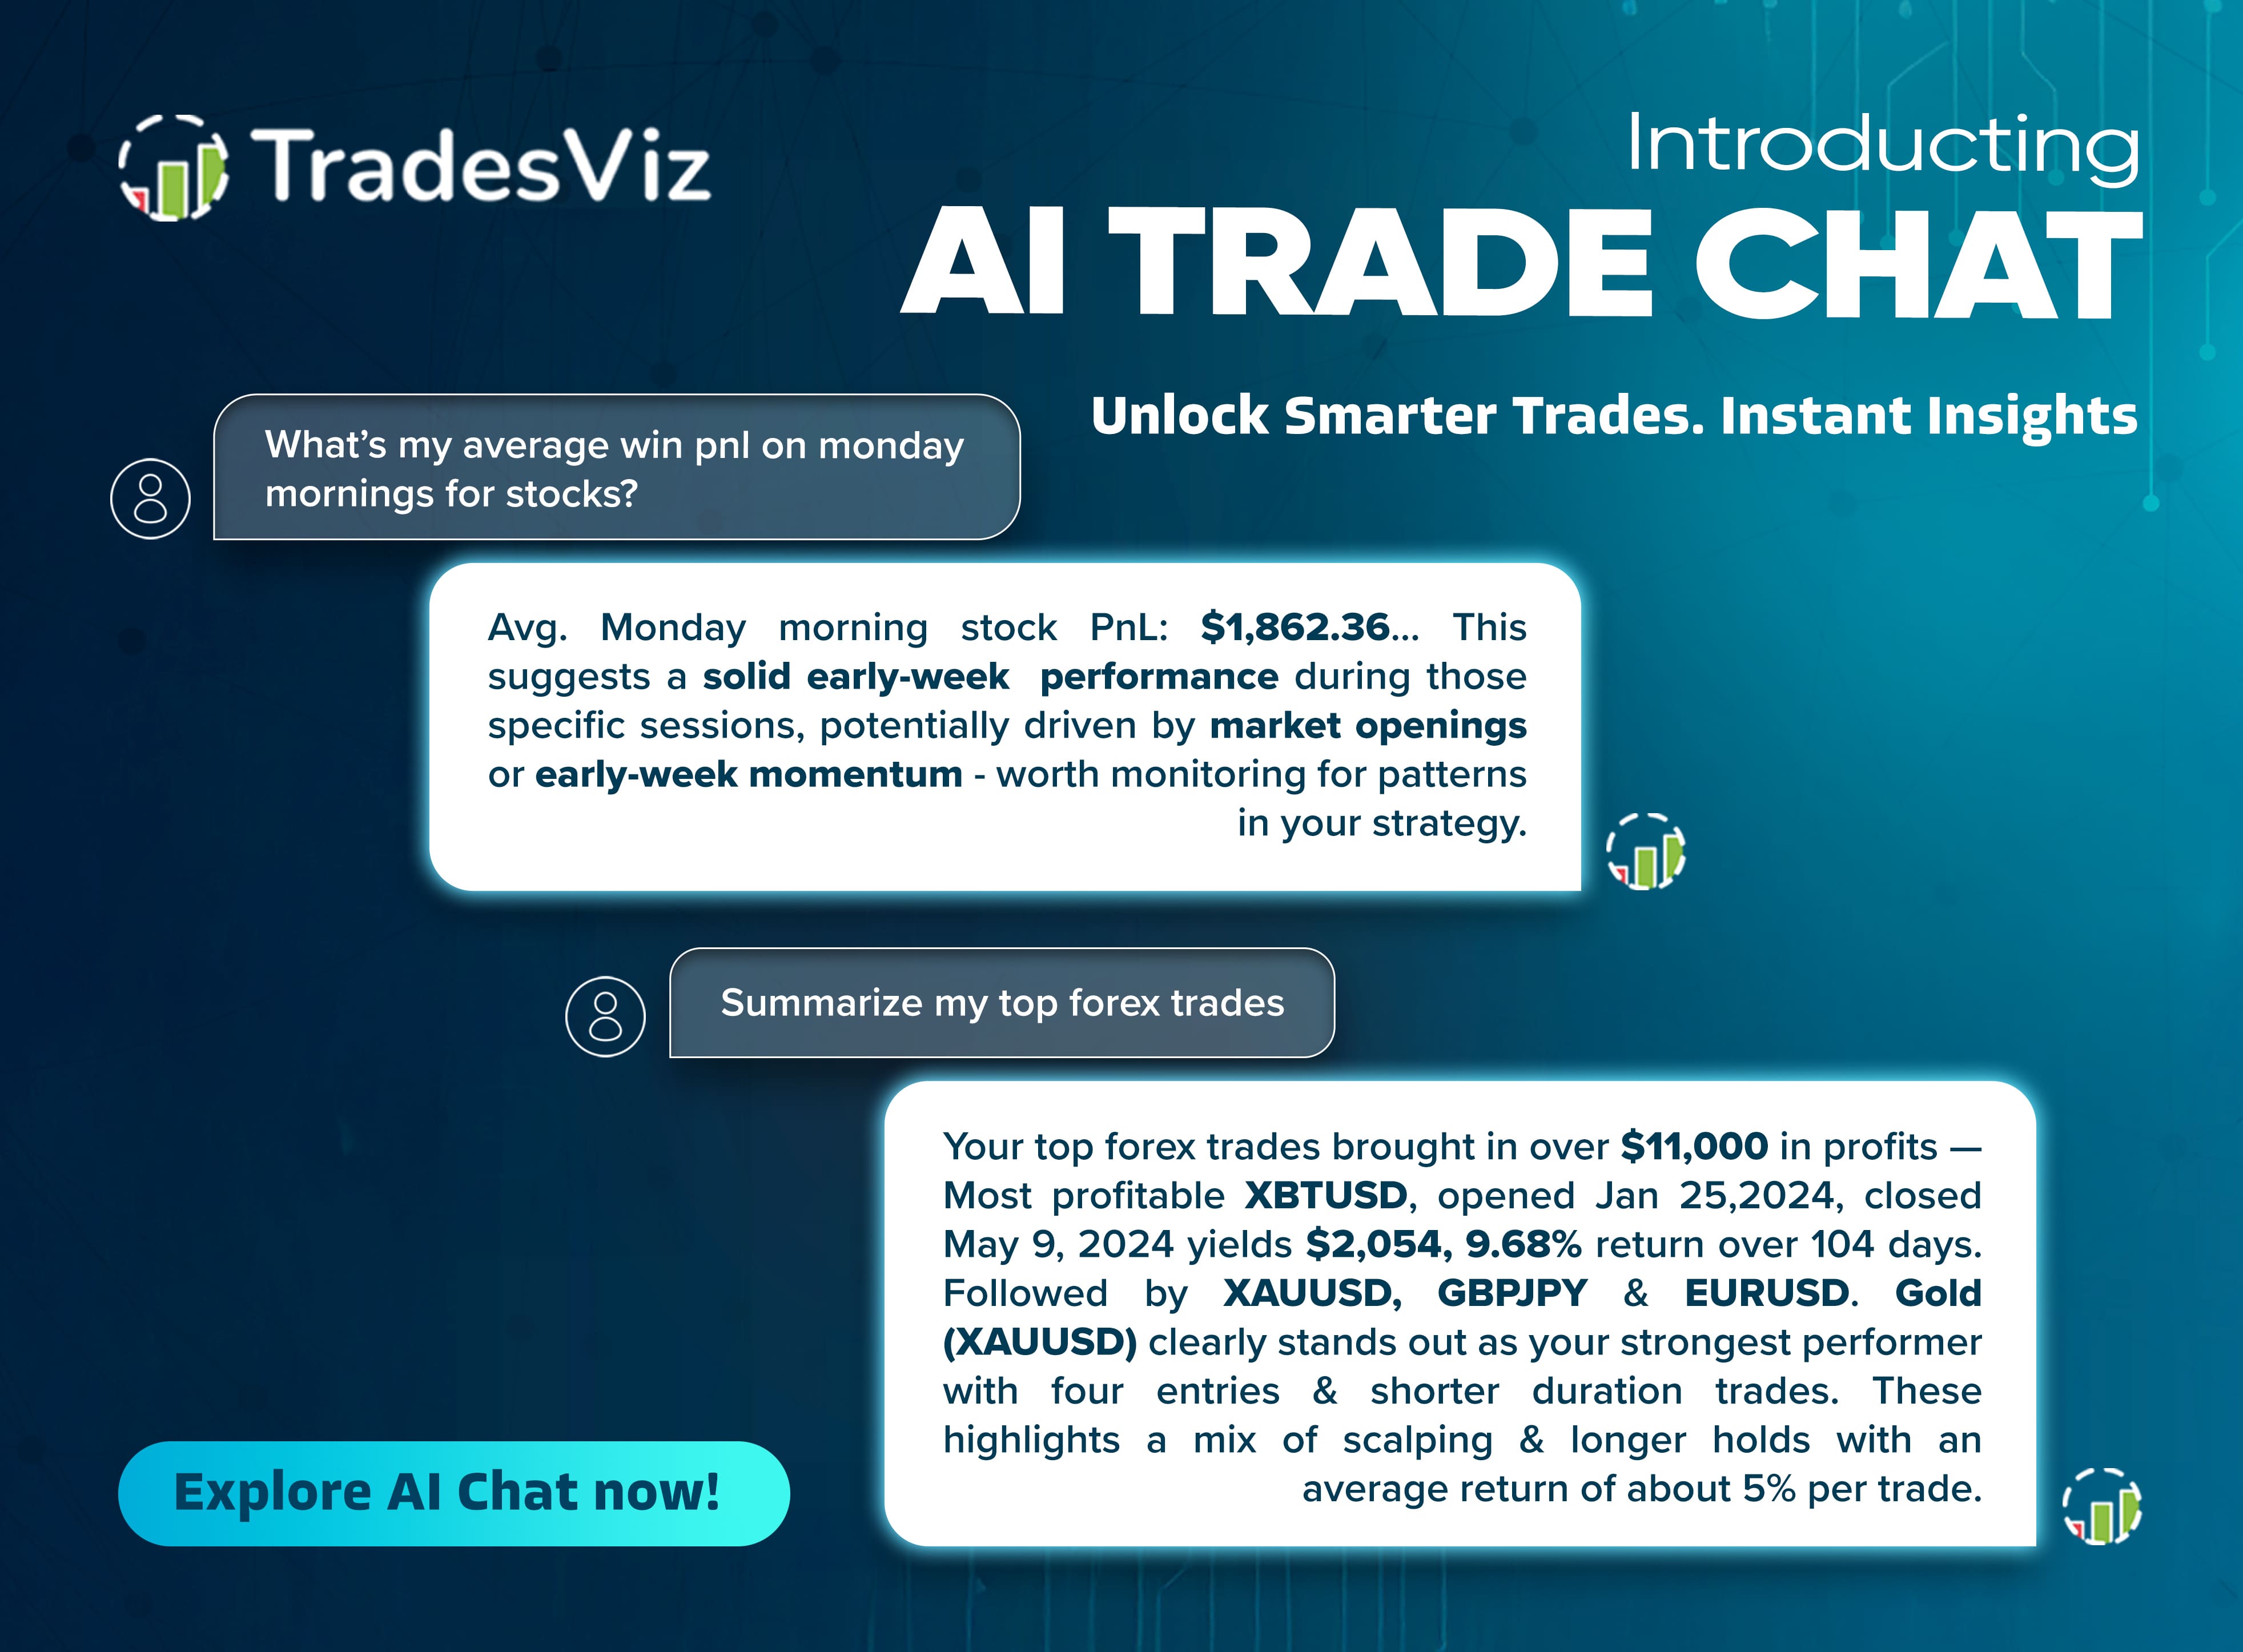
AI Q&A, AI notes, AI summary, and the next AI feature of TradesViz is here: It is not possible to chat with your trades and ask ANY questions. Experience the most advanced AI trade chat with internal chain-of-thinking and structured answering capabilities.
The account statistics tab is a way to view and visualize 100+ KPIs across many trading accounts in TradesViz.
A complete revamp of the TradesViz mobile app with new features, faster UI, and more!
We've had a lot of new types of analysis created from the grids and charts of TradesViz over the years. We just launched an update to the no. of chart types you can make - this greatly improves the utility of pivot grids and the AI widgets! This new list includes box plots, treemaps, waterfall charts, range bars, and more!
Learn how to generate custom stats, and use those custom stats to calculate and create calculated custom stats - the first time in an online trading journal! All of this is possible within TradesViz with pivot grids' new improvements related to custom columns and trade plans!
Just imported your trades and not sure why the numbers are not matching? Read on to understand more about why this happens, what data your brokers provide, and how to get a better match!
We have 61 detailed guides for connecting your broker and importing trades.
View all integrations & import guides