Your options trading journal.
From research to review.
Research unusual options activity, inspect multi-leg order structures, explore strategies with payoff charts and simulation, and analyze your own spreads, Greeks and results. TradesViz brings the full options workflow into one platform, with trade plans and tags connecting the idea to the trade you can review.
Explore the rebuilt options flow research tools ↓
-
Grouped options flow, Footprint research & AI summaries
-
Options execution + multi-day strategy backtesting for all IN/US optionable tickers
-
World's first and only online options chain simulator
-
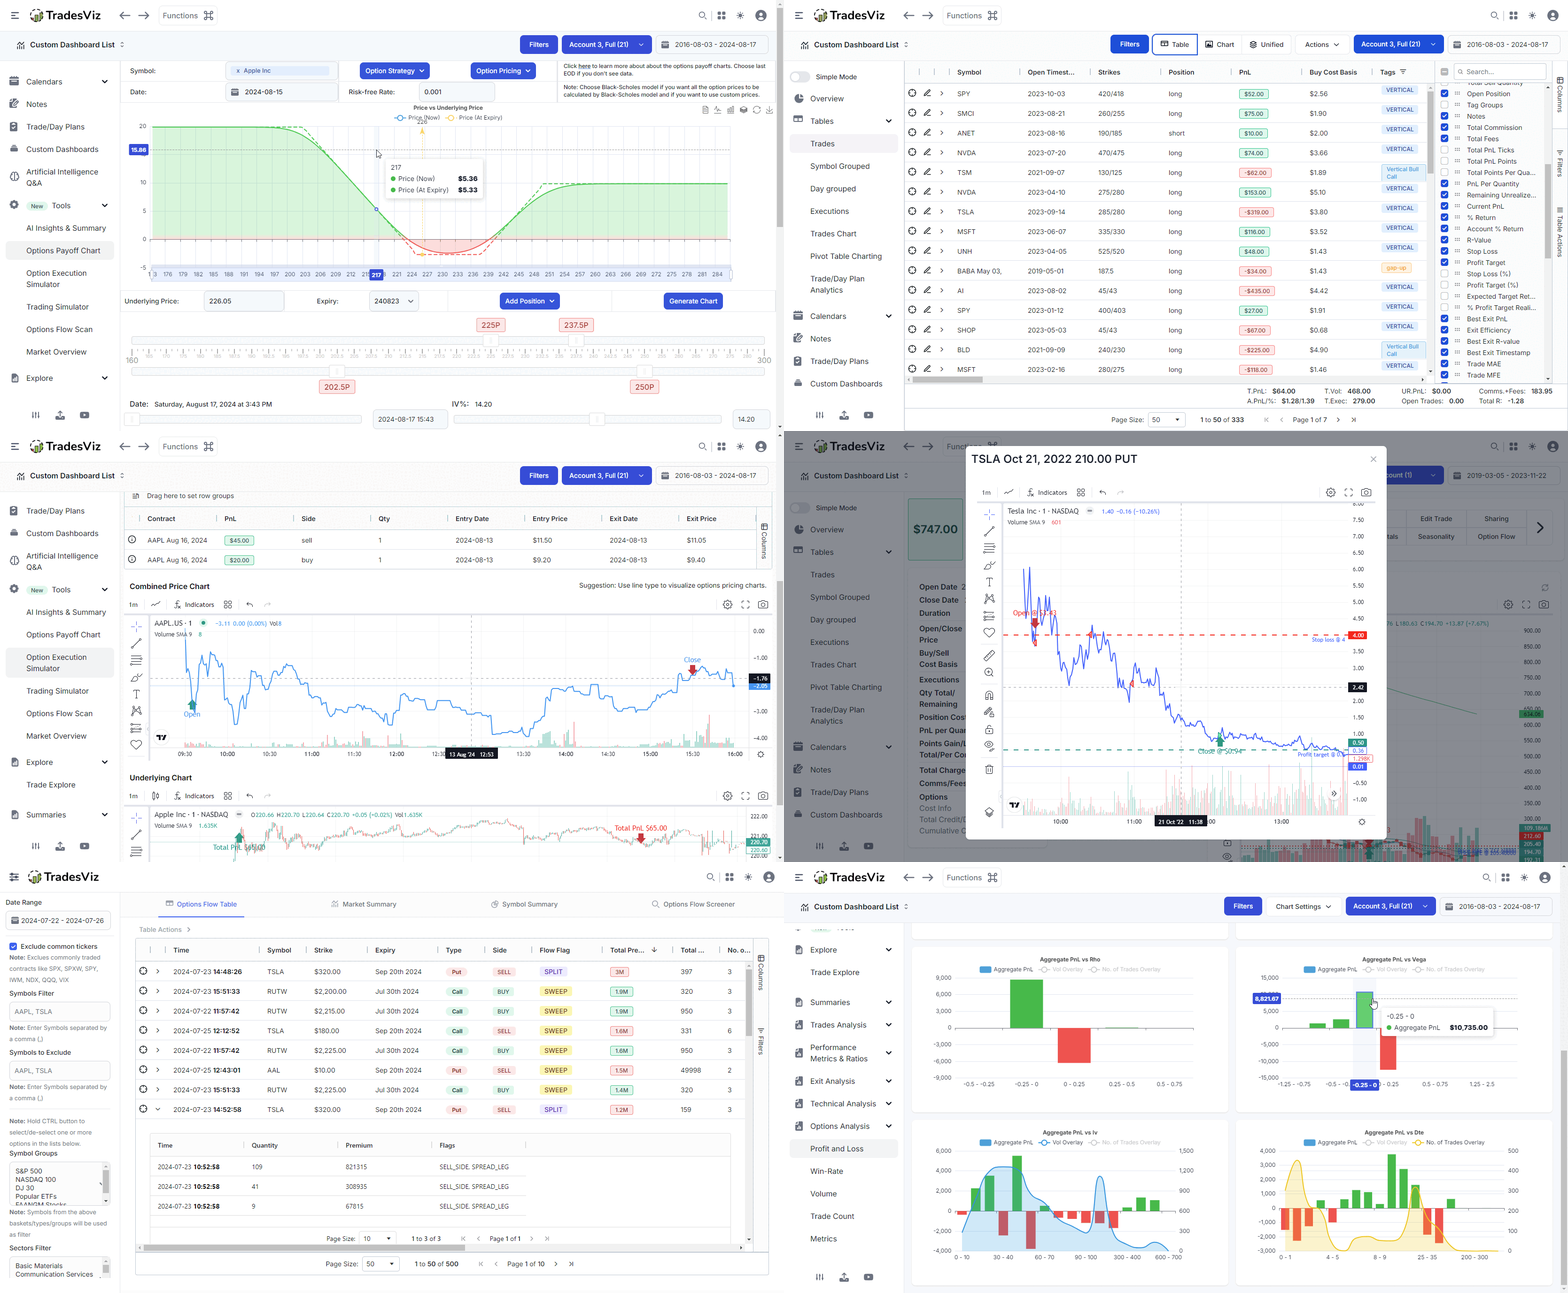
Automated options greeks generation and statistics
In-depth options greeks metrics
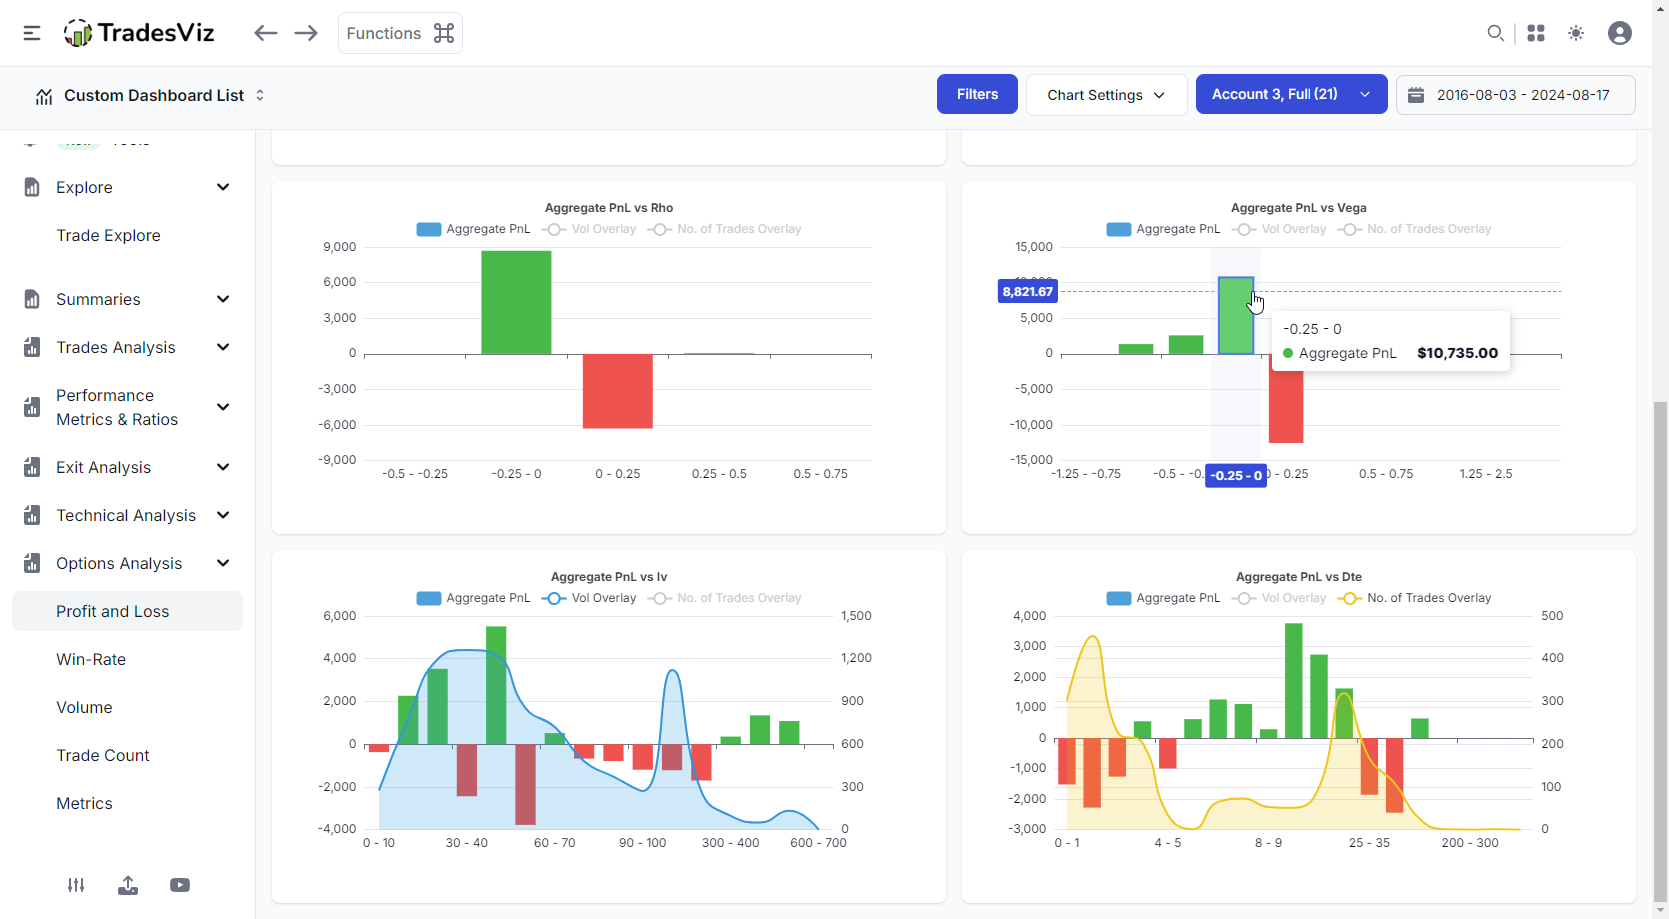
TradesViz is the first and the only trading journal to provide automated greeks generation for each option leg along with greeks analysis (delta, theta, rho, vega, gamma, dte, IV) with respect to price range, volume range, risk ratios and more.
Expiries in Trading Calendar
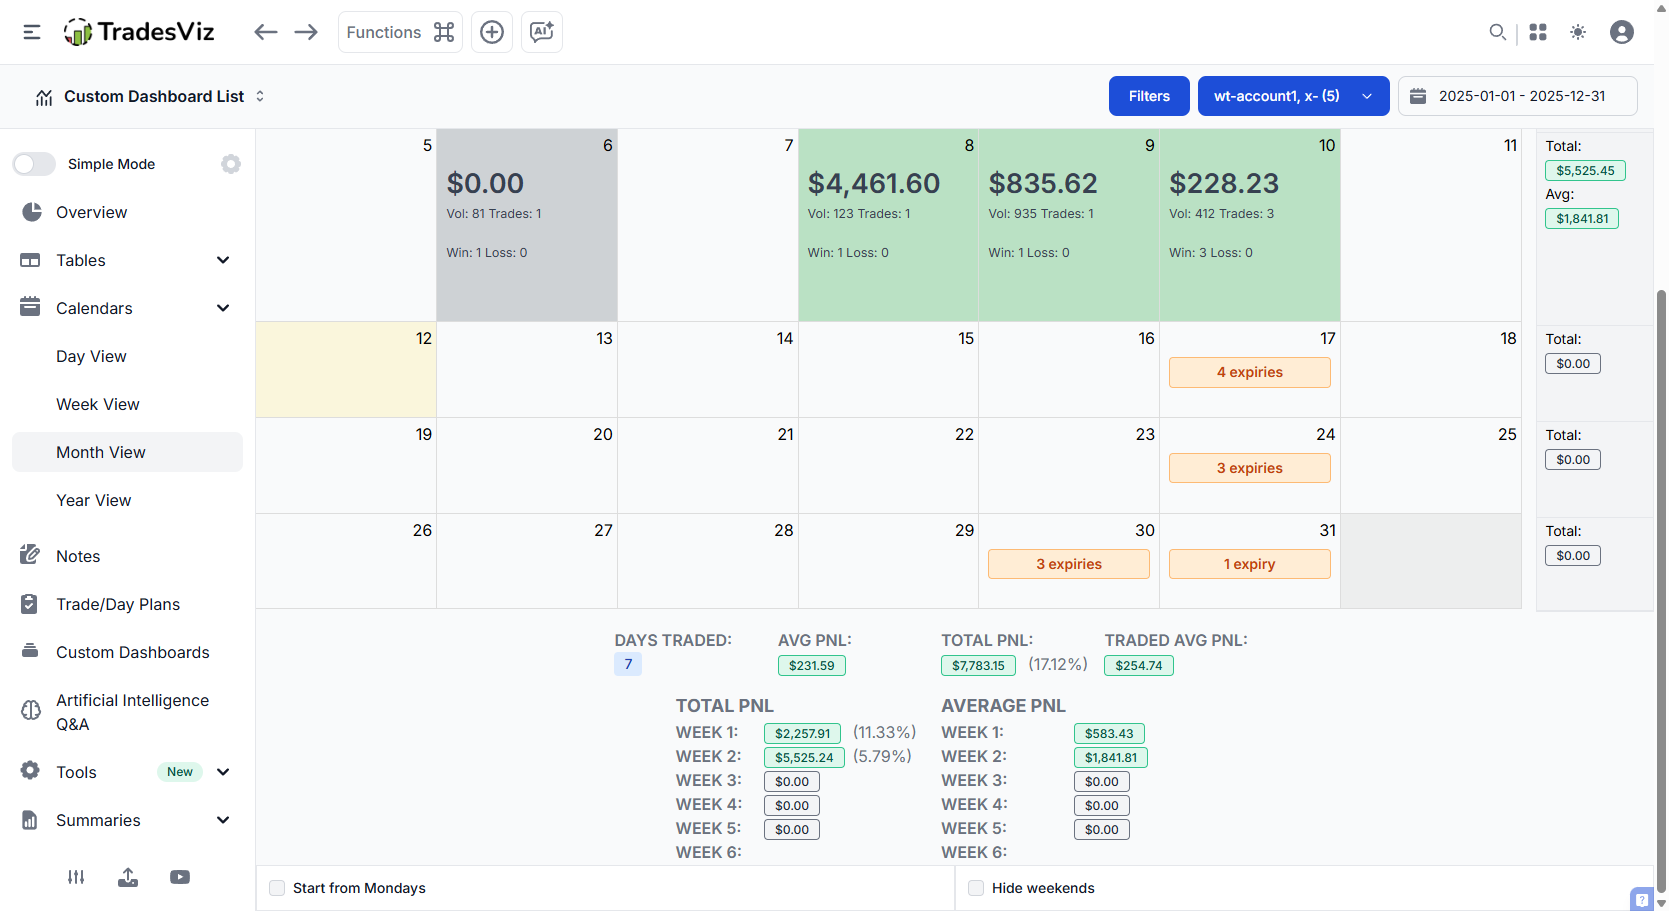
Never miss an expiry again! TradesViz trading calendar now supports options expiries for all US/IN optionable symbols. View all your options expiries in one place along with your trades and other important events.
Options flow research, connected to your journal
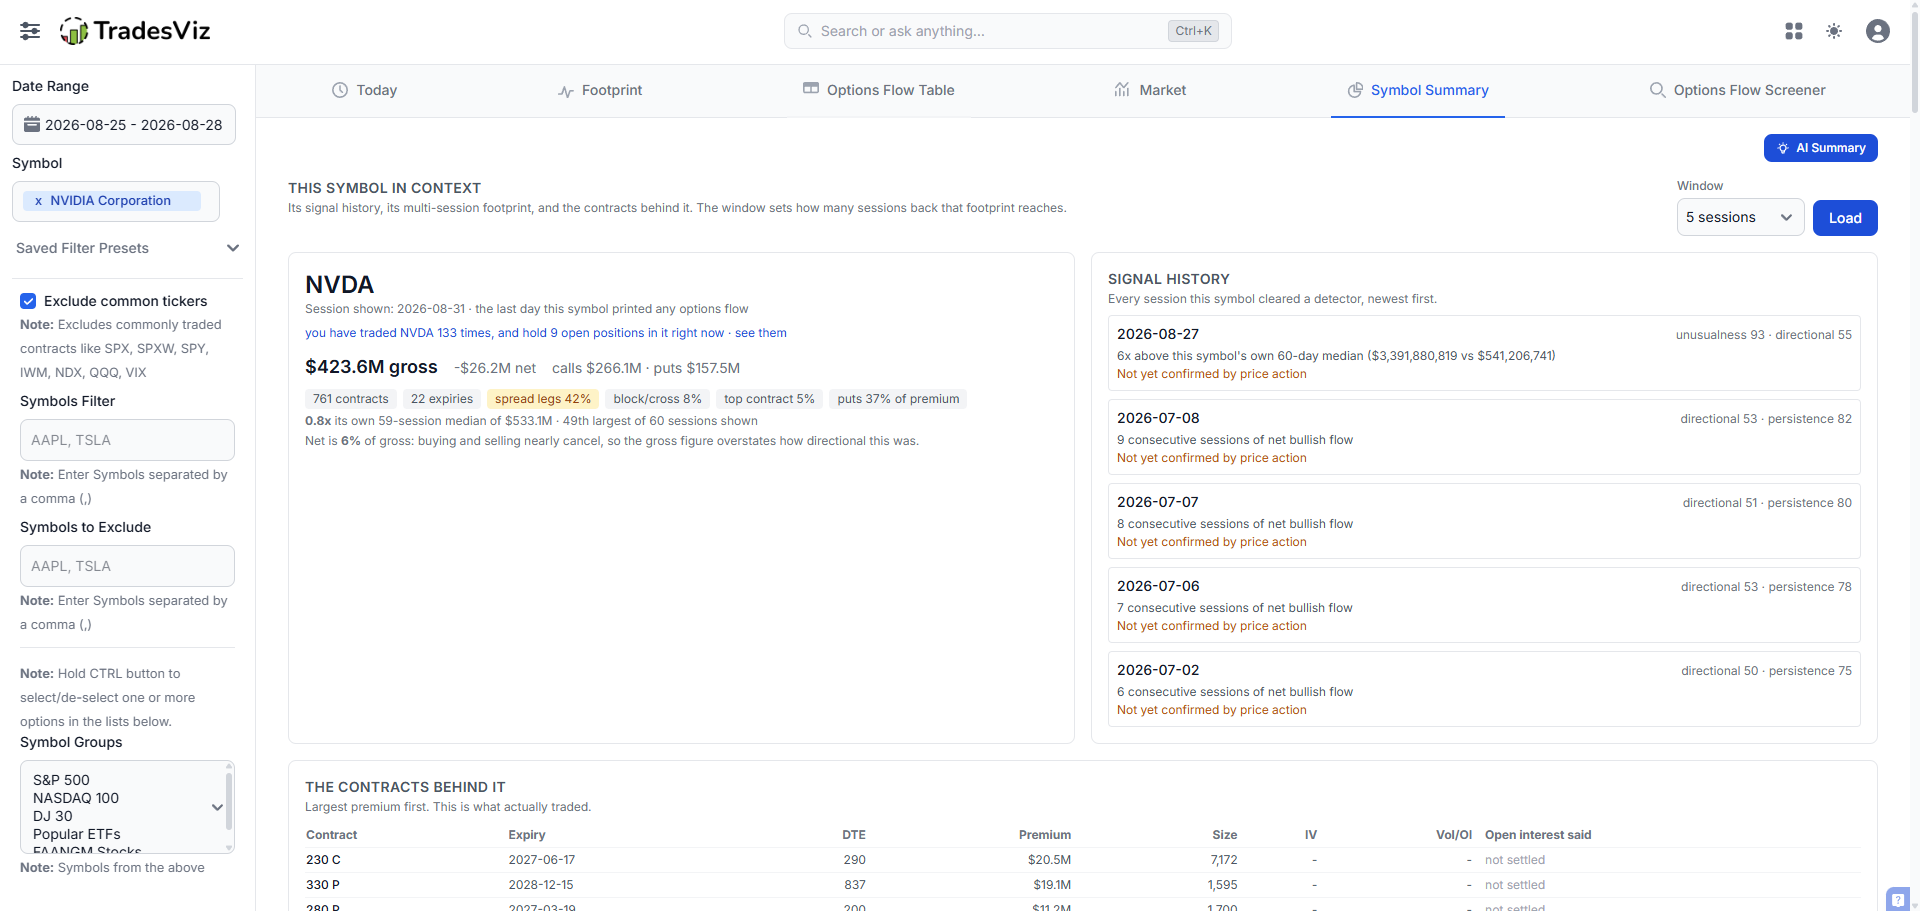
Explore the rebuilt options flow dashboard: group multi-leg orders, compare unusual activity with each symbol's own history, and inspect strike and expiry maps. Footprint research reveals patterns across sessions, while AI summaries help you read the selected data. Record your hypothesis in a trade plan, tag the trades you take, and review their results in the same journal. Daily OPRA sessions are available the following morning with Platinum.
Options flow inside your options trading journal
Give your next options trade a stronger research foundation.
Start with the market's activity, understand the contracts behind it, then document the trade you choose to take. TradesViz brings daily OPRA research together with your options analytics, strategy tools and trade plans.
Discover
Find symbols behaving unusually for themselves, then inspect the market context and multi-session patterns.
Investigate
Read grouped packages, contract maps, heatmaps and open interest to understand what actually traded.
Review
Carry your hypothesis into a plan and tag your own trades so you can measure how those decisions performed.
For your research routine: options flow is included with Platinum, with each completed US session available the following morning. The screenshots below are real historical examples from the new guide.
Discover / Activity relative to a baseline
Build a research list around unusual behavior.
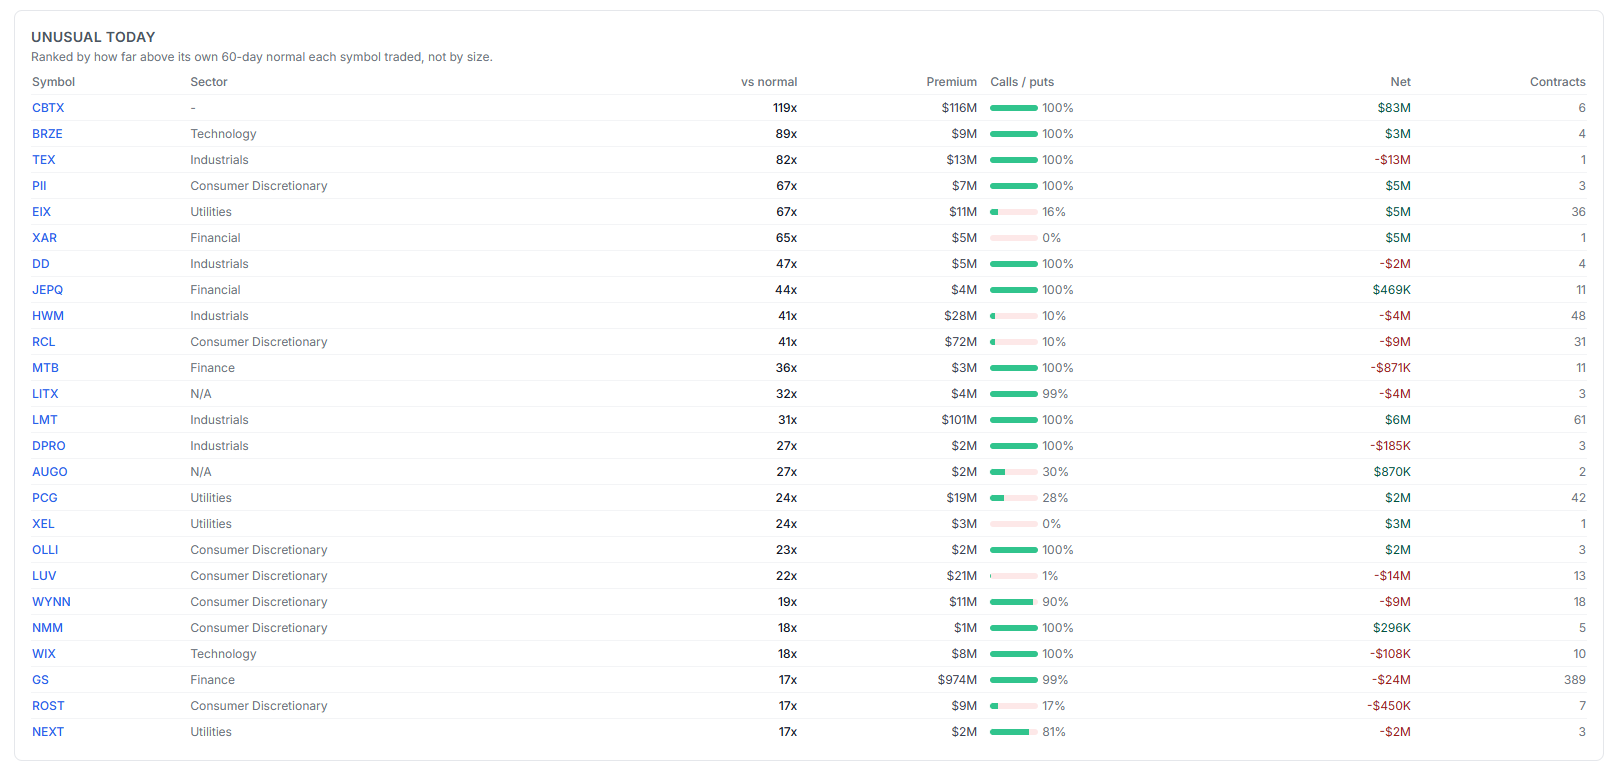
When you start with the largest premium alone, the busiest names can dominate your attention. Unusual Today ranks each symbol against its own 60-day normal, helping you find activity that is out of character for that particular name.
Read relative activity alongside net premium and contract concentration. The guide's CBTX example is 119× its normal across six contracts. GS has much more gross premium, but is 17× normal across 389 contracts. Those are different starting points for research.
- What to do: identify a symbol with an unusual baseline comparison.
- What to check next: open its Symbol Summary and review the session, signal history and contracts.
- What to record: the specific observation that made the symbol worth investigating.
Investigate / Multi-leg order structure
You trade strategies. Read the flow as a strategy, too.
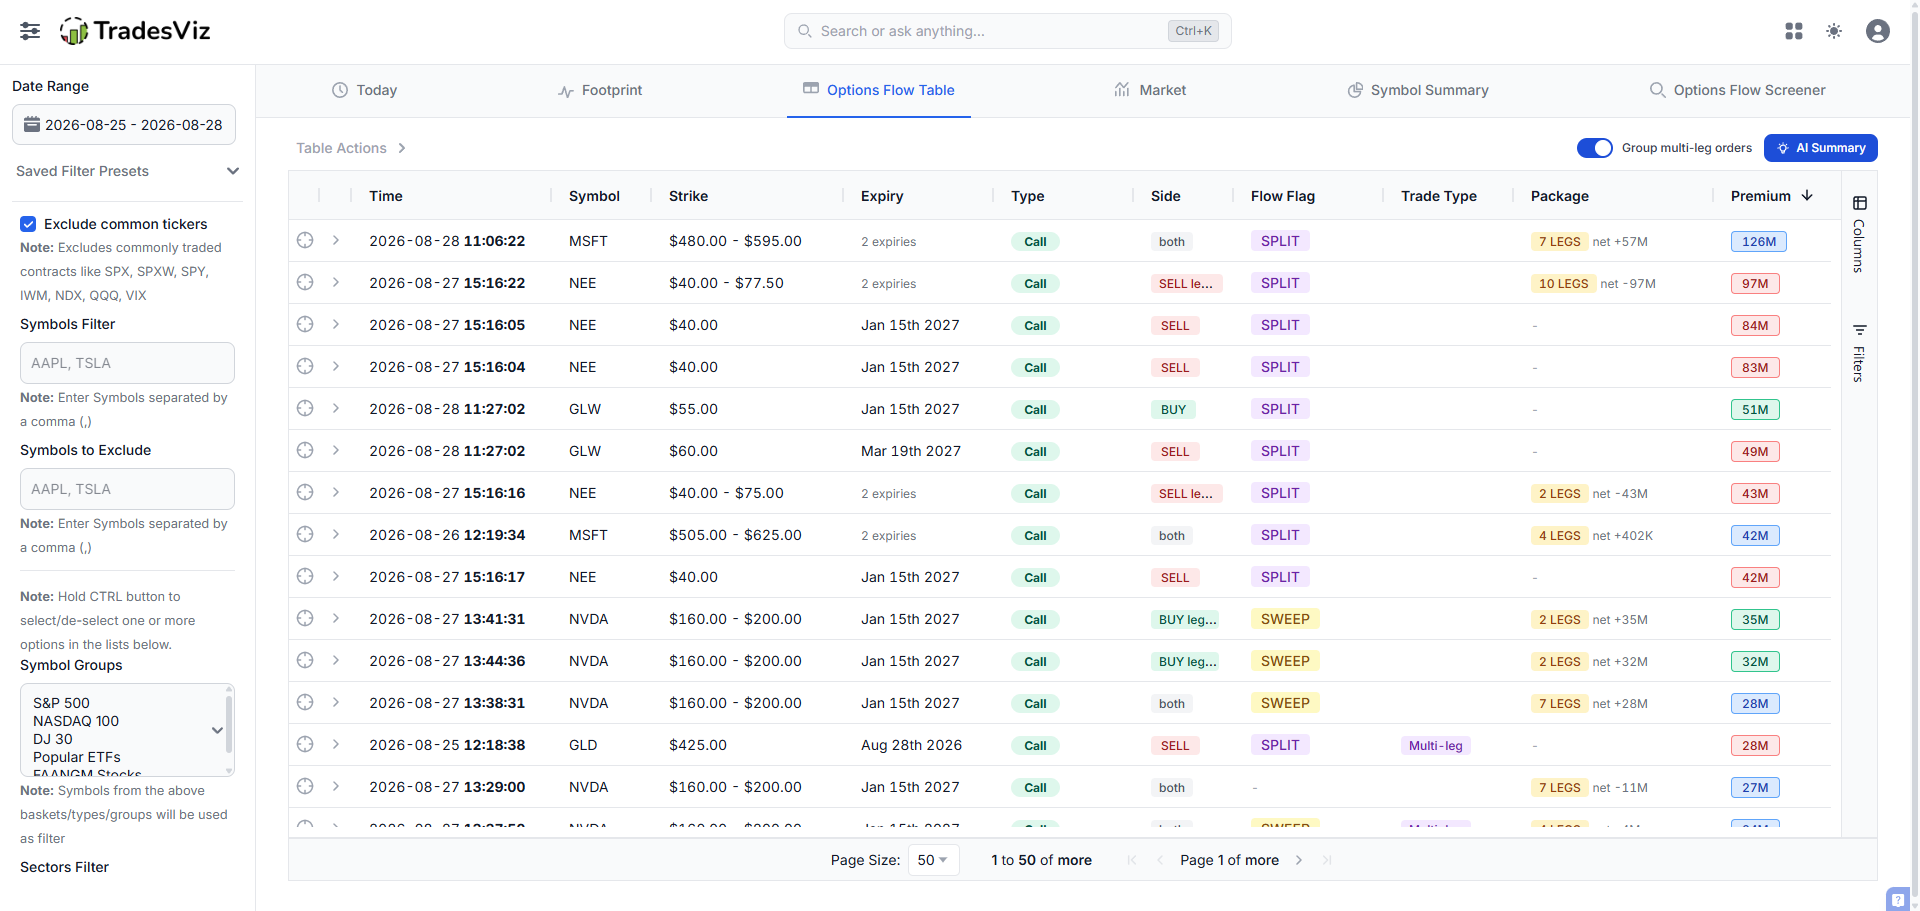
Spreads and rolls contain multiple contracts. Looking at their legs one row at a time can hide the relationship between them. Group multi-leg orders brings related legs together so you can inspect the package before forming a view.
Read the whole package
Check leg count, the strike range and the expiry range. A multi-expiry structure raises different questions from a single-contract purchase.
Compare gross with net
Gross captures premium across the legs. Signed net shows the package's cash debit or credit after buys and sells offset; it is not a maximum-risk calculation.
Plan your own position
Expand the legs, write your interpretation and use the options payoff and simulation tools to explore the strategy you intend to trade. The observed package is research context.
Investigate / Strike, expiry & premium
Go beyond the ticker to the exact contracts.
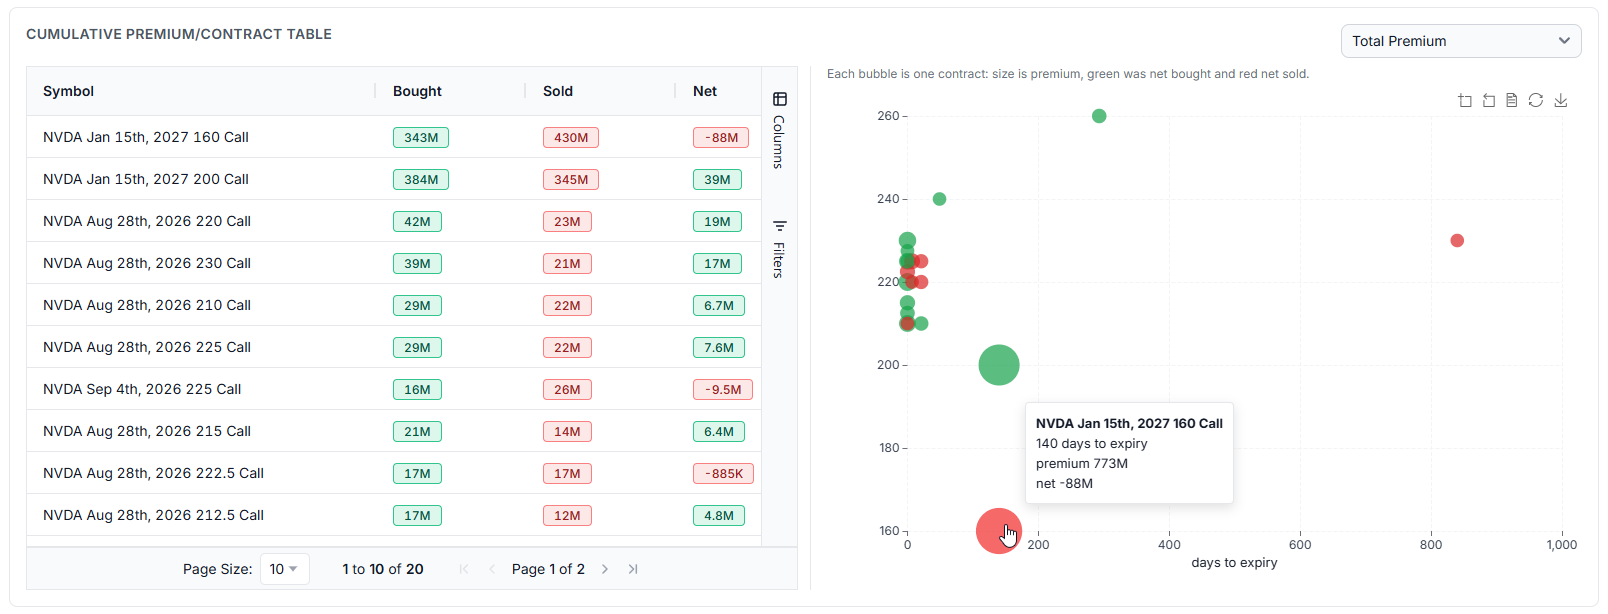
“Unusual activity in NVDA” leaves most of the options research unfinished. The contract table, bubble map and strike/expiry heatmaps let you investigate the series carrying that activity—and whether volume and premium are telling the same story.
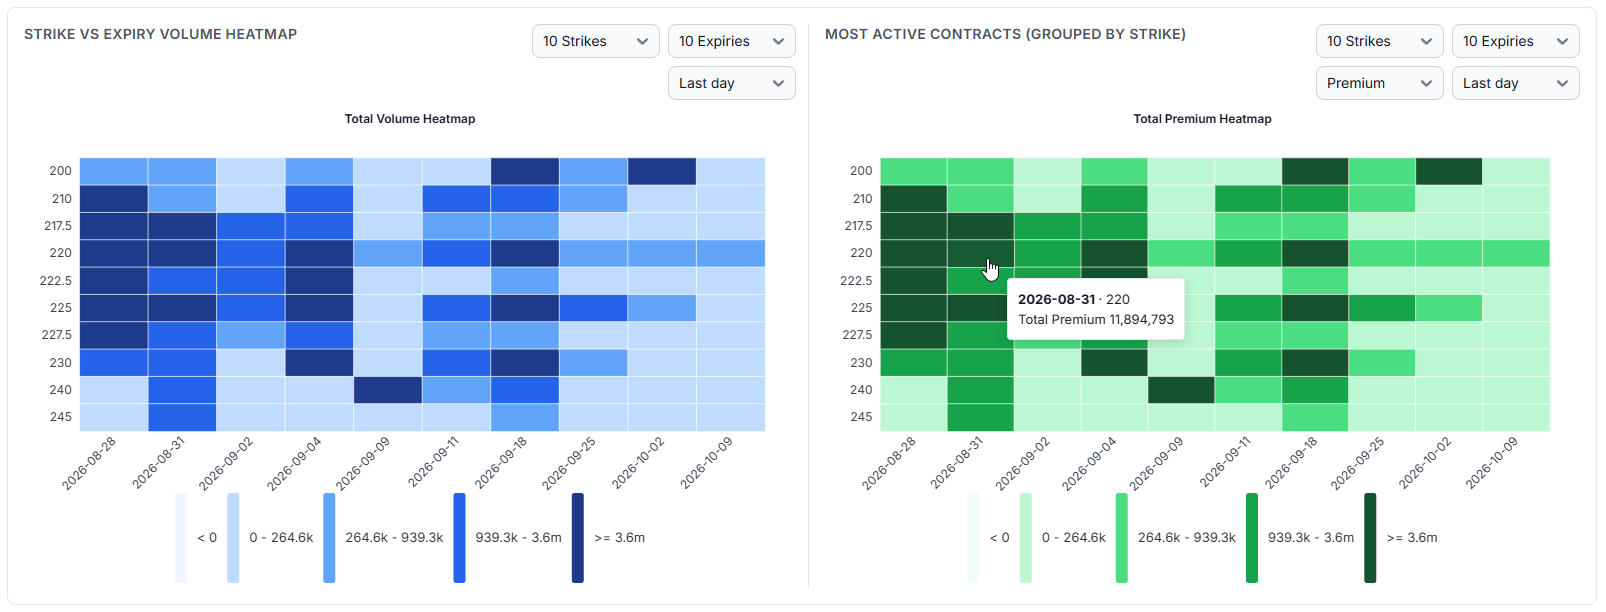
Use the heatmaps to narrow the research.
Compare volume and premium at the same strike and expiry. High contract counts can come from inexpensive options. Strong activity in both measures deserves a different reading. Quantile color bands keep the surrounding contracts visible even when one cell is enormous.
For an options trade plan: record the actual strike, expiry and structure you researched. That creates a specific decision you can revisit after the trade, instead of a vague “unusual flow” note.
Investigate / Existing positioning
Put fresh options activity beside the outstanding book.
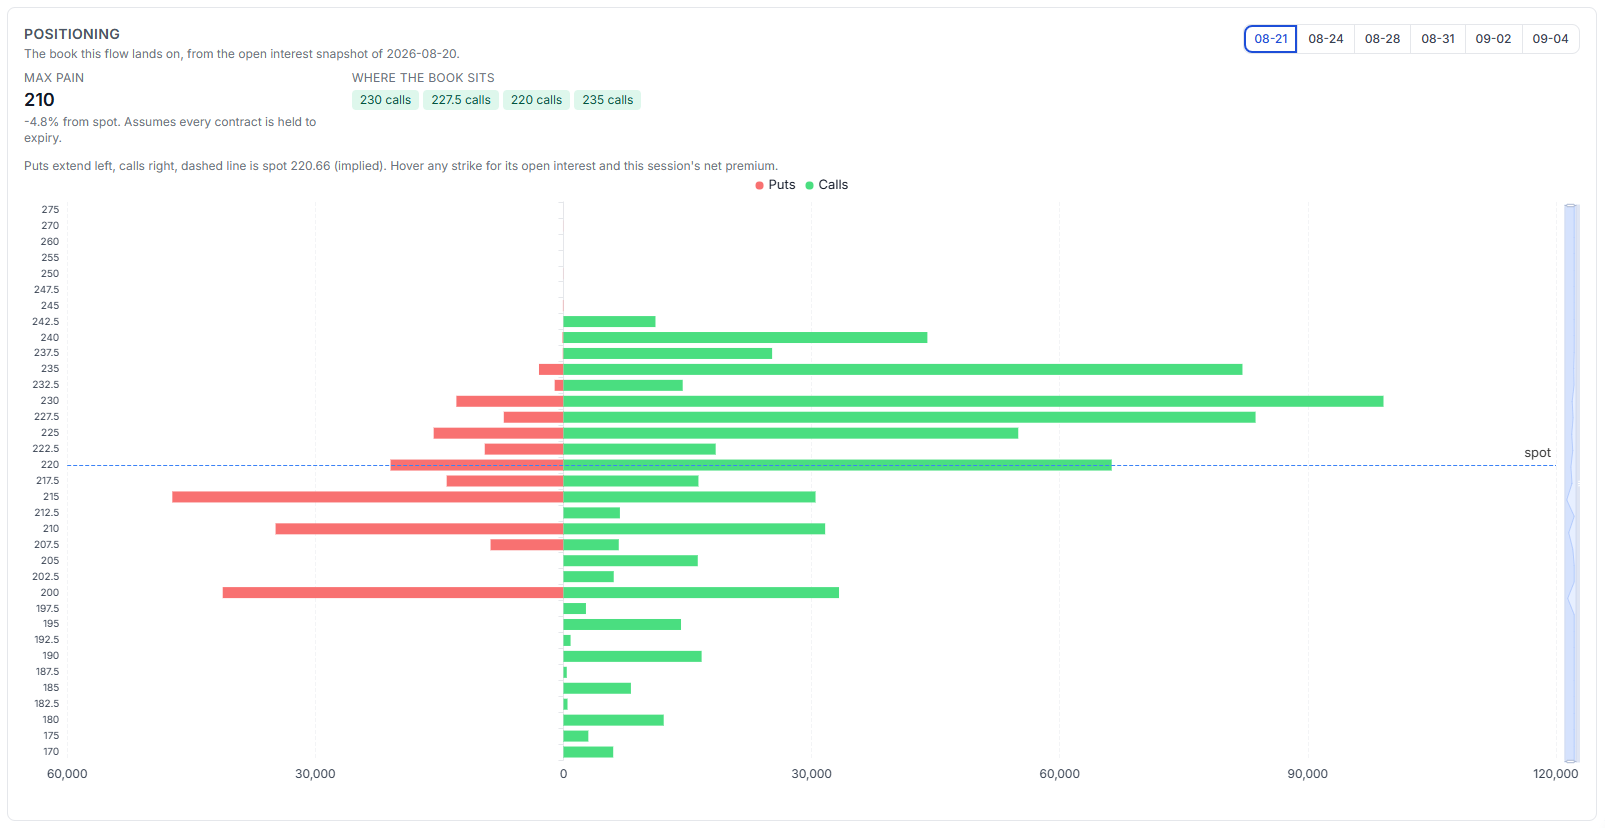
The positioning map adds open interest by strike for the selected expiry. Puts extend left, calls right, and the spot reference places the book around the underlying price.
Select an expiry, check the snapshot date and inspect the strikes nearest your proposed position. This adds context that traded premium alone cannot provide.
- Flow: what traded in the selected period.
- Open interest: contracts outstanding in the displayed settlement snapshot.
- Your plan: the reason those observations matter for the strategy and timeframe you chose.
The displayed max-pain measure describes the selected book under its stated assumption. It is not a substitute for defining risk in your own position.
Follow through / Multi-session Footprint
Was it one oversized event or a pattern worth following?
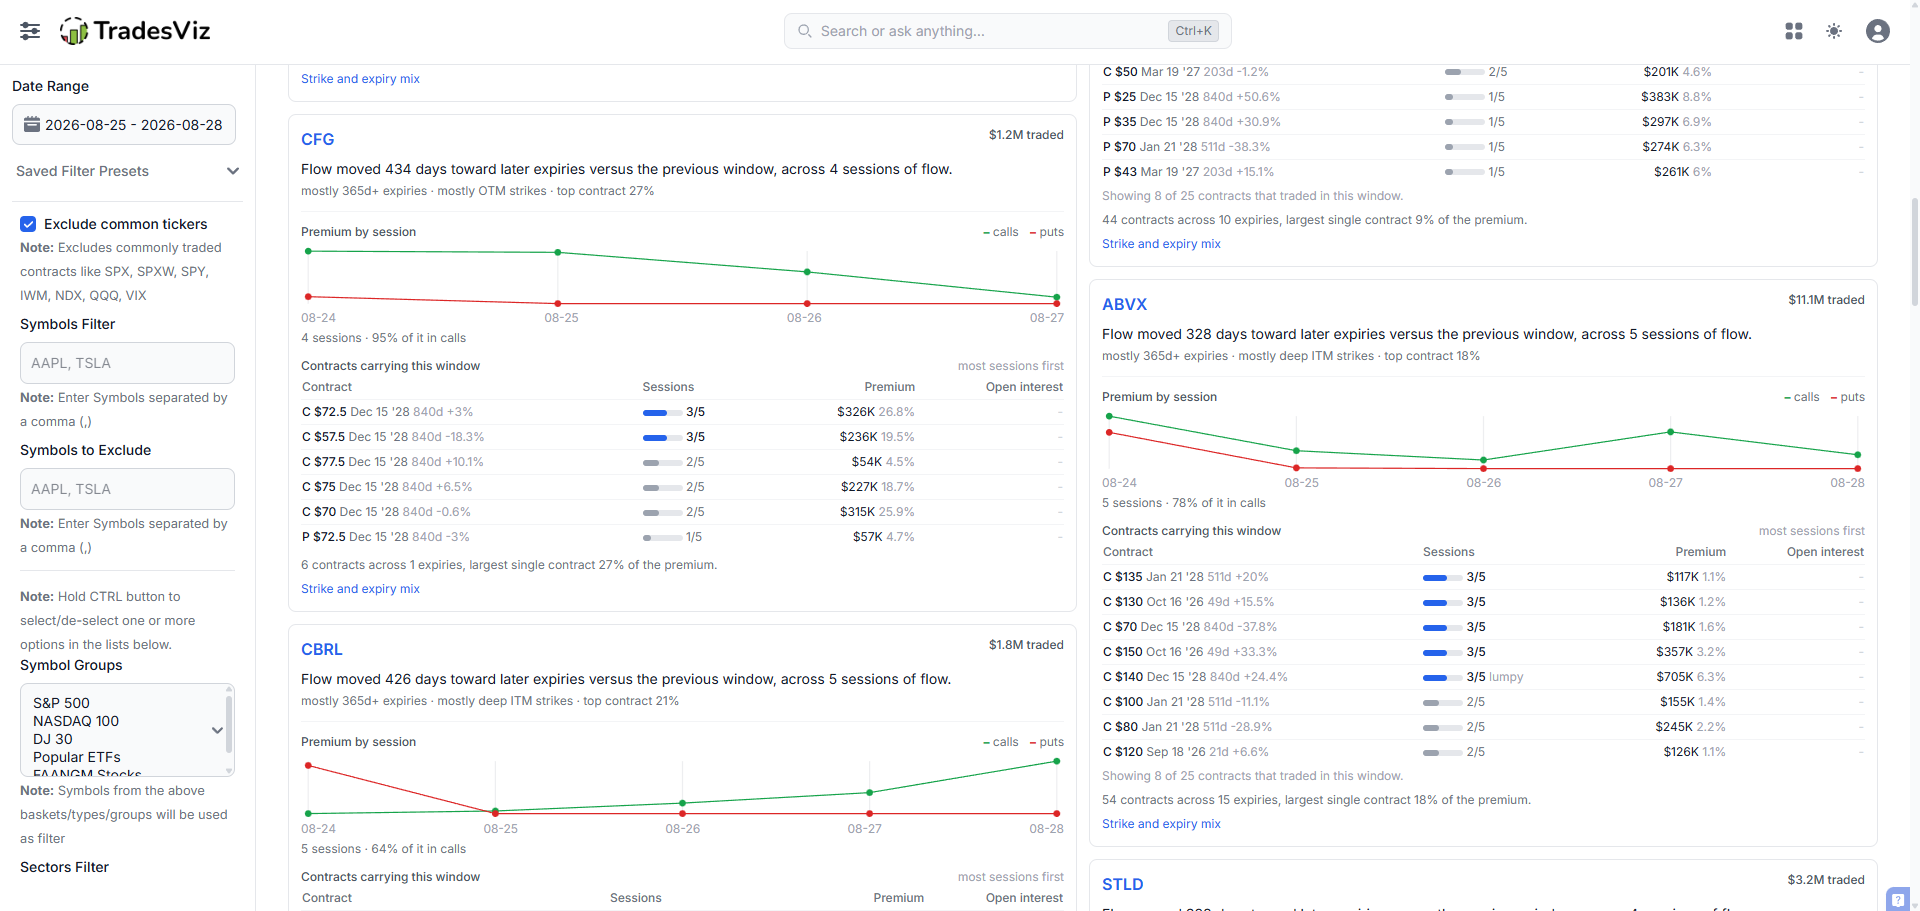
Footprint organizes activity across sessions by behavior, including expiry rotation, contract concentration and open-interest support where available. Each symbol opens into the contracts carrying that window and how many sessions each appeared in.
Inspect repetition
Compare the number of sessions in which a contract appeared with its share of premium. A large total spread across several days differs from one isolated print.
Watch the time horizon
Use the nearer- and later-expiry rotation presets to investigate shifts in where activity is concentrated, then verify the actual strike/expiry combinations.
Revisit the thesis
Add what changed to your notes. Open-interest verdicts depend on supported analysis windows; use the availability message to understand an empty result.
Research assistance / Filters & AI
Spend less time scanning rows. Spend more time checking the idea.
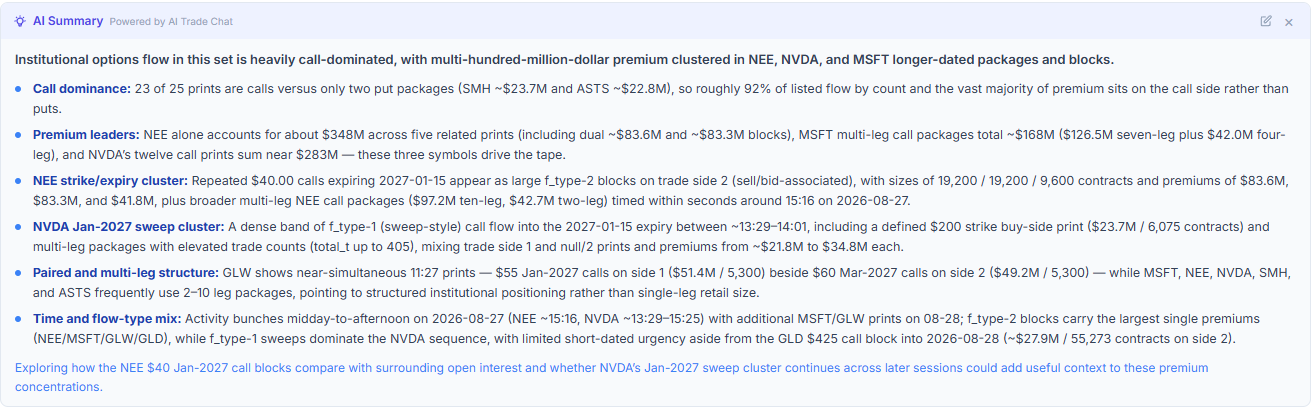
Filter the dashboard to your symbols, sectors, premium ranges, contract characteristics and execution criteria. Save that setup as a preset. On the flow table, AI Summary describes the rows you are actually viewing with those filters applied.
Make the input relevant
Choose your universe and contract filters first. Custom sweep and split criteria let you control how those executions are defined.
Inspect the evidence
Use the summary's premium leaders, timestamps and contract clusters to direct your next checks in the flow table and Symbol Summary.
Write your conclusion
Document what you inferred and what would invalidate it in your trade plan. Your journal can then preserve the reasoning alongside the result.
Why the combined platform matters
Your research should still be useful after the trade is closed.
A standalone feed can help you find activity. A journal focused only on completed trades can show results. TradesViz connects market research, options strategy tools and personal performance review in one platform.
| Stage | When research and review are separate | With TradesViz |
|---|---|---|
| Finding the idea | You start with a feed and carry the ticker into your other tools. | Market and Footprint research sit in the same platform as your options journal. |
| Understanding the structure | You reconstruct what the individual prints might represent. | Grouped orders, contract maps, heatmaps and positioning give you several ways to inspect the evidence. |
| Planning your own trade | Your research note, strategy model and risk assumptions can become disconnected. | Use trade plans alongside payoff charts and options simulation to document and explore your proposed position. |
| Reviewing the outcome | The feed's activity and your realized results are separate records. | Tag your flow-related trades and filter your journal to compare their win rate and expectancy. |
Make the research specific enough to review.
A useful trade-plan note separates what the data showed from what you inferred. Here is a reusable structure for your own reasoning; it does not require copying someone else's trade.
- Observation
- Record the symbol, session, baseline comparison, grouped legs and the contracts that carried the activity.
- Interpretation
- Explain why that structure is relevant to the strategy and timeframe you are considering.
- Invalidation
- Define the price behavior, time limit or later evidence that would make you reconsider the idea.
- Journal tag
- Use a consistent label such as
flow:unusualorflow:sweep-clusteron the trades taken for that reason. - Review
- Filter those trades in your journal, examine win rate and expectancy, and check whether the original reasoning held up.
Trades table with multiple options specific stats
TradesViz trading journal has the most extensive data per trade among all trading journals - not by a small margin, but we're talking about multiple times the amount of data from ALL other journals put together. For all your options trades, get detailed cost basis, greeks, last EOD price, Exit Insights, and even best exit analysis!

Options payoff/risk simulation charts
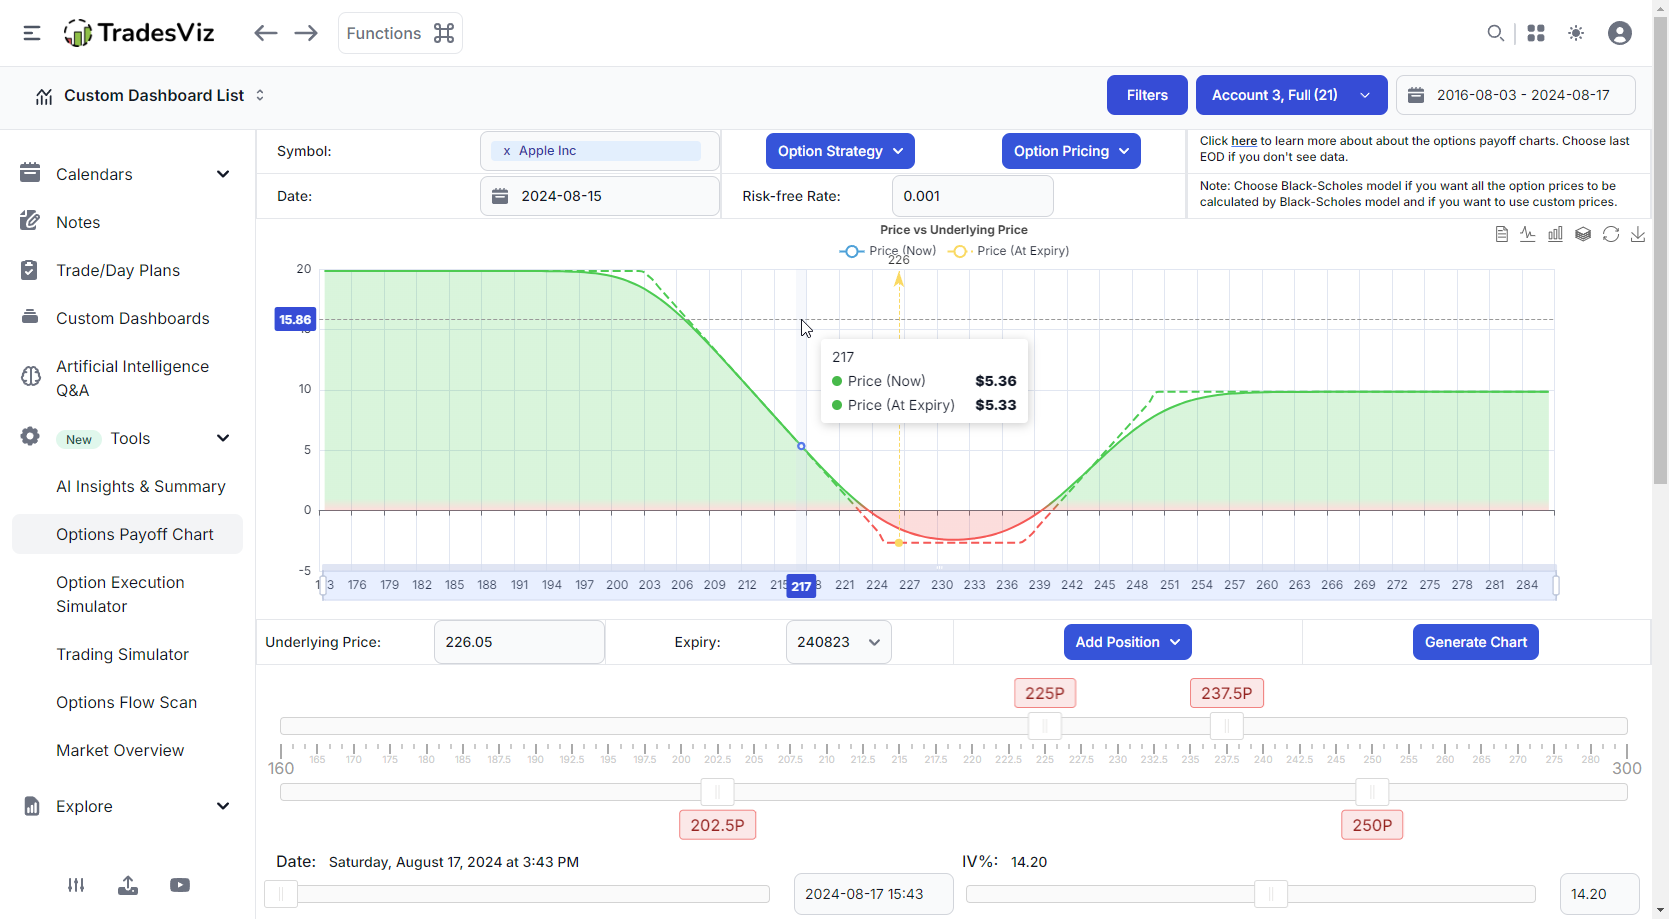
That's where TradesViz can not only help you journal and analyze trades, but also to plan your trades. With our newest options feature - the options payoff charts, visualize complex strategies for any US/IN optionable symbol and see how the risk/reward curves change as you tweak the parameters.
Options execution backtester
Would have. Could have. Just how many times have you said this to yourself when you missed a big options trade opportunity because you were unsure? Don't be unsure anymore - practice options execution placement with the options backtester and learn exactly how your pnl changes every minute.
Intraday options chain trading simulator
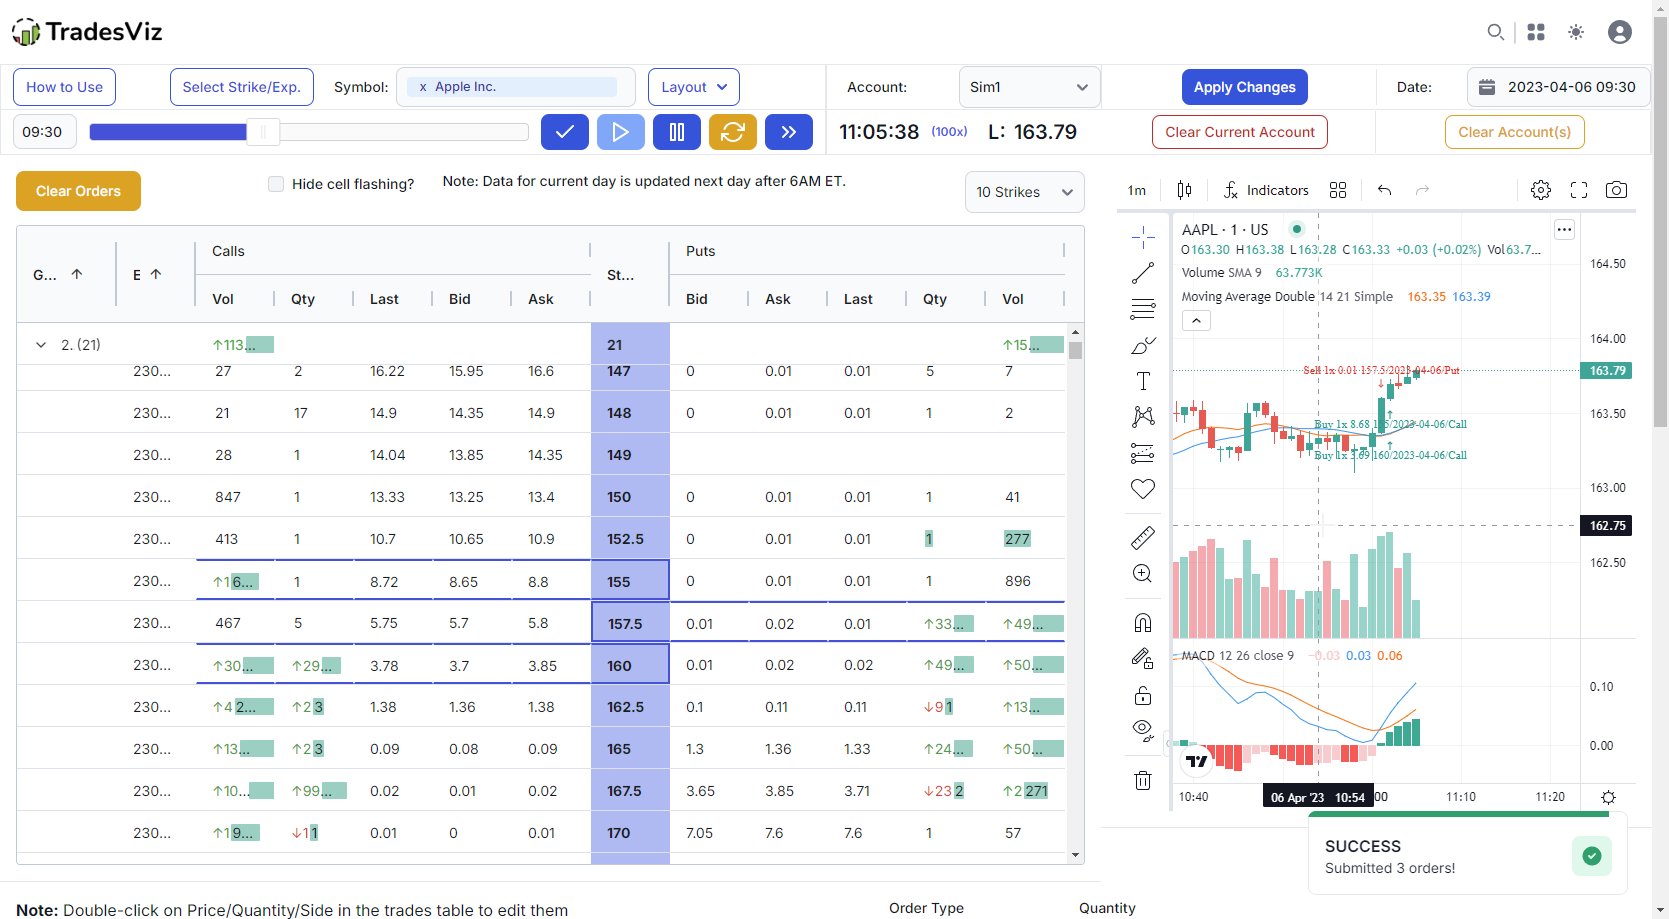
One of the most unique features among any FinTech online - a full fledged online options simulator where you have a live ticking options chain + a chart for any US optionable symbol. There is no better way to learn to trade options and observe price action than using TradesViz's option simulator.
Intraday options OHLC charts
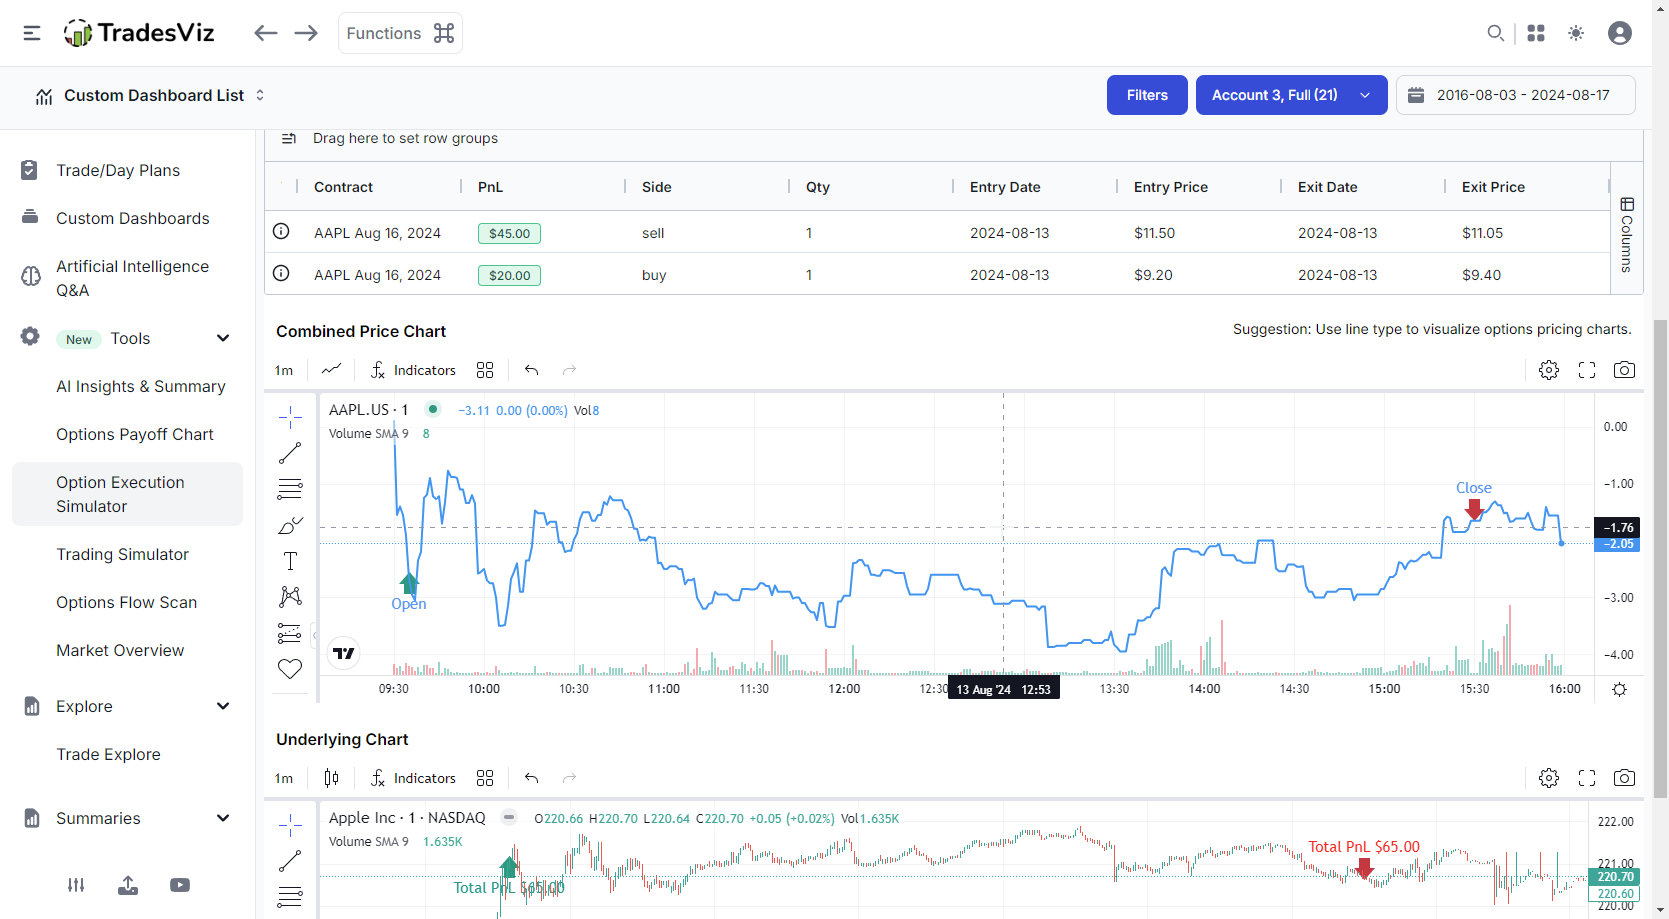
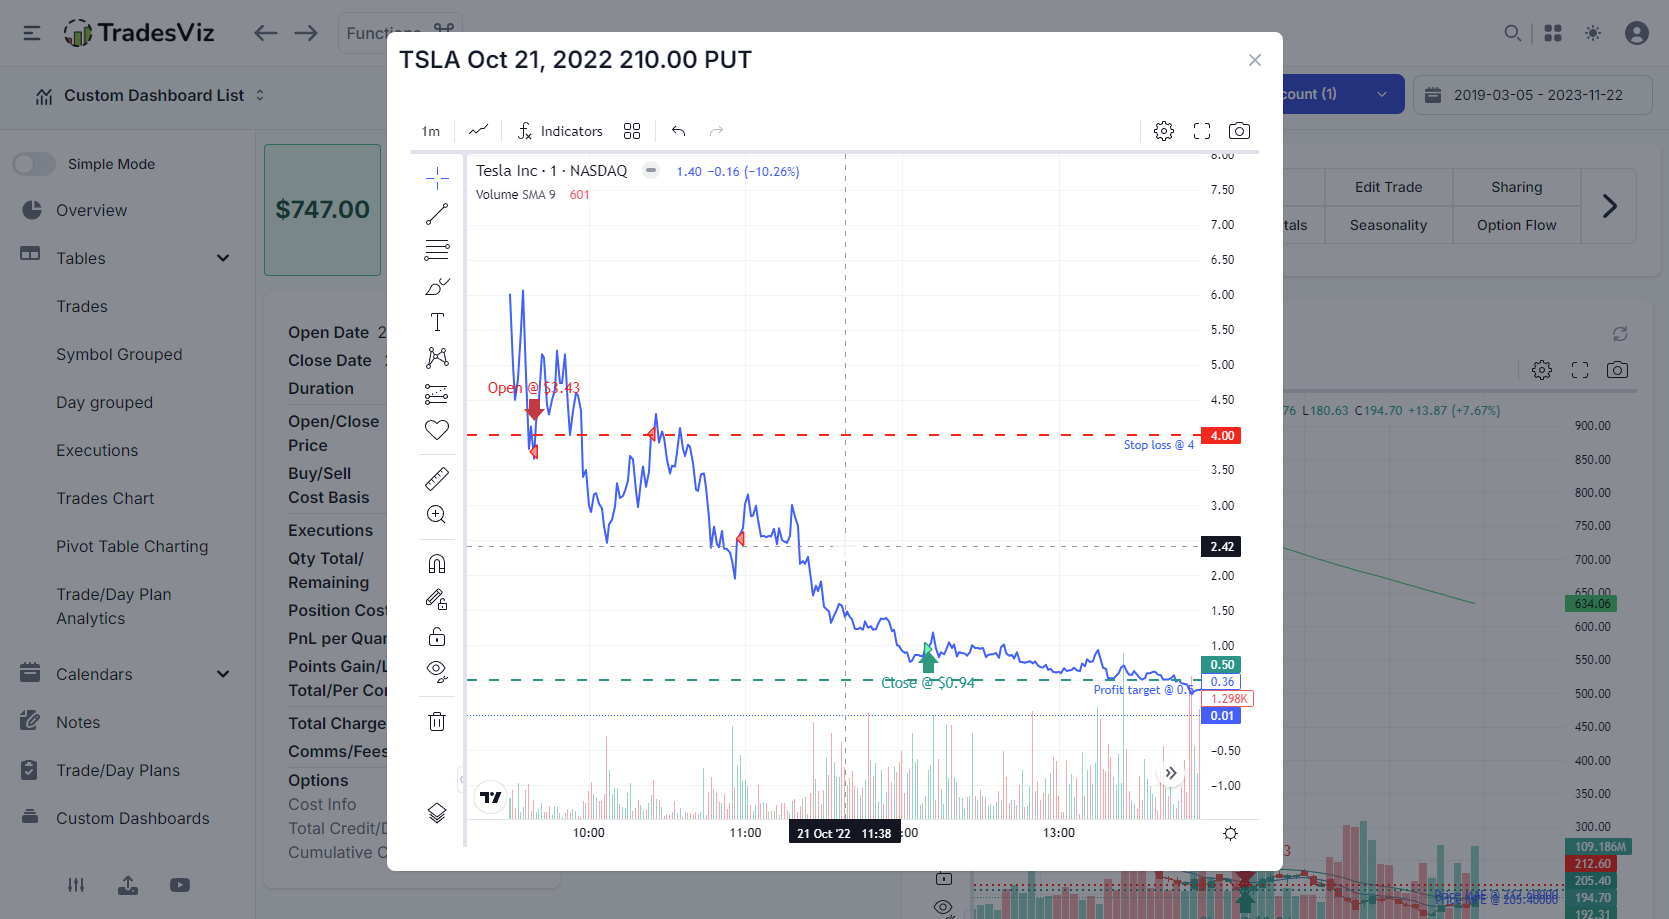
OHLC charts for underlying have existed for a long time, but what about options? TradesViz is the first online trading journal to release intraday options OHLC charts - even at the 5-sec timeframe interval for ALL US and India options! View every individual option leg's price changes clearly!
Options strategy backtester
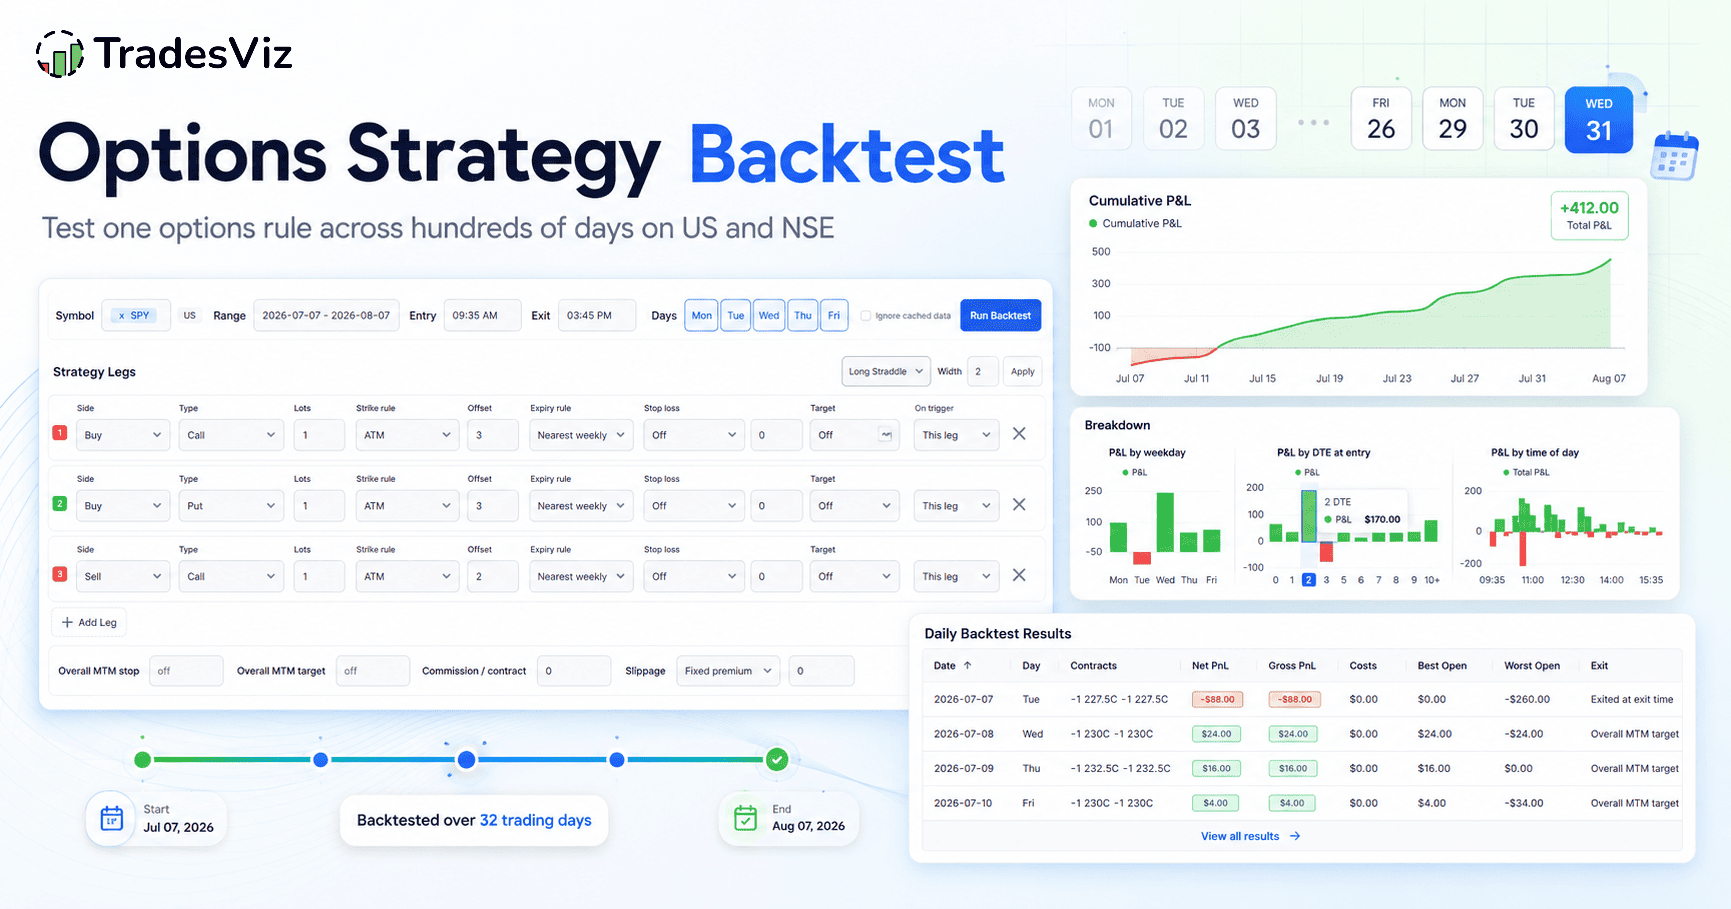
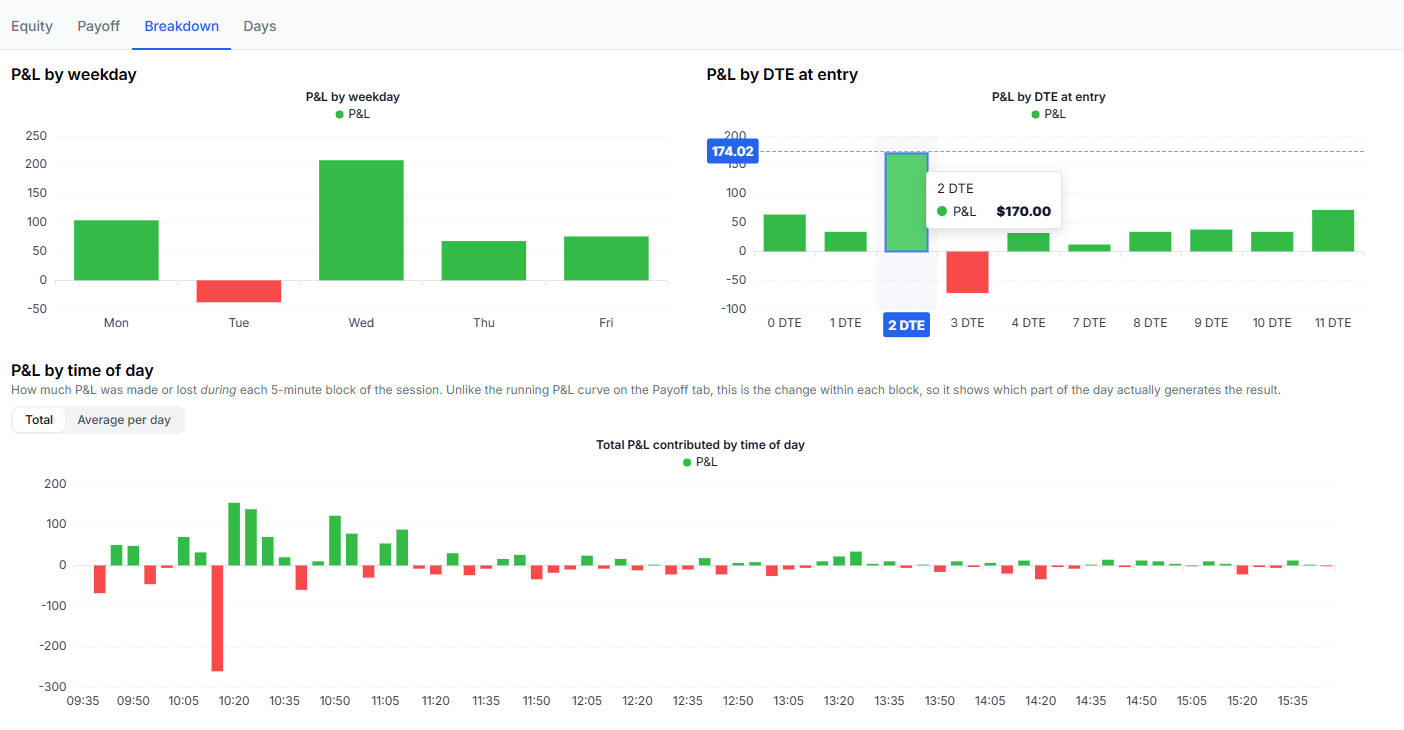
Every other options tool works on one date. This one takes a single rule and runs it across hundreds of trading days, then gives you the win rate, drawdown, expectancy, streaks and equity curve for the whole sample. It works on both US and NSE options, which makes it the only tool covering both markets in one place.
Describe the rule, not the contract
"Sell the NIFTY 24500 call expiring 12 June" is fine for one trade and useless as a rule. Repeat it for six months and you are testing one stale strike. So instead of naming a strike you describe how to pick one: ATM, ATM +/- N strikes, +/- N%, or +/- N points, with an expiry rule of nearest weekly, nearest monthly, 0DTE, 1DTE or a target DTE.
Every morning we look at where the market actually opened, apply your description, and pick whichever contract was genuinely listed that day. Up to 8 legs, or start from a template: short straddle, short strangle, long straddle, long strangle, iron condor, iron fly, call vertical and put vertical, with one Width box that resizes the whole structure.

Statistics that need a sample
Total net P&L, win rate, max drawdown with recovery time, expectancy, profit factor, best and worst day, longest win and loss streaks, and gross vs net after costs. None of these mean anything on a single date.
Realized payoff, not theory
Every day's actual P&L plotted against how far the underlying moved, built from real fills so decay and volatility are already baked in. Plus average running P&L through the session, which tells you when your strategy actually makes its money.
Honest by default
Commission and slippage on both sides, stop before target when a bar crosses both, and days with missing leg data excluded and counted rather than quietly treated as flat.
Stops at two levels
Per-leg stop loss and target in percent of entry premium or premium points, with a choice of closing just that leg or all of them. Plus max daily loss and daily profit target on the whole position.
Iterating is free
Option prices are cached per day. Changing stops, targets, costs or exit times refetches nothing at all, so trying five variations takes seconds rather than another full run.
Straight into your journal
Push the run into a trading account and each day becomes its own trade with full entry and exit executions per leg, respecting whatever the Days table is filtered to. Costs carry across, so imported P&L matches the net figure.
Options Command Center: Your Complete Portfolio Dashboard
The most comprehensive options portfolio dashboard available in any online trading journal. Track Greeks, manage strategies, visualize risk, review wheel strategy cost basis, reconcile month-by-month cashflow, and analyze option premium in one unified view.
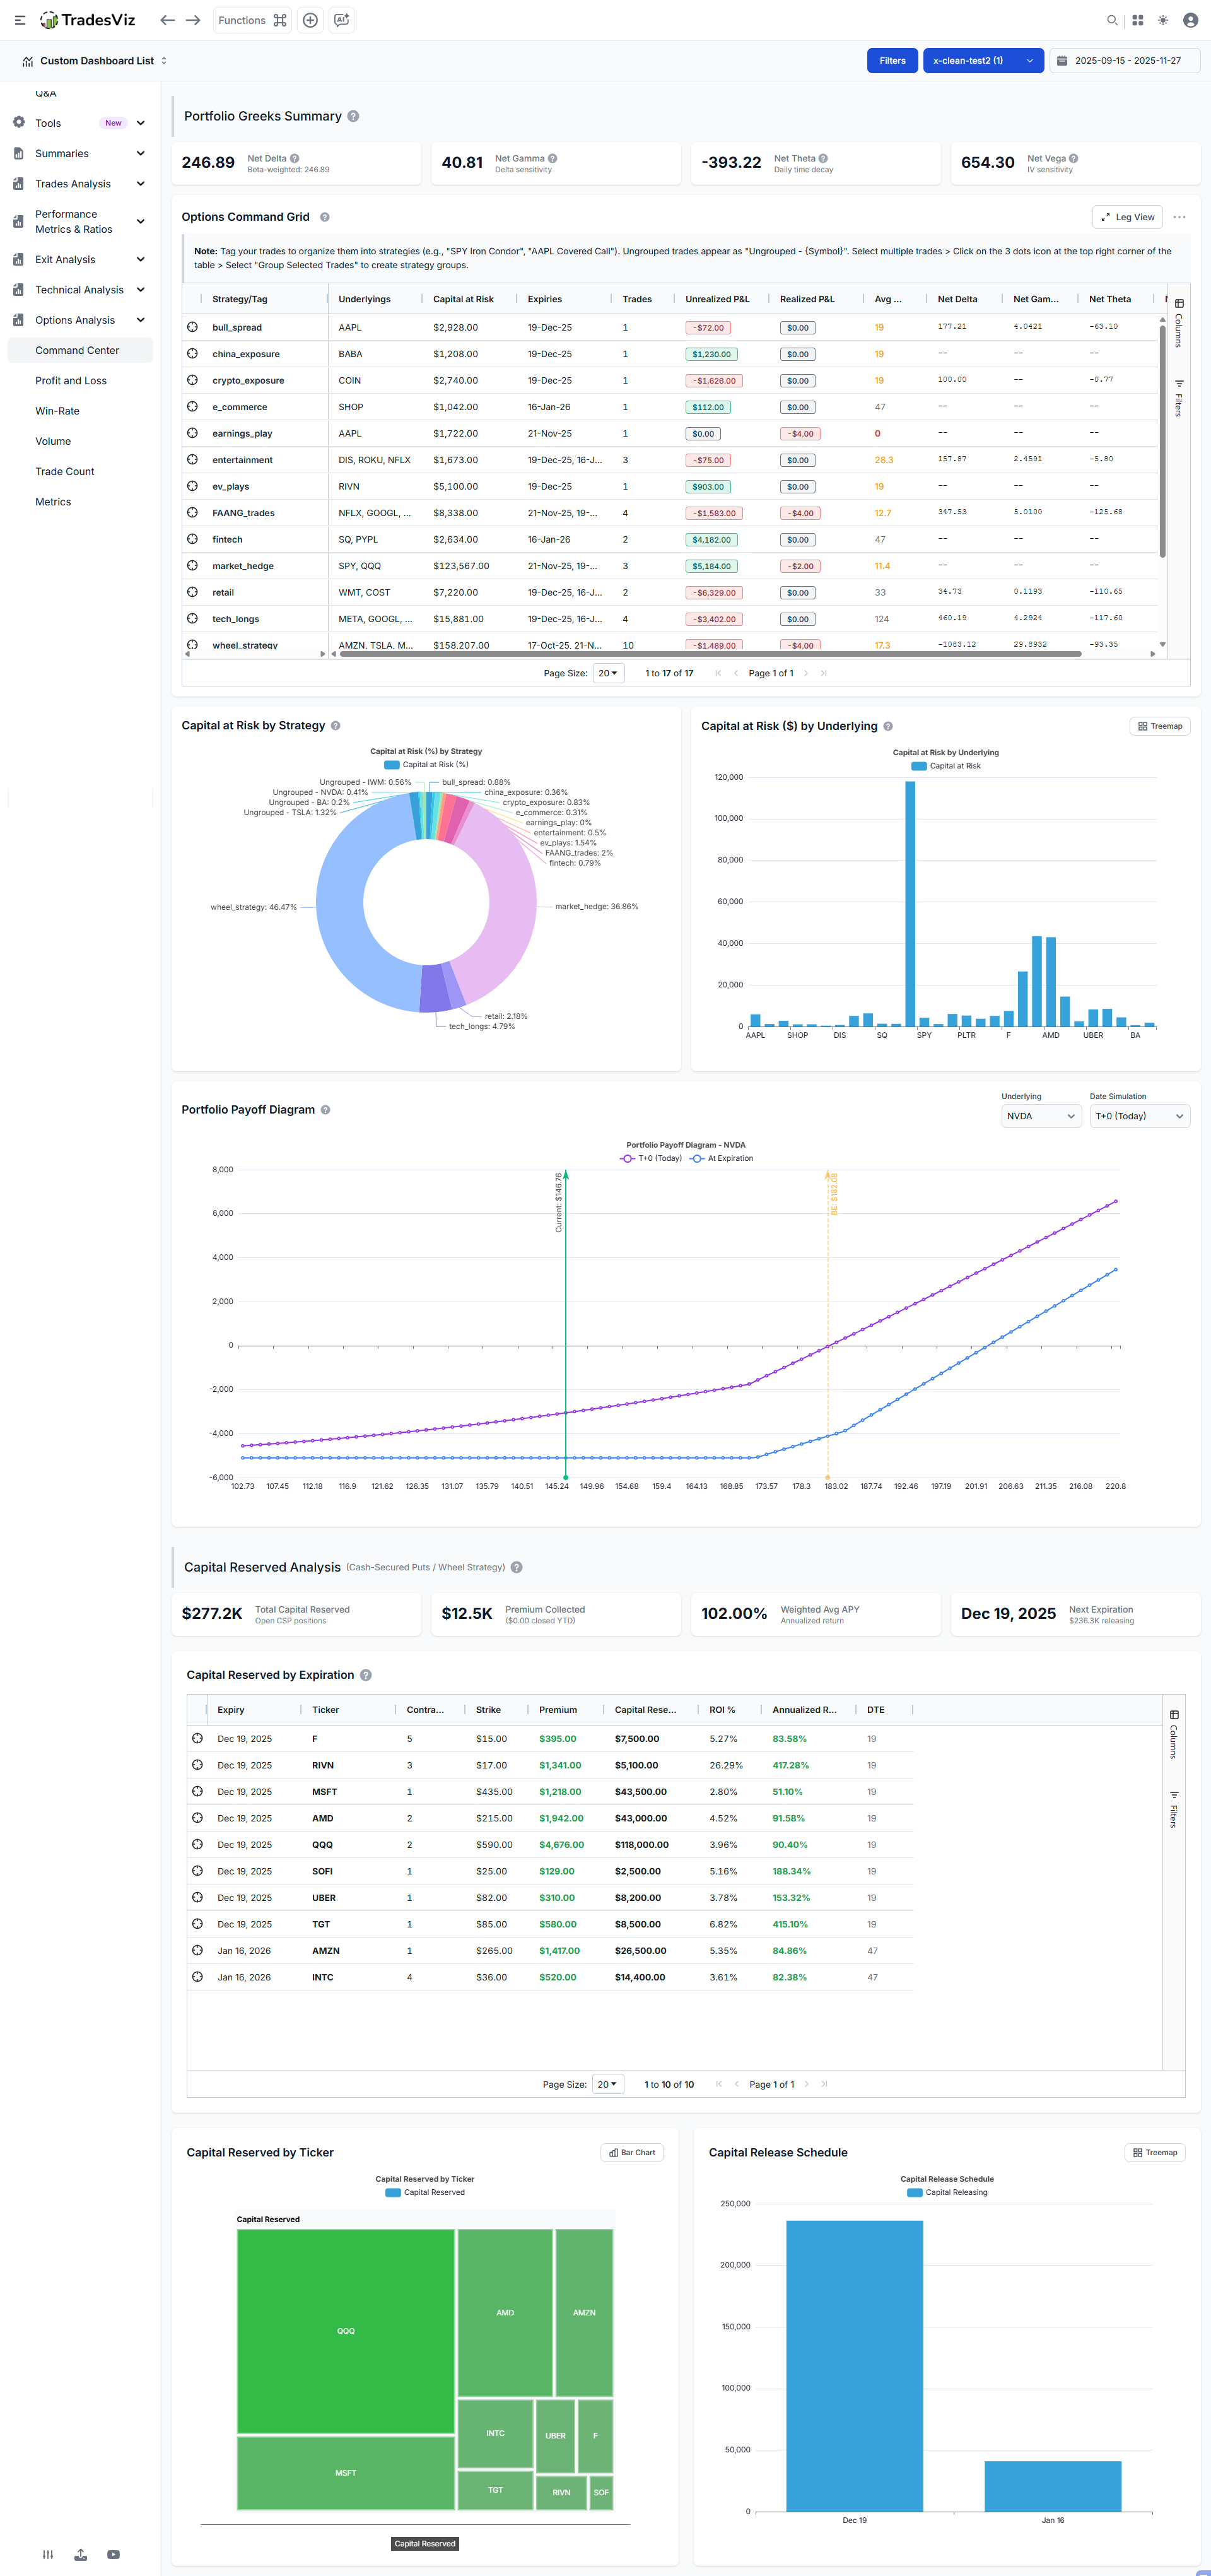
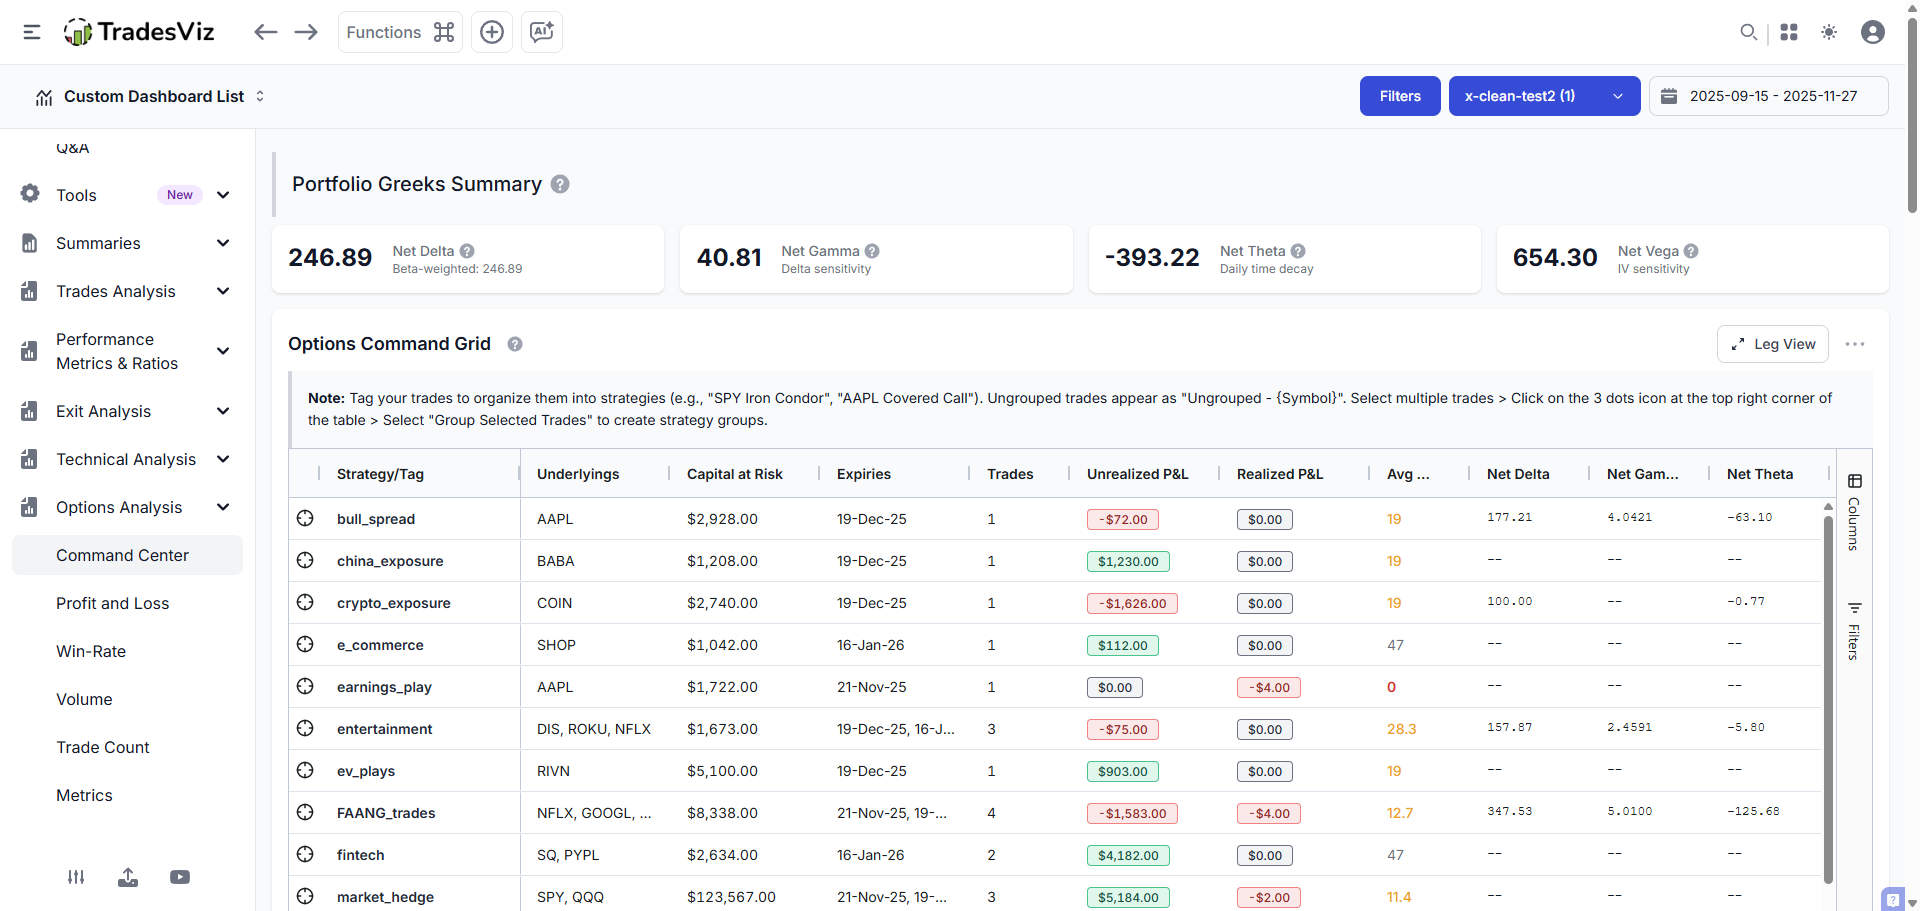
Net Greeks Summary
View aggregated Delta, Gamma, Theta, and Vega across your entire portfolio. Know your directional exposure, time decay, and volatility sensitivity at a glance.
Strategy Command Grid
Strategy-level view with grouping, drill-down to individual legs, P&L color coding, and DTE warnings. Never miss an expiring position again.
Capital at Risk Charts
Visual breakdown of your capital allocation by strategy and underlying. Identify concentration risk and manage your true dollar exposure.
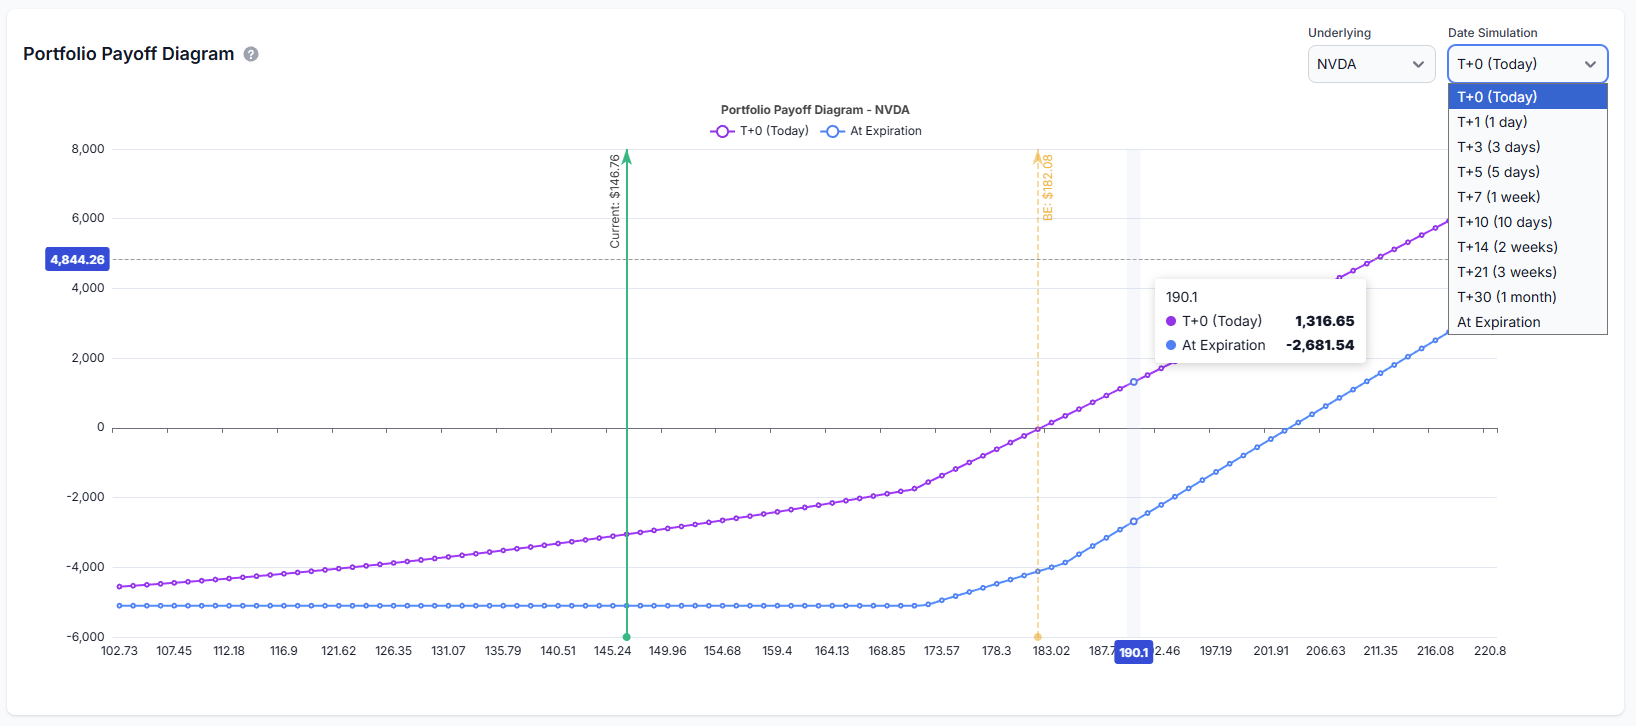
Portfolio Payoff Diagram
Interactive T+0 and expiration payoff curves for any underlying. See exactly how theta decay reshapes your risk profile as time passes.
Cash-Secured Put Analytics
Dedicated CSP analysis with ROI, APY calculations, and capital release scheduling. Perfect for wheel strategy traders.
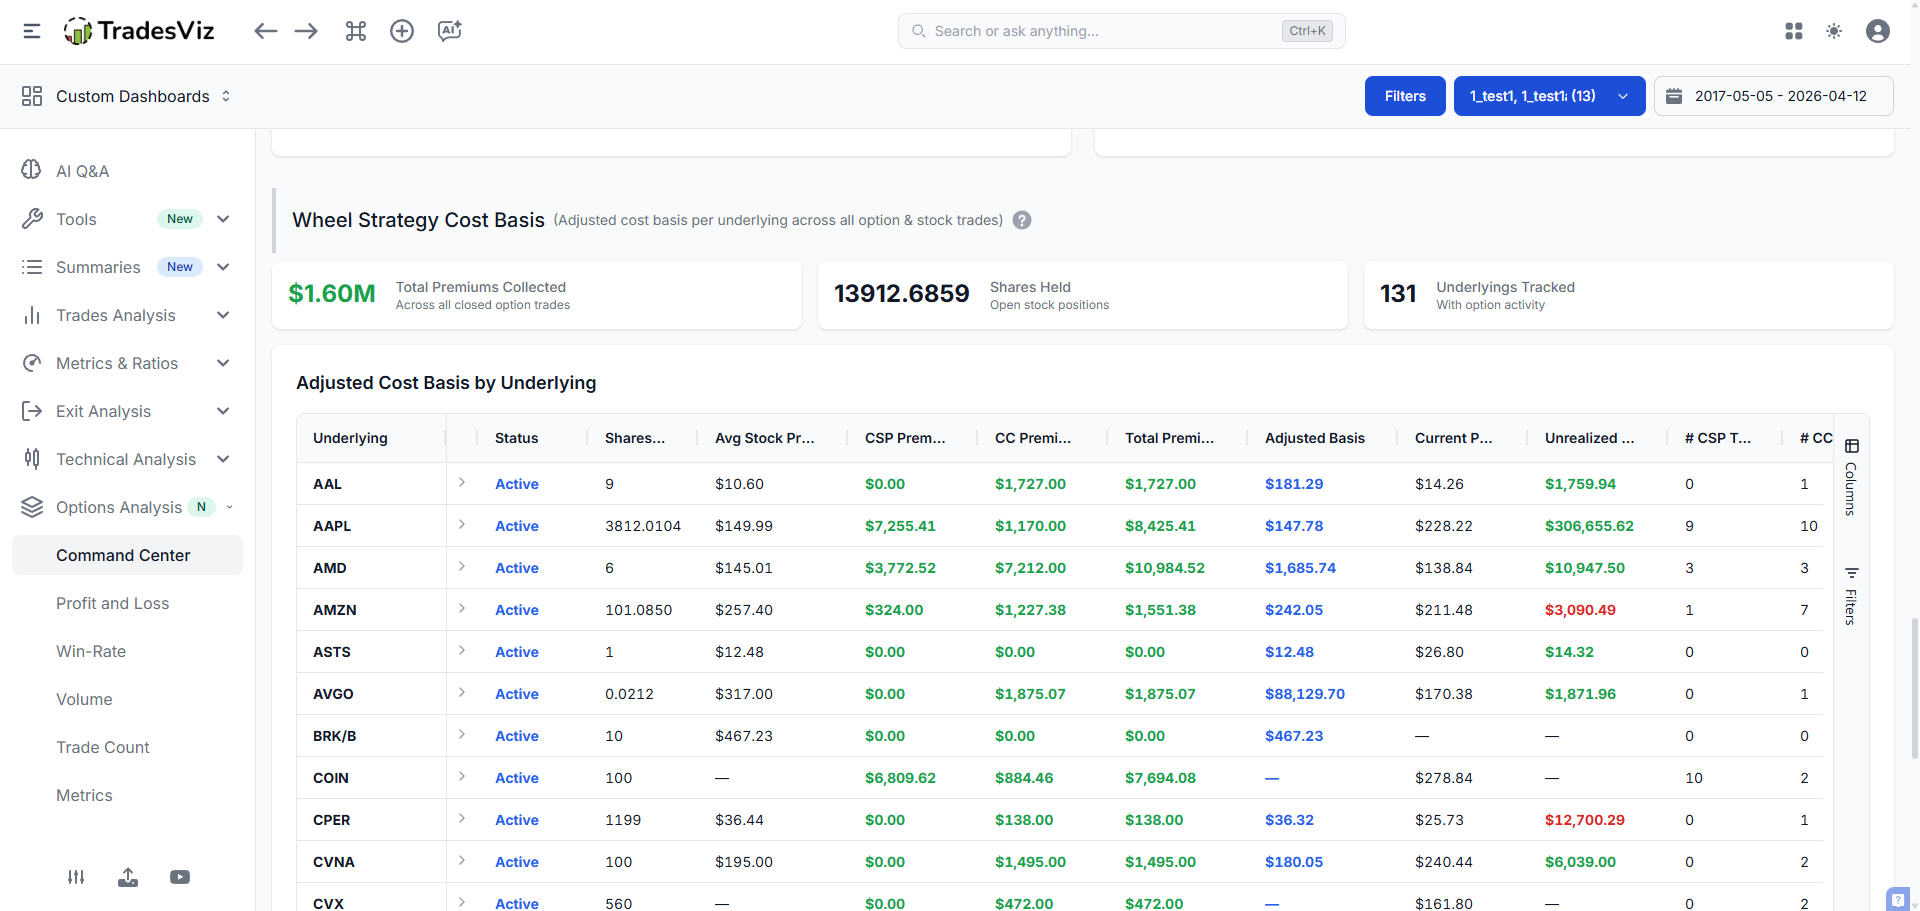
Wheel Strategy Cost Basis
Track short put premium, covered call premium, shares held, realized stock P&L, and premium-adjusted cost basis by underlying.
Options Premium Timeline
Compare collected premium, realized premium P&L, and outstanding premium in daily or cumulative mode across multiple time ranges.
Strategy Grouping
Seamless integration with TradesViz's tagging system. Organize iron condors, spreads, wheels, and any custom strategy automatically.
Monthly + Strategy Summary
Two tables that replace two spreadsheets. A month-by-month cashflow rollup splitting stocks realized, long options realized, short option premium, spread/condor cashflow and account credits into one total P&L, plus a strategy risk snapshot with realized vs unrealized, max profit, max loss, breakevens and average DTE.
Automatically sync your trades from the best platforms in the world
TradesViz is the most integrated trading journal in the world for broker/platform connectivity, with 70+ auto-sync connections.








Options Trading Journal FAQ
What is the best options trading journal?
TradesViz is the world's best options trading journal with dedicated features for options traders including options greeks analysis (Delta, Theta, Gamma, Rho, IV), options chain simulator, spread tracking, and options flow data, features not available anywhere else.
Can TradesViz track options spreads and multi-leg strategies?
Yes, TradesViz automatically recognizes and tracks multi-leg options spreads and strategies. Spreads are auto-tagged and you can analyze performance by strategy type, including iron condors, verticals, straddles, and more.
Does TradesViz provide options greeks analysis?
Yes, TradesViz automatically generates options greeks (Delta, Theta, Gamma, Rho, Implied Volatility) for your trades and provides statistics and charts to analyze how greeks impact your performance.
What is the options chain simulator?
TradesViz offers the world's first and only online options chain simulator, allowing you to practice options trading with historical data, test strategies, and see how options prices moved in real market conditions.
Can I access options flow data on TradesViz?
Yes. TradesViz Platinum includes daily OPRA options flow with grouped multi-leg orders, unusual activity measured against each symbol's history, contract maps, multi-session Footprint research and AI summaries. Each session is available the following morning. Connect your research to trade plans and tags, then review the results in your journal.
How does options flow research connect to my options trading journal?
Research a symbol with Market and Footprint, inspect its grouped orders and contracts, then write your hypothesis in a trade plan. Tag any trades taken for that reason and filter your journal by those tags to review win rate, expectancy and whether the original reasoning held up.
Can I research strikes, expiries and open interest before planning a trade?
Yes. TradesViz provides contract tables and bubble maps, volume and premium heatmaps by strike and expiry, and an open-interest positioning map for the selected expiry. Use them to inspect the contracts behind an aggregate, then explore your own strategy with payoff charts and options simulation.
Which options brokers does TradesViz support?
TradesViz supports auto-import from major options brokers including TD Ameritrade/Schwab, Tastytrade, Interactive Brokers, Tradier, TradeStation, Webull, and many more via API sync or file import.
Can I backtest options strategies on TradesViz?
Yes, with two different tools. The Options Execution Simulator prices one multi-leg position on one historical date and shows its minute-by-minute path. The Options Strategy Backtester takes a single rule and repeats it on every trading day in a range, returning win rate, expectancy, max drawdown, streaks and an equity curve. Both cover all IN/US optionable tickers.
What is the Options Strategy Backtester?
It runs one options rule across hundreds of trading days on both US and NSE options. Instead of naming a strike you describe how to pick one (ATM, ATM +/- N strikes, percent or points) and which expiry to use (nearest weekly, nearest monthly, 0DTE, 1DTE or target DTE), and the rule is re-applied from scratch each day. Up to 8 legs, with templates for straddles, strangles, iron condors, iron flies and verticals, plus per-leg stops and targets, max daily loss, commission and slippage. Results include a realized payoff curve, P&L by weekday, DTE and time of day, and a day-by-day table you can export or push into a trading account.
Can I view options pricing (OHLC) charts on TradesViz?
Yes, TradesViz provides intraday options pricing charts (OHLC) for your traded options contracts, allowing you to analyze price movements and greeks over time.
How does TradesViz handle options assignment and exercise?
TradesViz automatically tracks options assignment and exercise events, linking them to your underlying stock positions for accurate P&L calculation and complete trade history.
Can I analyze options trades by expiration date?
Yes, TradesViz allows you to filter and analyze your options trades by expiration date, days to expiration (DTE), and see performance patterns based on how close to expiration you traded.
Does TradesViz support 0DTE options trading analysis?
Yes, TradesViz fully supports 0DTE (zero days to expiration) options analysis with intraday charting, greeks tracking, and specialized statistics for same-day expiration trades.
Can TradesViz track the wheel strategy?
Yes, TradesViz includes a wheel strategy tracker inside the Options Command Center. It tracks CSP premium, covered call premium, stock basis, adjusted cost basis, open short options, and completed wheel cycles by underlying.
Why we built this for options traders
A note from PK, Founder of TradesViz
Most trading journals were designed for stock traders and bolted options support on later. The result is journals that crash on iron condors, mis-tag verticals as two unrelated trades, and silently throw away assignment events because they don't match a 'normal' fill.
TradesViz was built from day one to model what options traders actually do. Multi-leg spreads, partial closes, rolls, assignments, exercises, 0DTE turnover, and broker exports that change format three times a year. With the expansion of the Options Command Center, TradesViz has grown beyond just being a journal for option traders. It is now where strategy discussion and brainstorming happen, and many options traders run TradesViz as their primary day-to-day platform when managing multiple positions across many accounts, because everything is seamless and centralized in one place. The greeks, the chain simulator, the per-strategy analytics, all of it exists because real options traders kept asking for things every other journal told them were 'edge cases'.
- PK, Founder of TradesViz
All-in-One Platform for All Traders
TradesViz is designed to be used by traders just starting out all the way to professional traders. The level of customizability and versatility is unmatched by any similar platform.
Replay, Simulate and Backtest Trades
You can simulate Stocks, forex, futures and even options on TradesViz. On top of this, you can even replay your trade second-by-second and backtest options using options executions simulator.
Trade Plans & Mistakes Analysis
Add trade plans to each trade and trading day to see what rules you break and how they affect your trading. Zoom in on your trading behaviour from a data-driven perspective.
Charting customizability
Add multiple static image charts, setup custom TradingView charts with your executions, MFE/MAE targets and more automatically plotted for all your imported trades!
Unlimited Reports and Analytics with AI
Gone are the days of fixed charts you cannot Customize. With AI Q&A, you can now ask any question about your data and get charts, tables and even add them as custom widgets to your dashboard!
Dedicated Note Taking + AI
Write notes, tag your notes, search your notes and even ask the AI to generate trade summaries as notes for your trades. TradesViz has a dedicated note tab for all notes management.
Advanced Statistics
MFE/MAE, R/R ratios, Exit Insights, Best/EOD Exit, Multi-Timeframe exit, Market-TA-Comparison, Running PnL analytics, Options greeks analysis and more - all of these on top of existing PnL charts make ~600+ charts on TradesViz.
Not just another journal. We pushed the boundaries of journaling.
With a team of data scientists, researchers and veteran traders TradesViz is built with a singular focus of improving trading performance in a data-driven way.
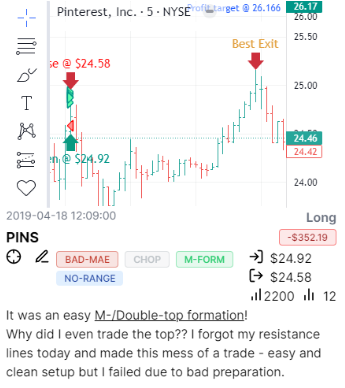
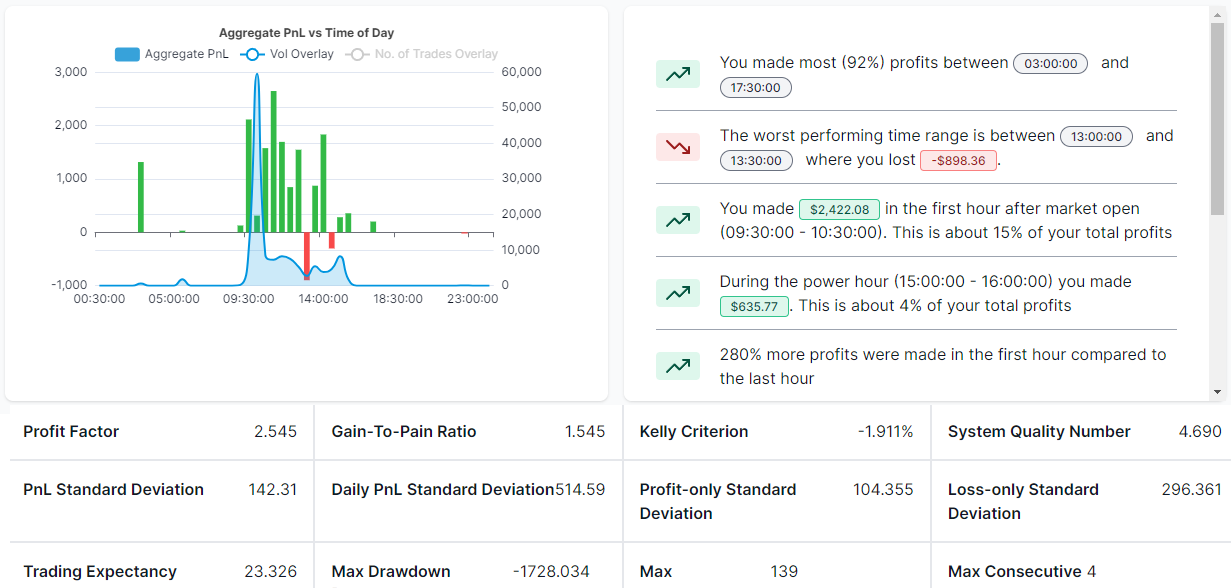
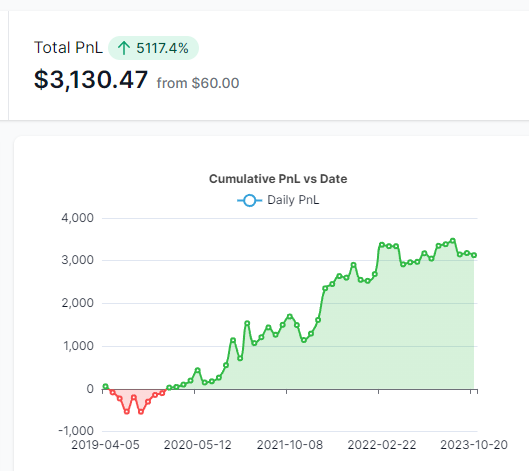
160+ Blog Posts of In-depth Journaling Guides + Always-on Support
We didn't skip the most important part out: Education. We update and launch new educational blog posts every few weeks + Post plenty of tips, tricks, trading news/info and journaling knowledge on our Twitter/X feed!

 Artificial Intelligence Q&A and Custom Widgets
Watch “Artificial Intelligence Q&A and Custom Widgets” on YouTube
Artificial Intelligence Q&A and Custom Widgets
Watch “Artificial Intelligence Q&A and Custom Widgets” on YouTube
 How to setup Interactive Brokers (IBKR) Flex Query for Auto-sync
Watch “How to setup Interactive Brokers (IBKR) Flex Query for Auto-sync” on YouTube
How to setup Interactive Brokers (IBKR) Flex Query for Auto-sync
Watch “How to setup Interactive Brokers (IBKR) Flex Query for Auto-sync” on YouTube
Not just a trading journal -
A Trading Partner for all markets!
TradesViz is a unified trading analysis platform that offers not just the world's best trade journaling capabilities, but also other tools that are tightly integrated to provide a 360 degree support (via tools) to traders looking forward to mastering the market.
- Trading Simulator & Multi-Chart Simulator
- Options Flow & Screener
- Real-Time Screener NEW
- Technical Analysis Backtester
- Fundamental Analysis/SEC13F Visualization
- Seasonality Analysis
- Side-by-Side Strategy Comparison
Value worth of $300+ per month is available to all traders of TradesViz at less than 1/10th the cost.
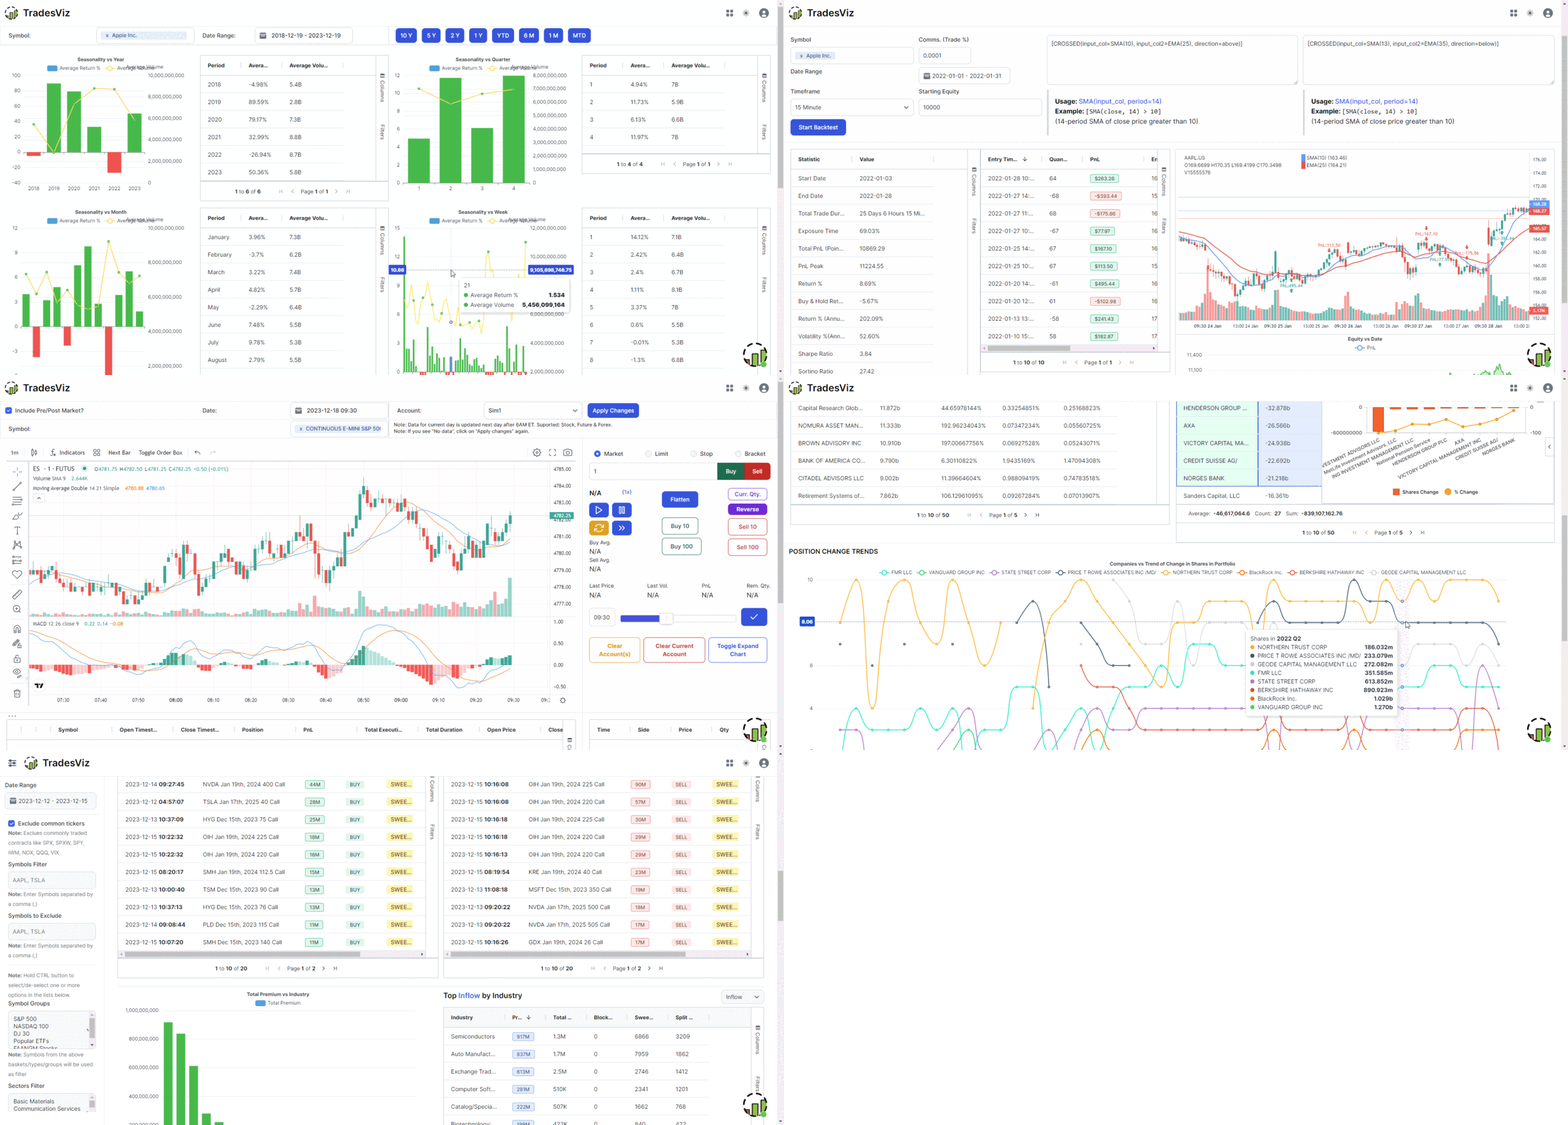
Highest value per dollar on the market
At TradesViz we focus on value and utility provided to traders. That's why we're still #1 when it comes to the value and features offered on an online trading journal.
Our guarantee: You will not find a better, more versatile, constantly up-to-date trading journal even at 2x or 3x our price. View Full Pricing.
Basic
For beginner traders to get started with journaling.
- Import 3000 executions/ month
- 50+ Performance Visualizations
- Basic auto-generated charts
- All basic trade management features and trade charts
Pro
All asset type import + 100s of charts & powerful grid features.
- Unlimited imports + All asset type support
- 400+ Performance Visualizations
- Multiple auto-generated + Interactive stock charts
- Multiple trading accounts
- Artificial Intelligence Question & Answer
- Artificial Intelligence Trade Summary, Notes & Coach
Platinum
All-in-one journaling, simulation and advanced analysis platform.
- Every feature in Pro
- Real-time Screener
- Unlimited Custom Dashboards
- Advanced Options flow analysis + Footprint research + Options Payoff Charts
- Exit Insights + Multi-Timeframe/EOD/Best Exit Analysis charts
- Trading Simulator (Stock + Options + Futures + Forex + Prop Firm)
- Pivot/Grid Charting (Most powerful analytics feature online)
- Trade/Day Plans & Checklist analysis
- Backtesting (70+ Indicators/Any Symbol)
- Dividend Tracker
What Trading Experts Say
TradesViz is the only trading journal in the world to be recognized internationallyby the popular Benzinga FinTech Awards Competition as a
Finalist in Best Data Analysis tool and Best Portfolio Tracker categories!


TradesViz is the most useful trading journal on the market for finding and quantifying your edge. An all in one trading journal tool for traders.

Trader, Author, and founder of NewTraderU.com
PK and the whole team at TradesViz.com have put together an outstanding product with exceptional features. PK provides the most excellent support in the chat help. And if something really isn't working quite right or as expected, they get busy to make it better. I originally signed up for TradesViz to have the simulator function which also gave me the statistical analysis I could use to improve my trading. I had been using a simulator which had almost no analysis. When TradesViz added the simulator function I gave it a try. At first I had a hard time making it work, but with patient explanation from PK and with some tweaking on functionality from the coders on the backend, they have delivered a super trading simulator. The trade analysis part of TradesViz is second to none. I've gained the insight into my trading weaknesses and strengths to be able to trade much better in my live account. This is the service you need!
I definitely recommend Tradesviz especially for new traders the way it tracks your stats is no short of amazing especially for me personally by best exit and and of the stats that tell you how long you usually are in drawdown and you are usually in profit. If you want to build confidence in your strategy and edge this journal is the way to go for sure!
TradesViz has made a huge difference in my trading and has positively impacted my trading for the better in psychology and profit.
I use it DAILY and have noticed the vast improvements being made, not only in profit but also in my mental approach to trading.
This is a must-have tool and is more important than any indicator you could ever use.
I've subscribed, at different times, to various reporting programs, and trialed several others.
Yours is night and day over them all. I particularly appreciate the degree of available customization and your quick, ever-patient response to support requests.
I have a small trading account. Thank you for offering such a sophisticated program at an affordable price.
TradesViz is a true leader in Trade Journaling Software. They offer extensive statistical data at an amazing price that almost seems too good to be true. You have access to an amazing support team that seems to be active at all hours of the day. My support agent helped me through a complex import issue and had it solved within 24 hours. I can't tell you how blown away I am with their software and their service. I'm more than happy with my experience and so excited to see what new features they bring to the table as they continue to grow their business. If you're on the fence, I encourage you to jump right over and take it for a spin with their risk-free trial. Thanks to all the TradesViz team members who continue to make my Trade Journaling efficient and effective.
Day Trader
GREAT PRODUCT AND EVEN BETTER CUSTOMER SUPPORT!
I have been using TradesViz for a few months and it is a fantastic tool. Prior to subscribing, I was spending hours on xls trying different tables and layouts and only getting frustrated (or overcomplicating things!). Now I have everything in one place (I have multiple trading accounts), and I have probably only explored 10% of the tools and data analytics!
BUT, what has really impressed me is the support: I have NEVER in the last 10 years had such instant, professional support from a company at (almost) anytime of the day or night!
Clearly this is a team that is passionate about their product and that will always translates into innovation and better experience & value to the customer.
Well done to the team!!
After only a short time of using TradesViz, I can confirm that this platform is exactly what I have been looking for. It takes the chore out of journaling – the number of stats, data, and information available on my trades is a complete game-changer. The importing process via MT4 file is extremely easy and the automated charts with entries are amazing. The whole process is extremely easy and helps to keep me accountable for my trading by having a professional system to manage my business. The platform is very comprehensive and takes a bit of time to get used to, but they have many videos on their YouTube to help with this as well as their support team.
Their support is exemplary and gets back to all my queries in well under 30 minutes with comprehensive answers and solutions to my questions.
This platform is absolutely essential for any trader and I would highly recommend it to any of my trader friends looking for a journal. If you don’t have this platform, you are seriously missing a trick here…
Thanks, PK from TradesViz for being extremely helpful and patient in resolving my syncing issue. Certainly one of the best online support I have ever experienced. Even though it took a while for me to get my settings right, I never felt rushed...I appreciate that. Hope to stay with you guys for a long time. Certainly would like to learn how to utilize most of the features on TradeViz.
In my opinion, the TradesViz platform is truly the Ferrari of journaling software available today. Once you are under the hood, you begin to realize that in fact what sets it so far apart is all the advanced analysis at your fingertips. Such as the ability to combine multiple portfolios, live charting, and much more. Their support is world-class, in my case personally, I needed integration with Trend Spider’s backtesting engine. What I imagined might take weeks was literally accomplished overnight. Factor in rock bottom prices and you have all you need for whatever you're searching for. Newer traders will find that one of the most basic recipes for success is meticulous record keeping, simply observing your account profit and loss go up, or just down as the case may be, is the first step on the road to ruin if your serious about trading.
Trader
I'm writing this testimonial as appreciation for this surprisingly pleasant
conversation.
Upon my initial support request, TradesViz's support was impressively swift. A response appeared every single time as soon as I closed my email tab. Not only did I receive incredibly helpful information about features I wasn't aware of, but the team was also genuinely enthusiastic about discussing my feature requests and ideas about the industry. Truly awesome people!
In terms of raw analytics, comparison, and filtering capabilities, there is no match for TradesViz. I also don't know of any other trading journals that offer so much for the price, their free version has pretty much everything you would need if you trade stocks and offer so many of the paid features that are on other websites for free. They have templates for almost every broker and if it's not there, their support team is only 1 email or message away and will work with you to include your broker on their platform. By far the best support I have gotten from any trading journal as they are open to feedback and feature requests and are very active on their chat for any questions. A trading journal built by traders, for traders.
Professional Futures Day Trader
I wish I had TradesViz when I started to trade ten years ago. I had to learn the hard way. It provides everything you need to maximize your wins and minimize your losses.
There’s a learning curve but once you get past that your trading will surely be taken to the next level.
Founder of ChartLearning.com
As a full-time trader, the first pivot point in my trading results came after I started to learn from Mark Minervini - this is when I stopped losing $$$. The second pivot point came after I started to analyze my results - this is when I started to be consistently profitable $$$.
I love that TradesViz works for Options, Stocks, Crypto! It has automated and manual uploads. It has all the important metrics and analysis that you will need and it is fully customizable.
I have tried pretty much most of the products out there, and TradesViz wins by a mile - highly recommend it! Thanks to PK and the team!
Thanks, @MightySoldiers for turning me on to @tradesviz. I'm loving the customized dashboard. The level of detail and ability to really dig deep on metrics is unparalleled. This tool has helped me so much in defining my trading strategy and where my edge is.
Trader
I was looking for a solution to journal my trades on multiple platforms to keep track of my PNL. I stumbled upon TradesViz and I have nothing but positive to say about their service. Not only does their product make it so easy to see how you are doing on your trades with the various graphs and filtering options, getting your account synced is super intuitive. Best of all their customer service is top-notch. Every time I have asked a question, they have responded within a few hours with a solution, and sometimes that involved programming custom solutions for me to make my life easier. It's a no-brainer for me to pay for the yearly service. Do it, you won't regret it.
E-commerce Analyst and Trader