Another one-of-a-kind feature that will be extremely useful for all options traders has come to TradesViz.
You can now view your individual option executions on an options pricing intraday chart - with all the indicators and your executions plotted.
Here's an example of an AAPL contract trade:
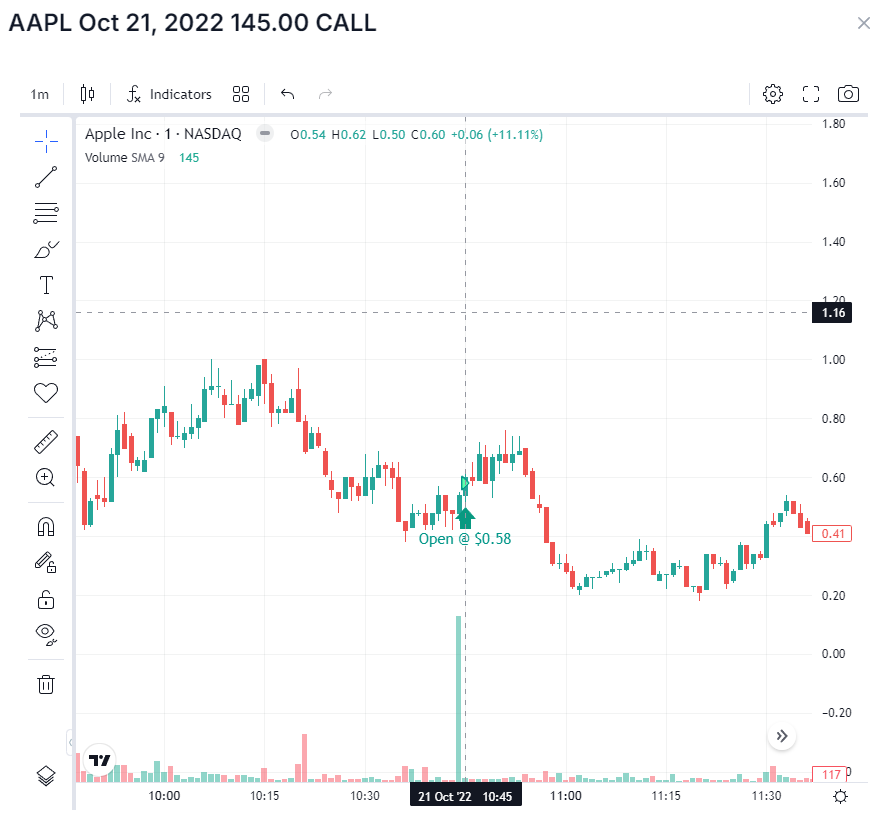
Not even brokers provide this type of charting for historical trades. To our knowledge, there is no other platform that provides historical options for contract execution plotting for your trades. TradesViz is the ONLY platform that offers this for ANY optionable US contract.
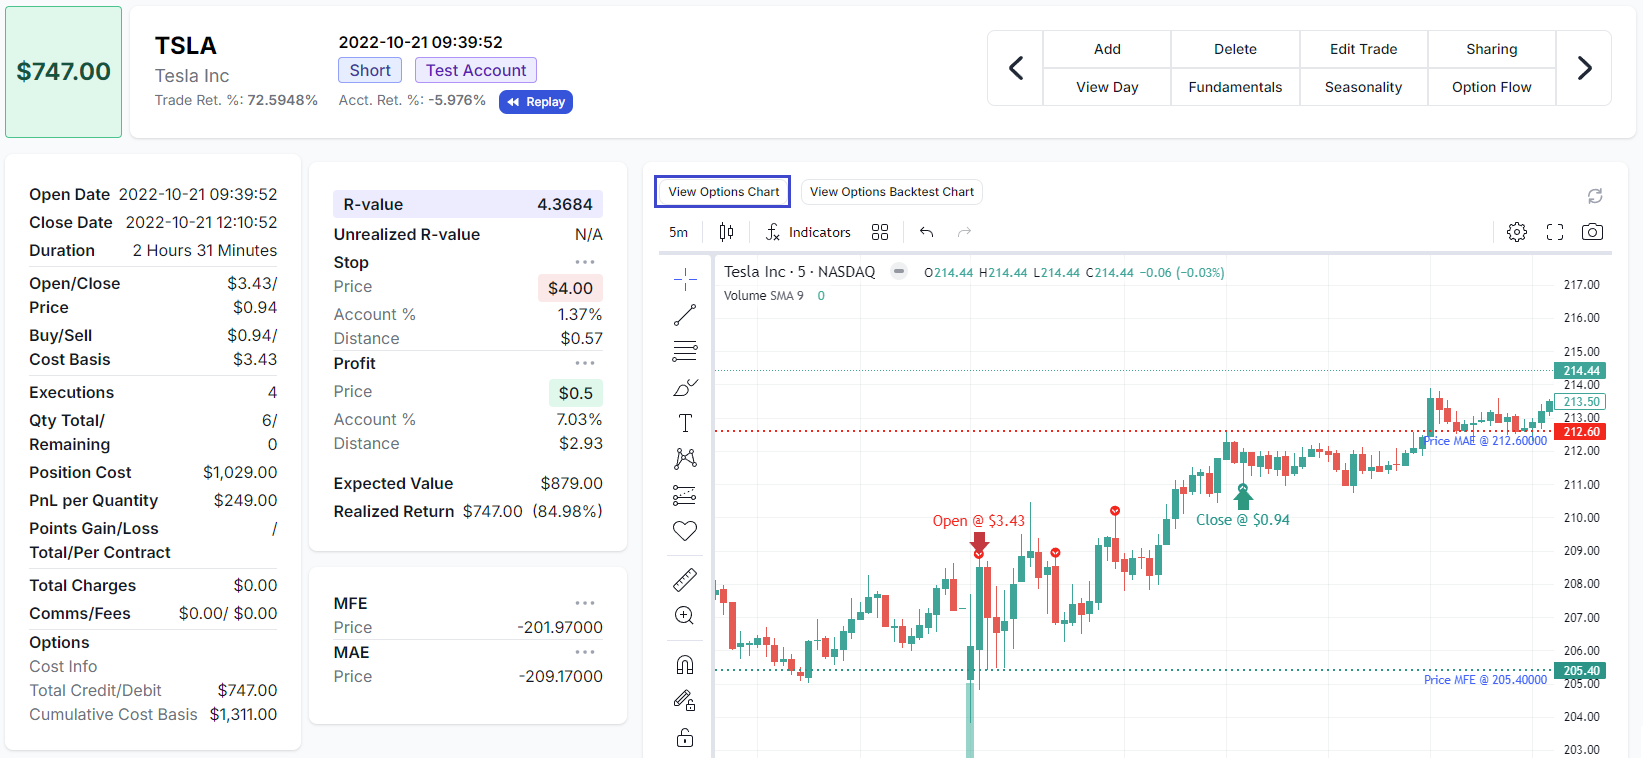
To access this, click on the "View Options Chart" button at the top right corner of the main chart on the trade explore page.
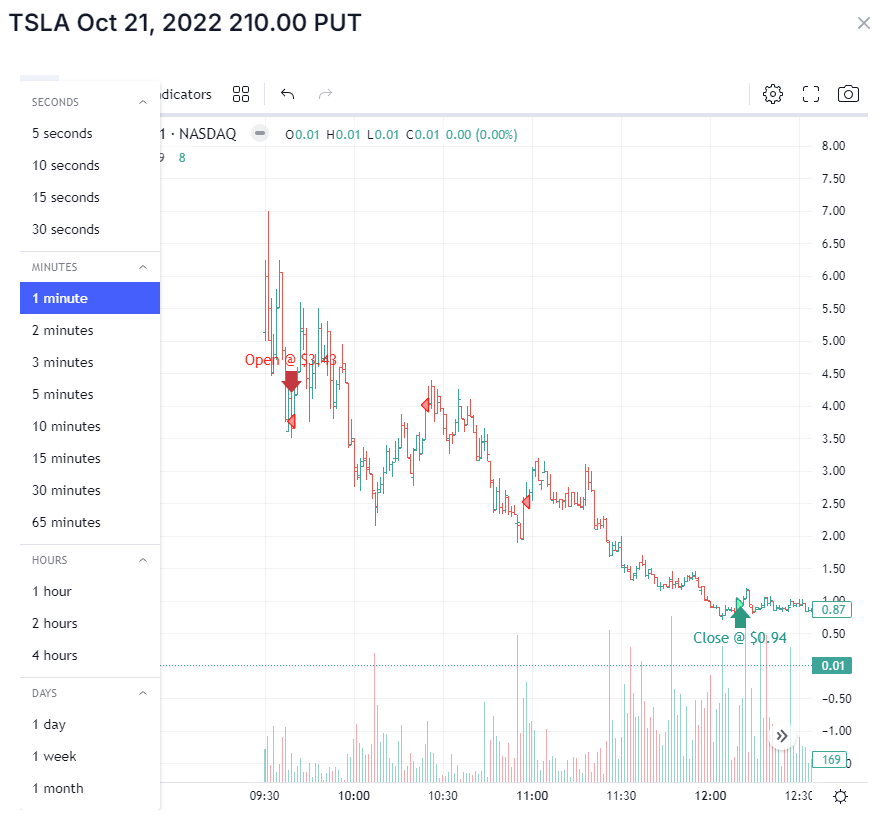
Here is another example of all the executions plotted on a TSLA Oct 21 210 Put expiry contact pricing chart:
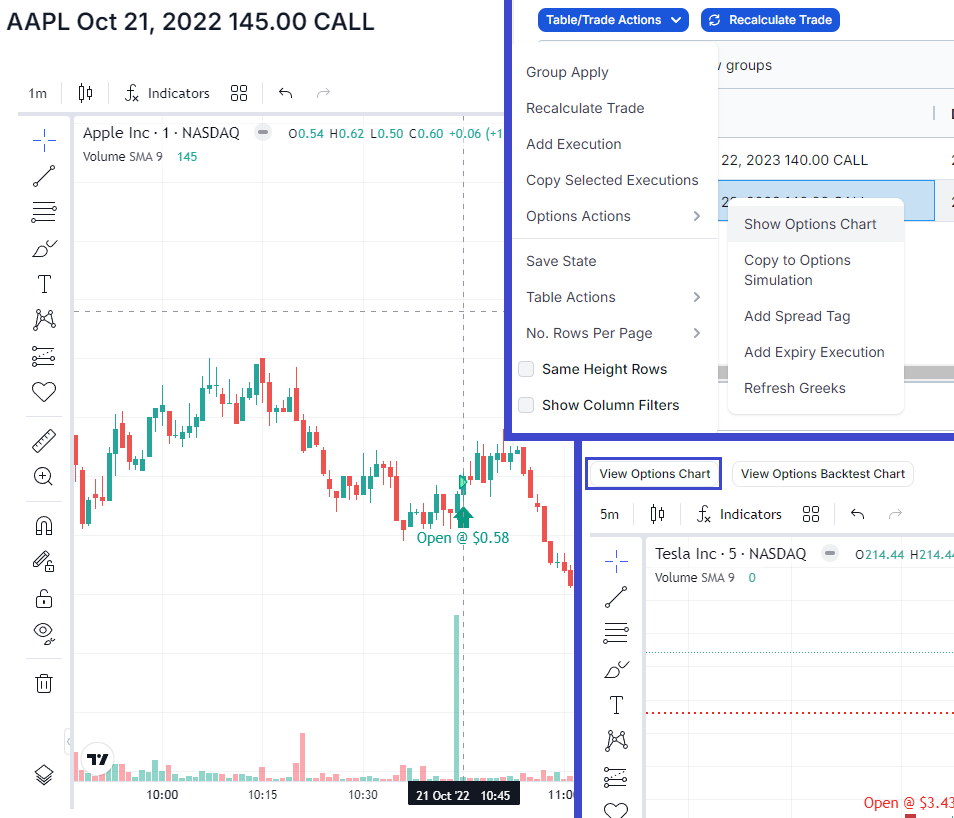
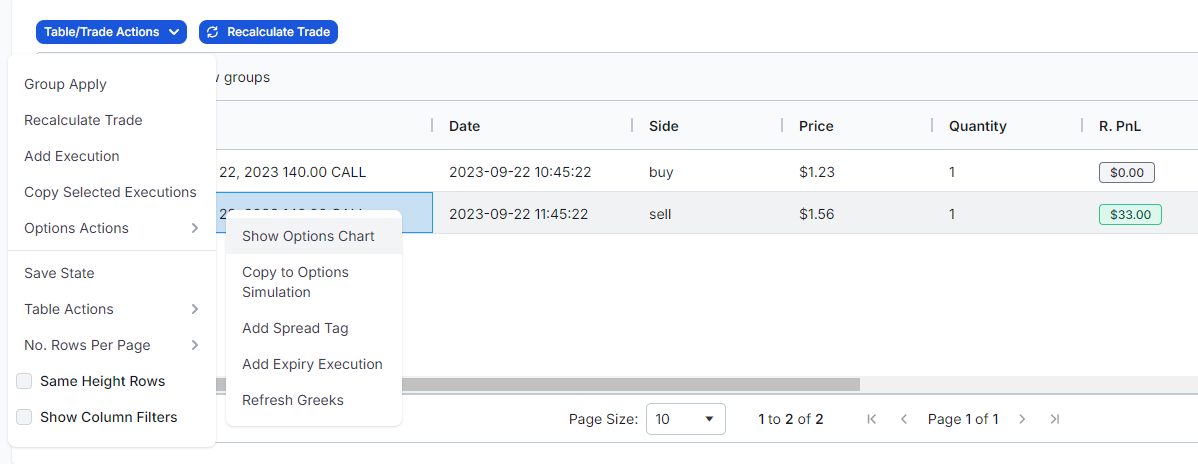
If you have multiple contracts (different expiry/strike/put/call) in the same trade, click on that execution in the executions table and then on "Trade/table actions" > "Option actions" > "Show Options chart".This allows you to view the chart of ANY individual leg if it's a multi-leg spread options trade. If nothing is selected, the first execution's option info will be shown.
With this, TradesViz now has intraday data for stocks, stock options, futures, forex, indices, and crypto. On top of this, with our new stock/futures simulation, we also have much granular timeframe data for US stocks and futures.
In the quest to provide the ultimate value to EVERY type of trader, there is no competition for the features and the value we offer.
If you are an options trader looking for the most detailed platform to journal and understand your trades - sign up for a free trial and start exploring TradesViz's features!