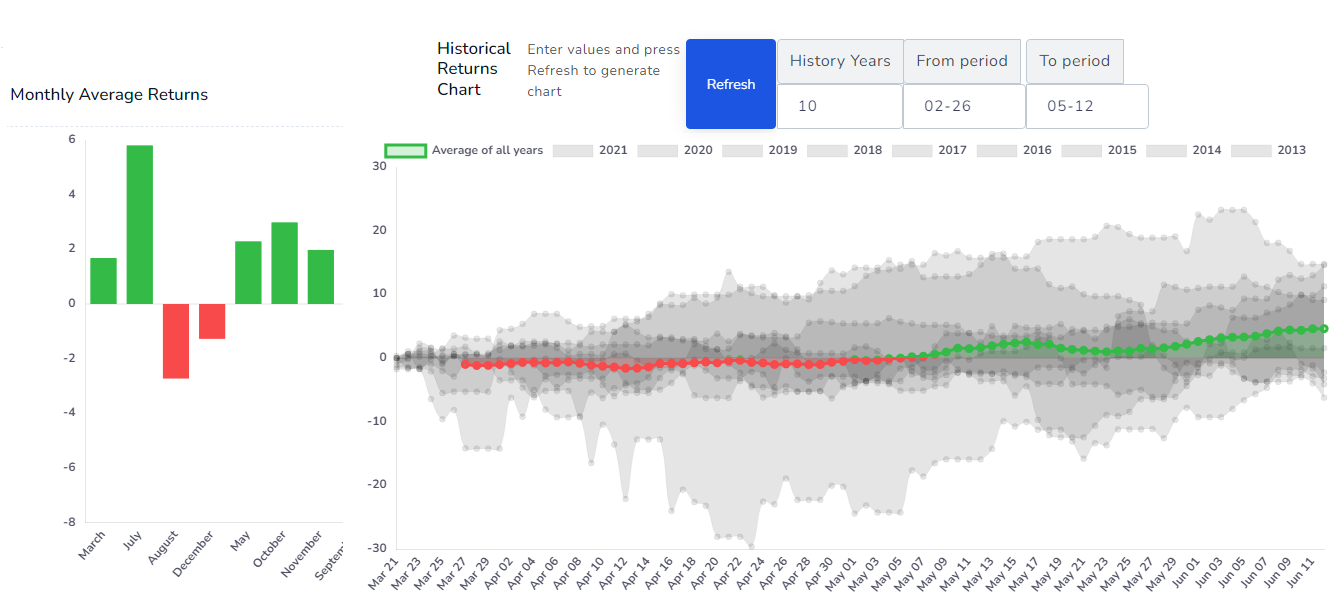
New feature: Seasonality Charts for all symbols
In trading, it is said that history always repeats itself... So, why not use it to our advantage? You can now view seasonality charts for ANY symbol from US, Canada & Indian exchanges on TradesViz to see how the ticker's performance changed historically for any given period.
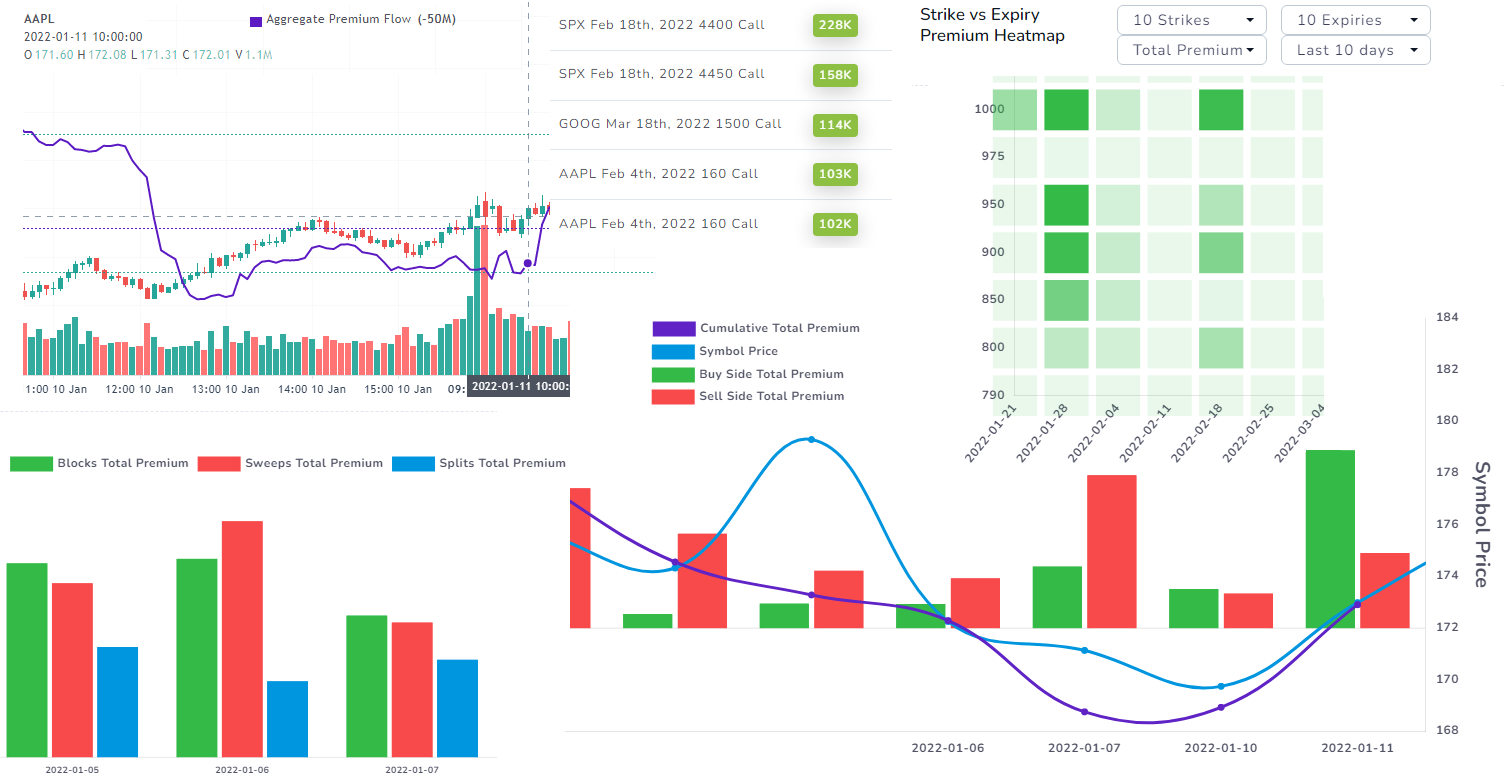
In-depth Options Flow Analysis in TradesViz - Learn the flow of the market
It's finally here: The best options flow dashboard with TRUE market data and all the right visualizations to help you plan your trades and learn more about the market conditions! Use flow analysis in combination with your journaling to get a COMPLETE picture of the market and how you performed.
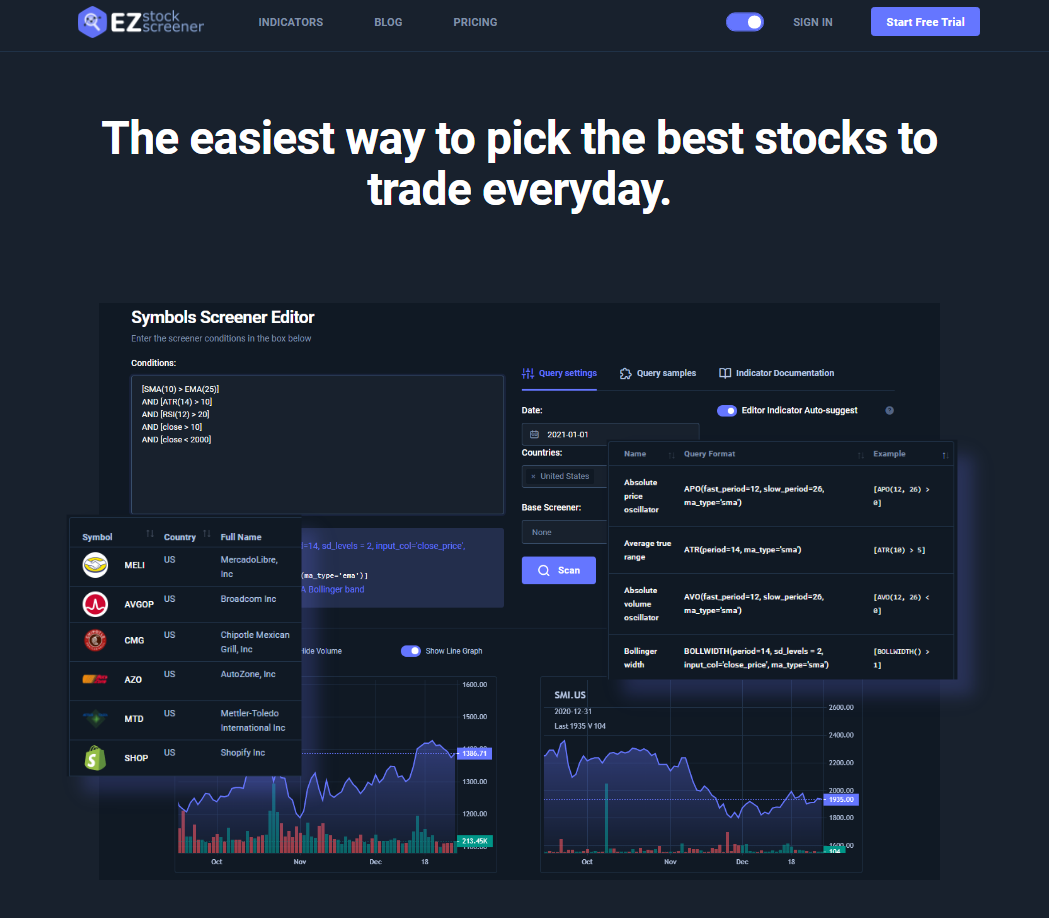
Introducing: EZstockscreener - An easy way to screen for the best stocks to trade every day in internatinoal markets!
After creating a very versatile post-trading tool where you can analyze and get insights about your trading performance, we set our sights on creating a pre-trading tool where you can now plan out your trading by creating watchlists by screening for the best opportunities among 15,000+ stocks worldwide! Visit ezstockscreener.com to learn more!
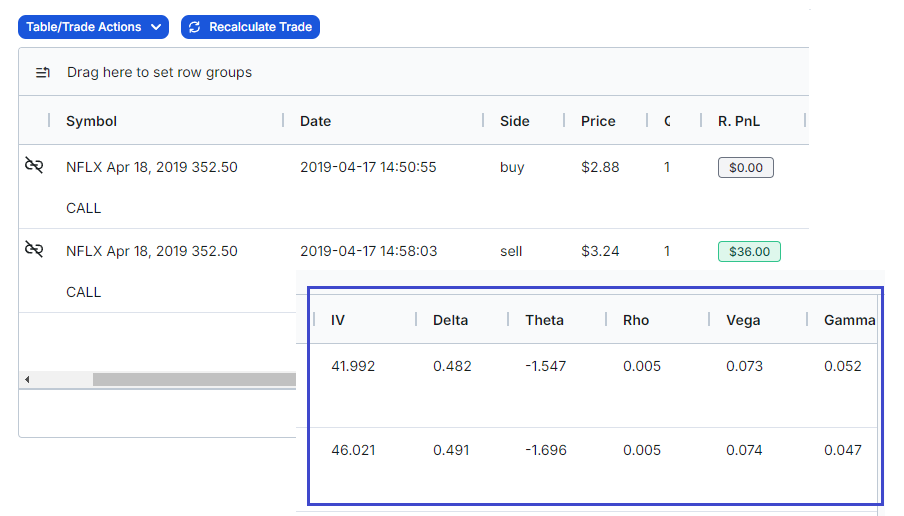
New feature: Option Greeks
A treat for all options traders: view all options greeks right in your dashboard itself! No need to mess with your trading client to lookup greeks for your executions!
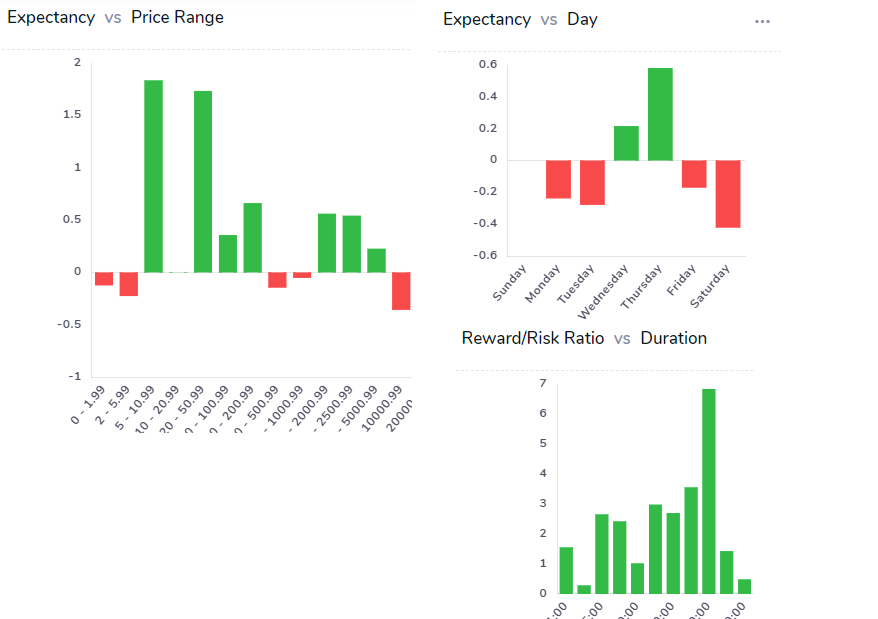
New performance metrics: Reward/Risk Ratio and Expectancy!
Reward/Risk ratio, Expectancy ratio for all your trades - learn more about new performance metrics and how you can access them!