We first introduced this feature in Q1 2021 and it has withstood the test of time as one of those features that has not gone through a lot of changes but remains a commonly used feature among advanced users. Filtering is one of the core functionality of any dashboard and it is sorely lacking (sometimes completely missing) in every other competitor and similar product which leads to traders spending a lot of find messing with broken/limited filters to create reports again and again. Traders of TradesViz have never had this issue.
The functionality of this feature has not changed in the v2.0 update but we have added another way to access and utilize this feature which we will explore in this blog post along with a v2.0 refresher of the trade report feature.
What is a trading report?
We will define a report as your dashboard or parts of your dashboard filtered with very specific parameters to create statistics that are relevant to the use case you are looking to explore.
For example, you may want to see how you are doing trading only large-cap stocks in the first 1 hr of market opening or how your short swing trades opened on Fridays are performing. As you might have guessed, you can use the plethora of filters TradesViz has to achieve this.
But the one downside you may have is, as your trading accounts and data increase, so does your anlaysis complexity and it can get tiring to keep applying the filters repeatedly, which is inefficient. The trade reports feature fixes this exact downside.
How to build a report
As defined above, a report is when you apply a list of filters to your trading data. To build a report, you need to create a list of filters or apply a list of filters.
There are two ways to apply filters globally on TradesViz:
1. Chart filters
This is extremely simple. As a user of TradesViz, one of the first features you might have noticed is that almost EVERY single chart is explorable (drill-down) - meaning, you can click on any bar/datapoint and explore exactly what trades make up that point. All this takes is a *left* click on the data point:
If we want to apply this as a filter, we need to **right-click** the data point. Once you do this, you will automatically see the list of filters at the top instead of the dill-down action happening.
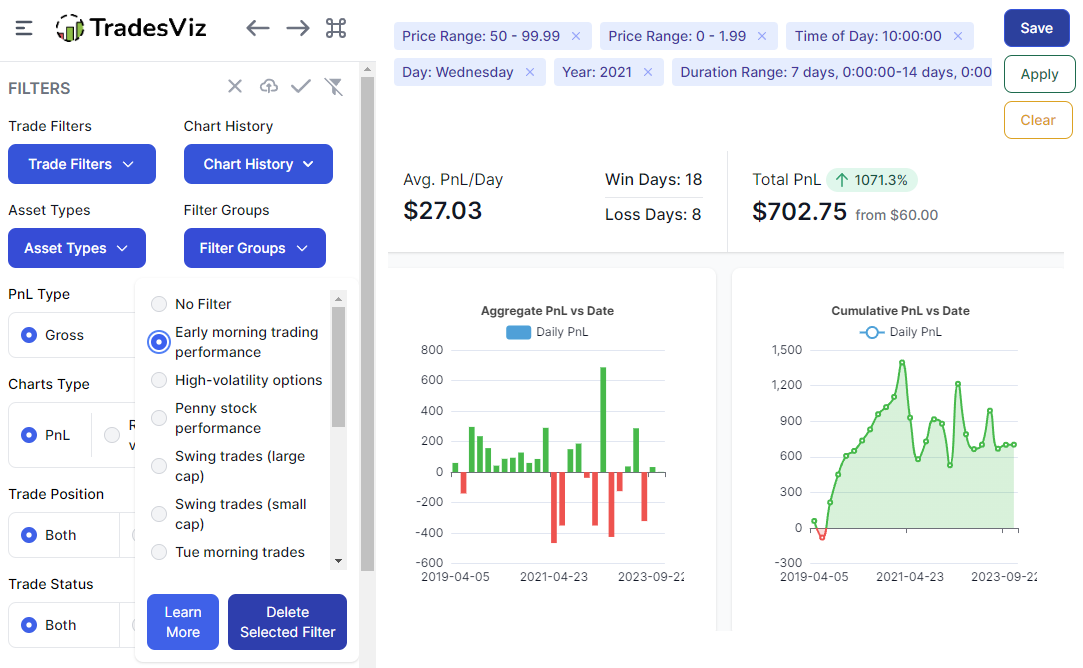
For creating reports, we need filters. Whatever data you want to filter for, right-click on it and you will see the X-axis label's filter text along with the value will appear at the top. For example, in the video above, we right-clicked on the "March" datapoint in the PnL vs month chart a filter `Month: March` was automatically added to the filter list. If you click on "Apply", these filters will be applied globally to all tabs.
Adding multiple filters relevant to you is what will help you create a filter group that can be applied to create a custom report.
2. Global dashboard filters/toggles
When you click on the "Filters" button at the top right of your dashboard, a sidebar will appear on the left side with many filters. These are also filters that can be applied globally so that they affect all tabs/charts you see.
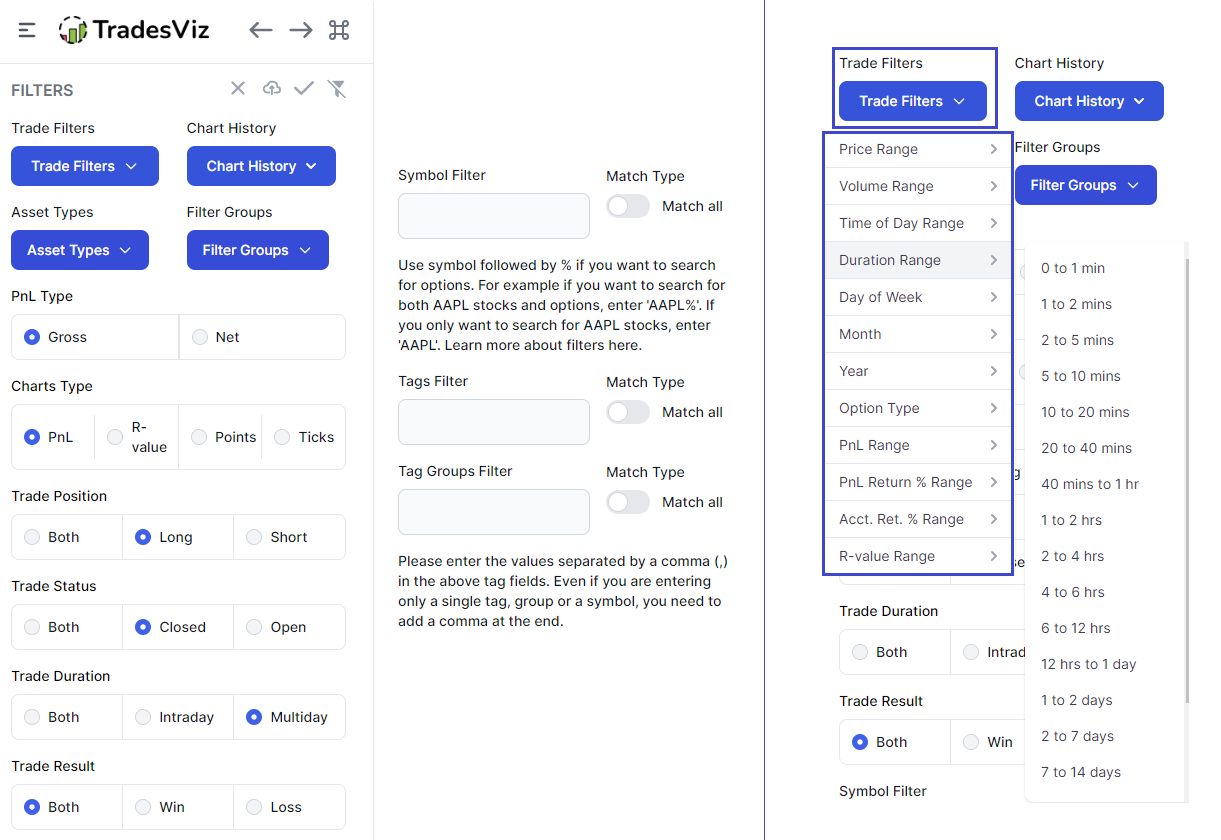
This includes filters for *pretty much everything* on TradesViz. The two columns on the left side of the image above show you the full list of the available filters. In addition to these general filters (like net/gross, asset type, trade stats/type, symbol, etc.,) you can also filter by every trade attribute - like price range, volume range, time of day, etc., as shown on the last column in the image above. But this is just a shortcut to the chart filters we discussed above. Clicking on any of the "Trade filters" options will automatically create a chart filter box at the top of the UI as we saw in the video in the previous section:
How to save/edit/delete a report
We have learned about the different filters. Now it's time to save them so that we can access them at any time to create a customized report.
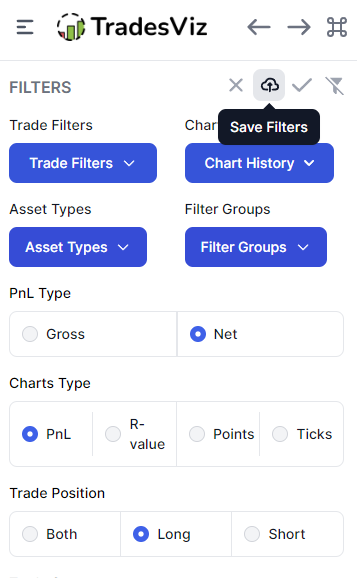
Save
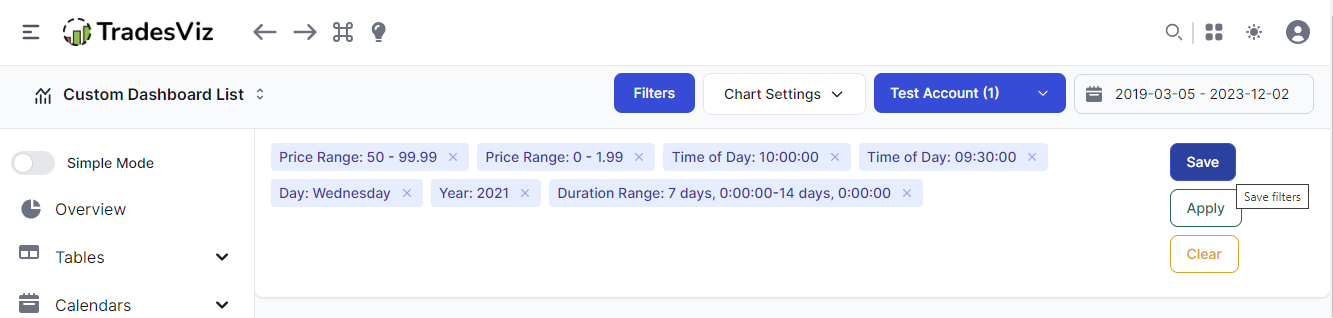
To save a filter group - either chart or settings etc., you need to first apply it. Here's an example of applying a few chart filters and saving it:
Video:
Here's an example of applying a few global toggle settings and saving it:
Video:
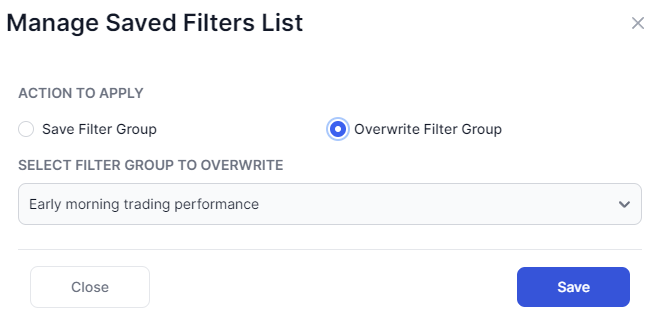
Edit
It's not possible to edit filters - you can only overwrite them. So, to "edit" a filter, you can apply the filter, make changes, and then when saving, make sure to click on the "overwrite" option instead of "Save filter group" and click on "Save":
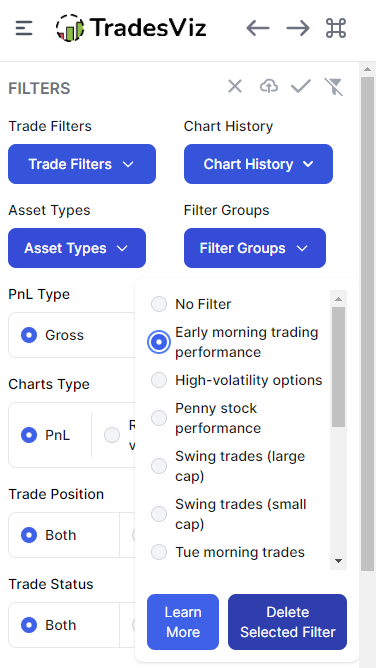
Delete
This is available in the filters section. Click on the "Filters" button at the top right corner, select any pre-created filter in the "Filter groups" dropdown and click "Delete selected filter":
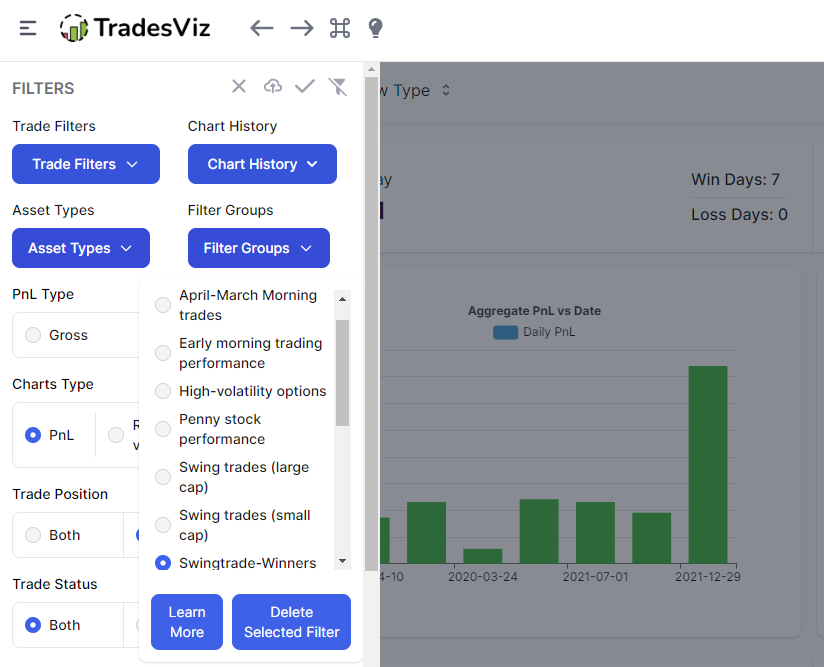
How to apply a report
Simple: Just click on filter groups in the filter section and select your filter. After that, click on the check button at the top to apply the filters.
Video:
Finally, try using custom dashboards to further elevate the utility of the filters group feature. Since you are not bound to fixed charts or stats in custom dashboards, you can create custom dashboards for each trading account if you follow a different strategy or for different metrics (symbol-wise, time-wise, etc.,) and use unique filter groups for each dashboard since filter groups when applied affects everything in the dashboard.
What you've seen above is the most flexible and easiest way to create trading reports in a trading journal. This is incomparable to anything that's available at the moment. All of these features are built on top of the powerful analytics system that is at the core of TradesViz - this is a significant differentiating factor between TradesViz and other similar solutions.
We hope this feature helps in reducing the time needed to create the reports you want. We've seen a slow but steady increase in the average no. of trading accounts and unique assets traded per user. This means, that as you have more data, you are going to need quick and efficient ways to create reports that are relevant to you as a trader. These charts and global filter profiles can help you achieve exactly that.
This completes the TradesViz v2.0 report creations using chart and global filters and their management. If you have any questions or want us to add any features, please feel free to contact us at [email protected]