In this blog post, we will discuss how to create custom columns in the trades tables of TradesViz v2.0.
The original trades table has over 70 unique columns - every one of them can be sorted, filtered, hidden/shown, changed in size, grouped, charted, and more via the trades table and the pivot grid.
But this feature takes the number "70+" columns to potentially infinite.
What? How?
Ok, so the new feature allows you to create a custom combination (think formulas) from existing columns of the trades table to create new columns that can be used for further anlaysis and charting.
Here's how you can do this.
First, navigate to your trades table click on the actions button at the top, and select "Custom Columns"
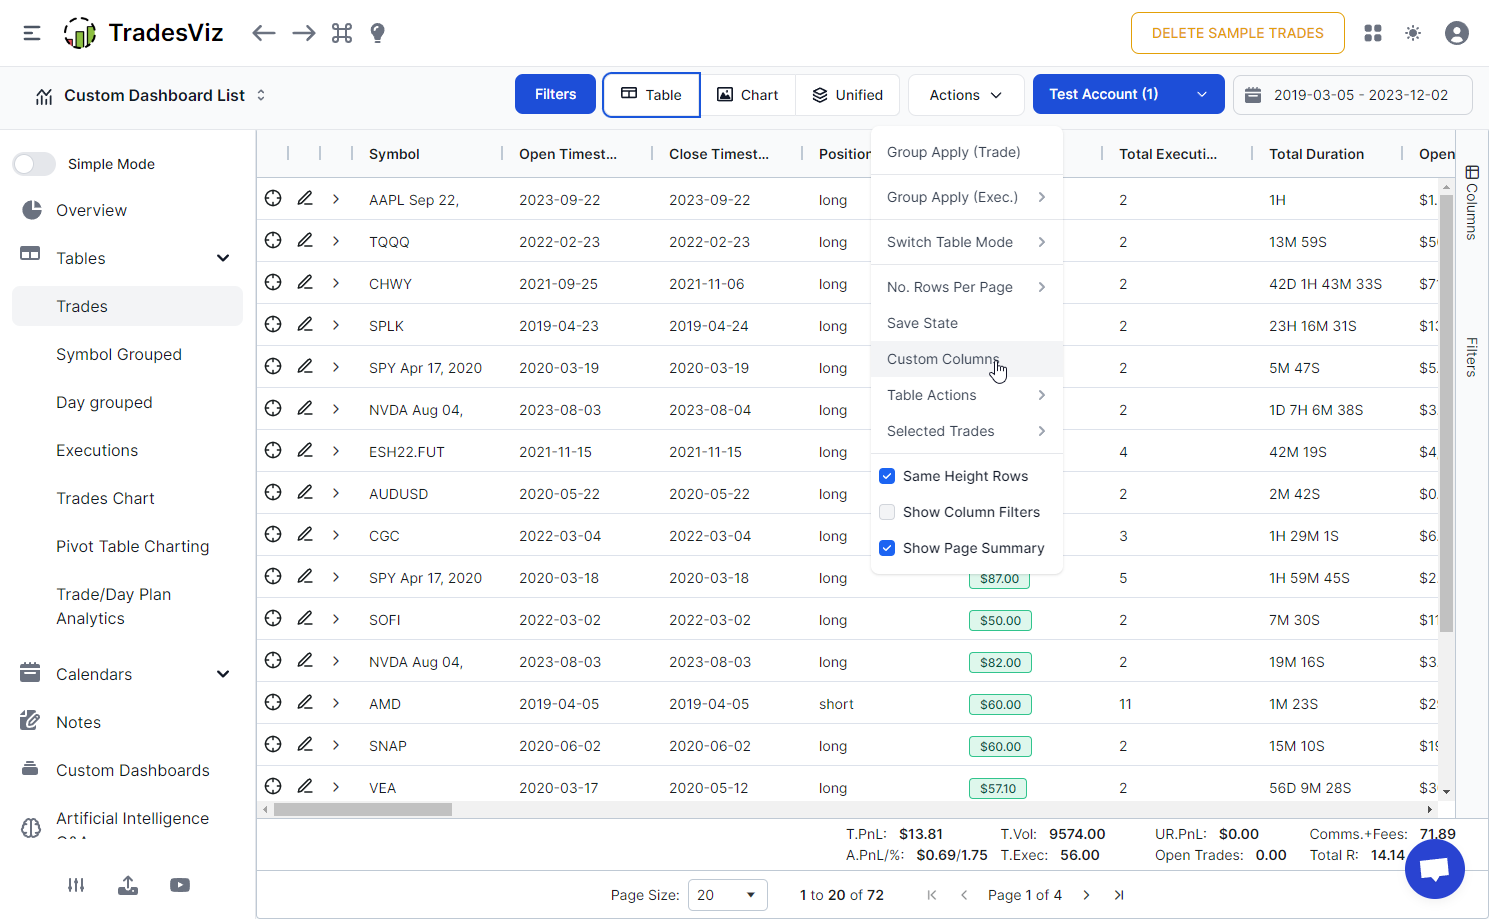
A popup will open where you can enter a formula-like input to build your columns that will be added to your trades table.
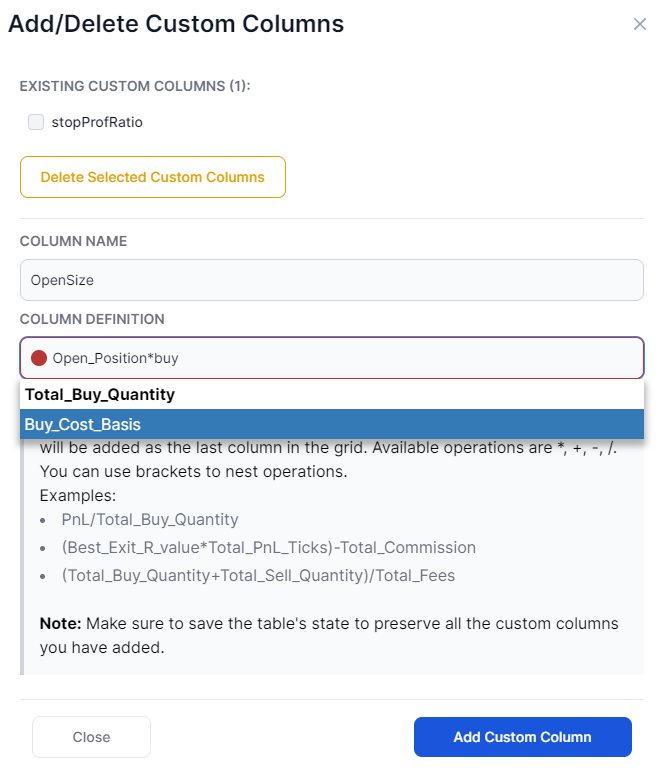
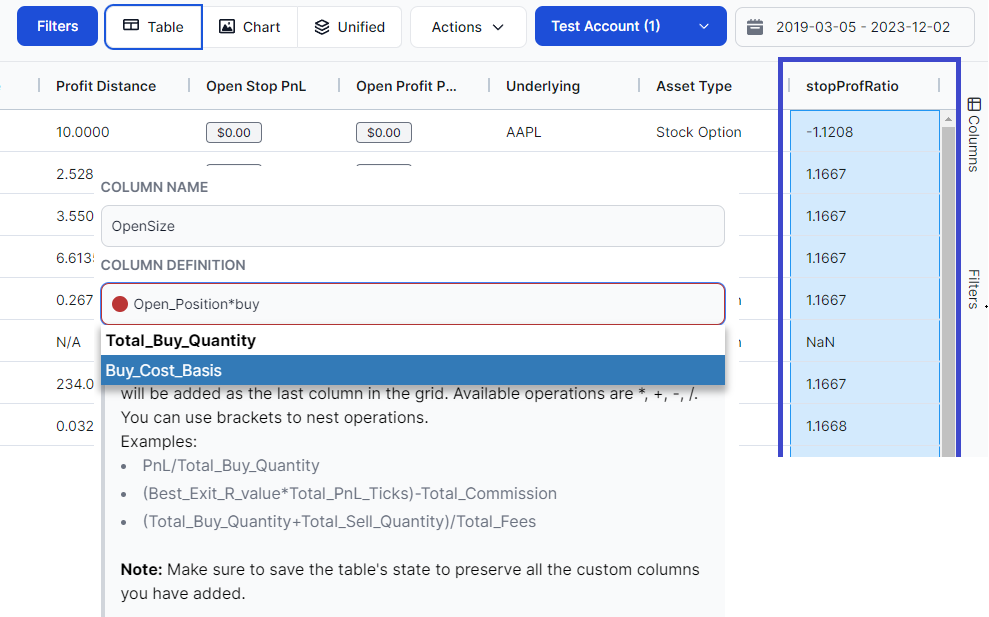
Start typing any of the 70+ base columns and you will automatically get suggestions. Select from the suggestion and you can continue with writing an entire expression based on basic arithmetic operations like: * (multiply), + (add), - (subtract), / (divide). You can also use brackets to properly nest your operations. If you see a red dot, it means the formula or the expression is invalid - you may need to re-check the brackets or make sure you selected from the dropdown when entering columns,
All the columns you create will be added at the end of the trades table:
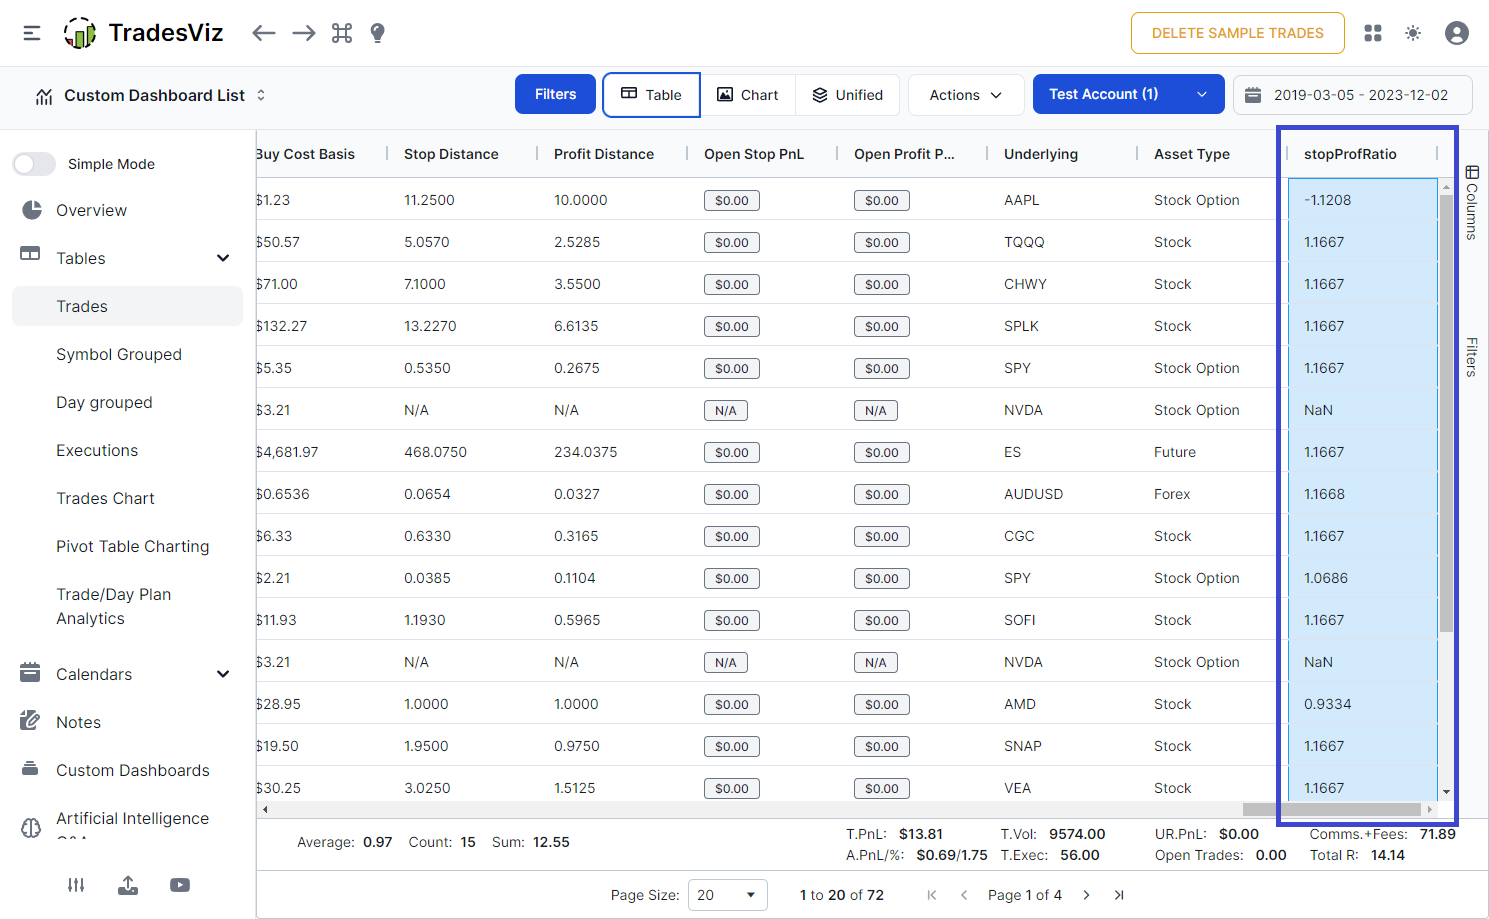
There are infinite possibilities of what you can create with this feature.
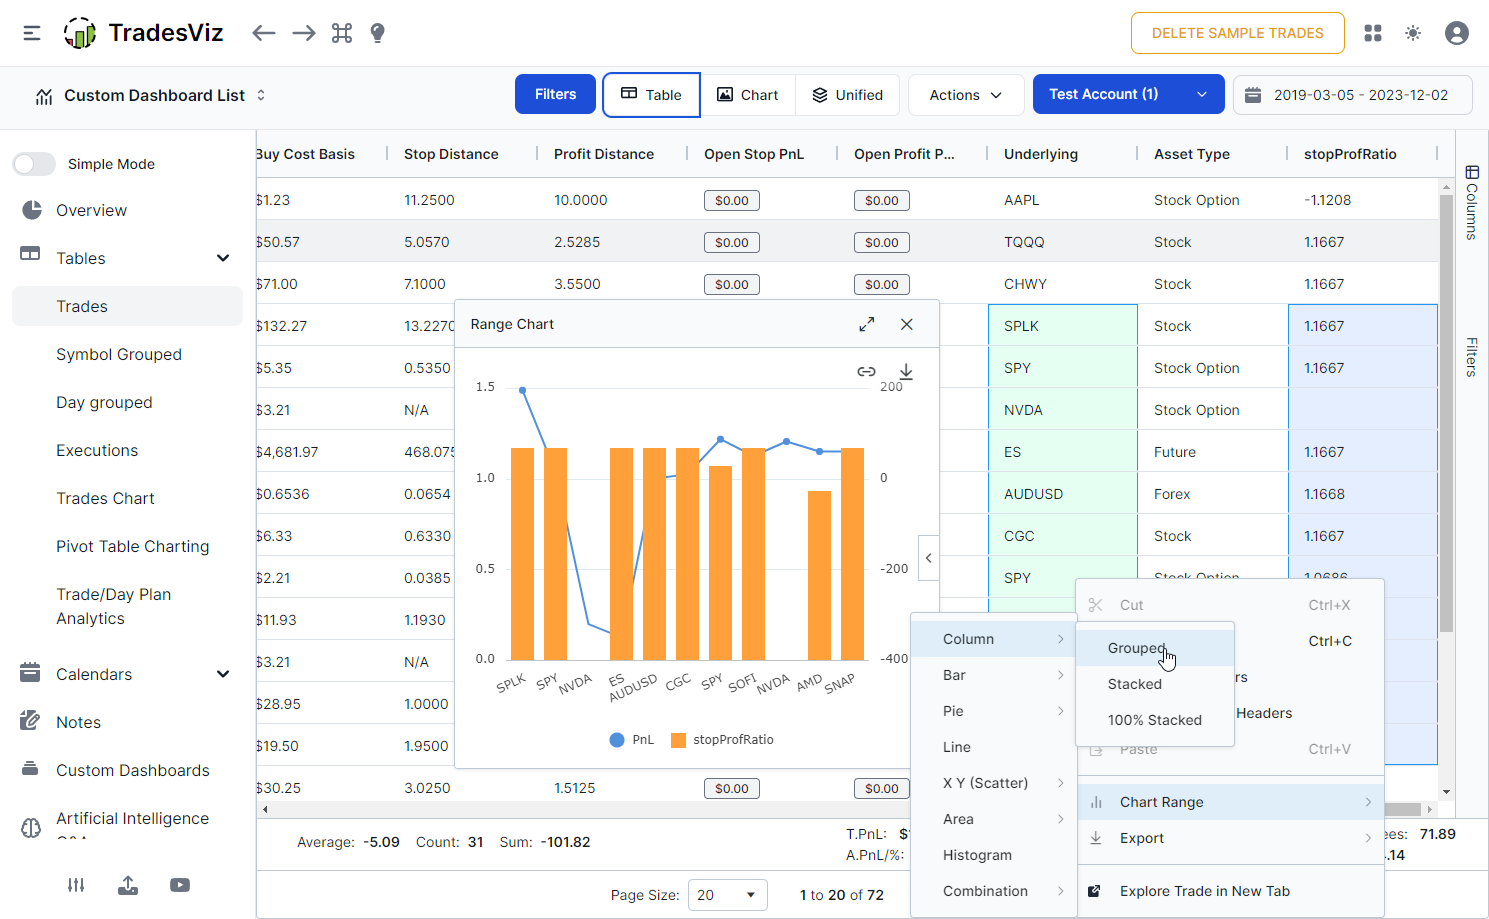
For example, the above column is a ratio of the stop and profit targets. The one before that is the remaining open value of the trade. Here are some unique formulas
- PnL/Total_Buy_Quantity
- (Best_Exit_R_value*Total_PnL_Ticks)-Total_Commission
- (Total_Buy_Quantity+Total_Sell_Quantity)/Total_Fees
- Stop_Loss/Profit_Target
- Price_MFE*Total_Buy_Quantity
Finally, after creating the custom columns, make sure to save your grid! Click on actions and then click "Save state" to save the entire grid's state (including the custom columns) to your TradesViz profile. You can delete any custom columns via the same popup up create them with.
Some caveats so far: The state of the table is reset whenever you add a custom column and also filtering so you may need to rearrange/hide/unhide columns after adding a new custom column, and sorting on custom columns only works for the pivot grid - not on any of the main tables. Also, However, charting can be done in both the tables:
We will keep refining this so that you can completely replace any Excel formula you have in your Excel sheet that is preventing you from moving completely to an online journal.
We highly recommend checking out recent videos on features of TradesViz v2.0 and the blog post on the in-depth guide about the v2.0 TradesViz grids to understand just how powerful these grids can be!
Aug 2025 Update:
It is now possible to use a trade plan's numeric conditions as input to the custom formula builder to create limitless combinations of 100% custom calculated stats! Visit the pivot grid tables and add a custom column with calculated numeric inputs!
Sep 2025 Update:
The Executions table now has a custom column builder! Since it has expiry and basic quantity, price, realized pnl info, you can create useful columns especially if you are an options trader!