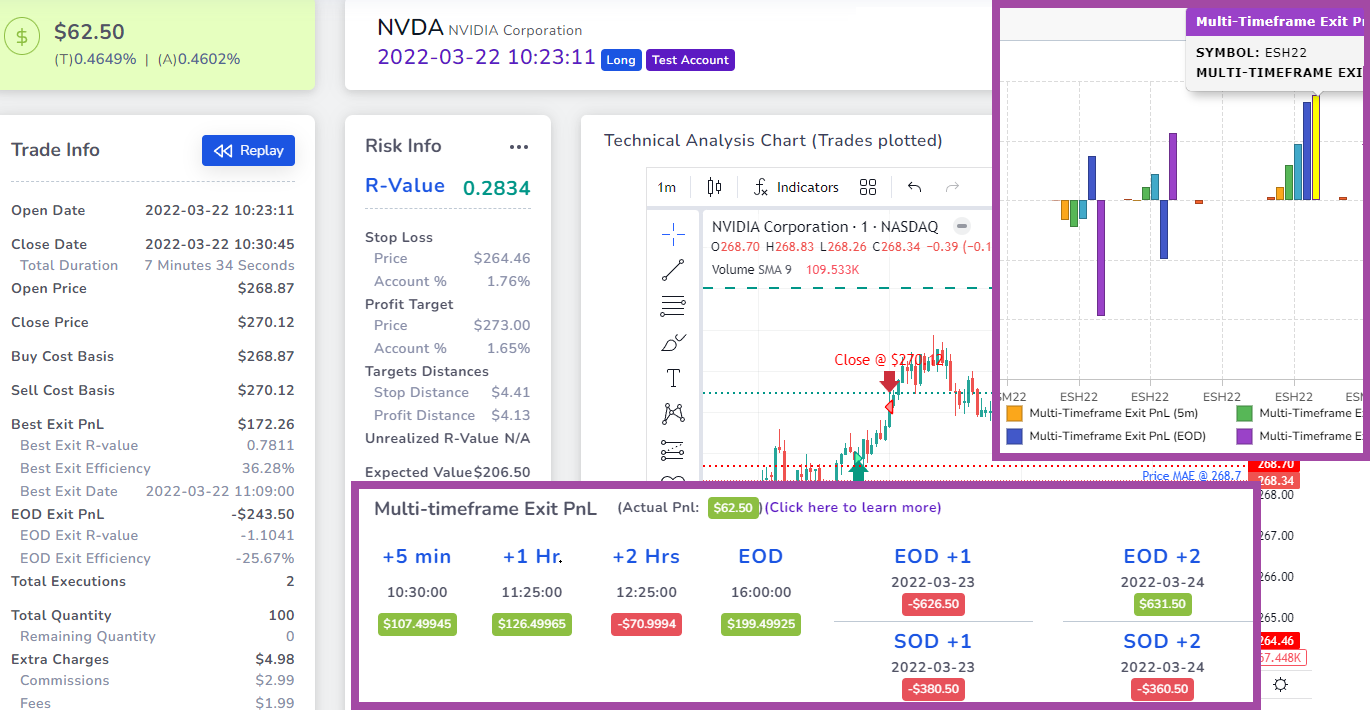
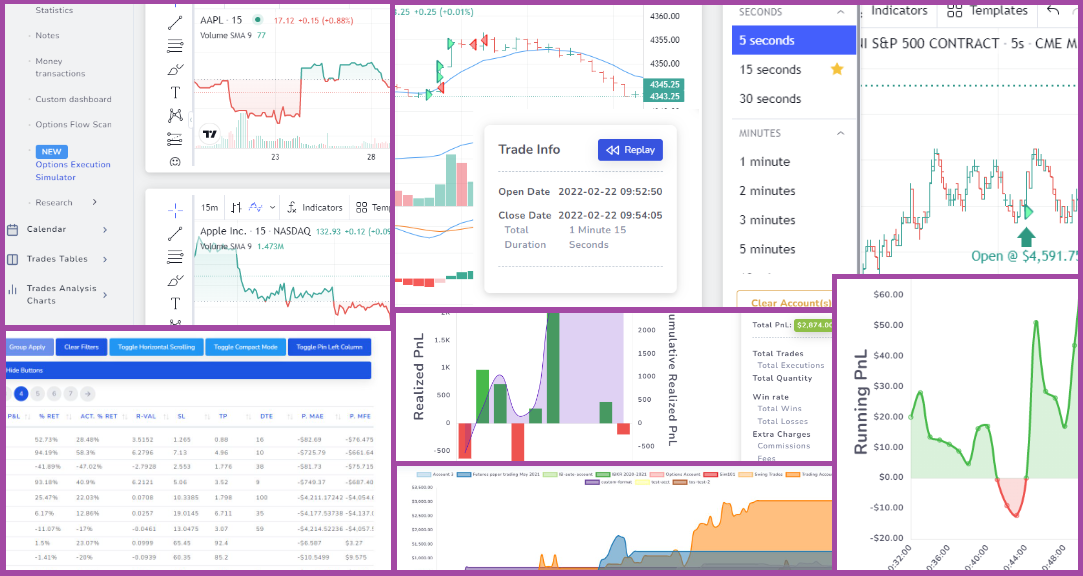
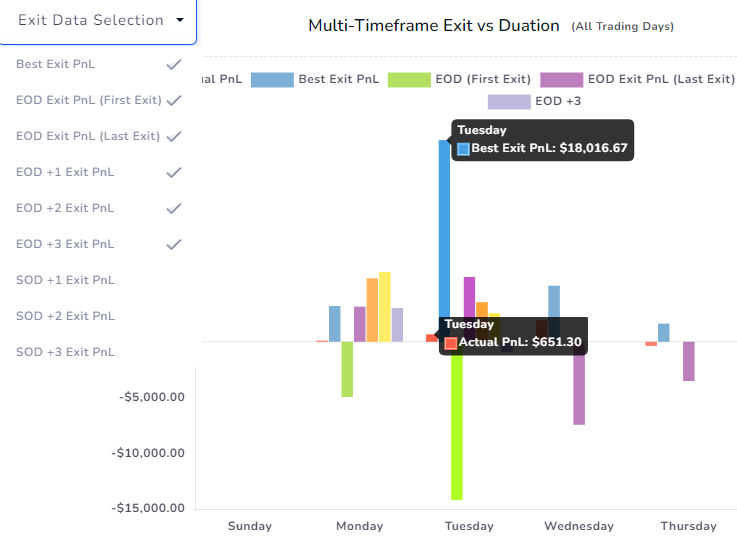
blog-post-image
By TradesViz On in Introduction

New feature: Multi-timeframe Exit PnL analysis - What if you exited your trade after a day or two?

Have you ever wondered what would have happened to your trade if you had exited after 5 minutes? 1 hour? maybe after 2 days? It can be eye-opening to see these stats generated automatically for every single trade you take!


blog-post-image
By TradesViz On in Changelog

Feb 2023 to Aug 2023 Updates: AI analytics, Pivot grids, Trading plans, Options chain simulators and more! - Biggest TradesViz updates!

One of the biggest updates TradesViz has had since our launch. MASSIVE game-changing and world-first features were launched in the last 6 months. These features completely changed the trade journaling landscape putting TradesViz at the top of every trader's journaling tool preferences. Pivot grids, AI analytics, simulations, trade plans, and more - read on to learn more!


blog-post-image
By TradesViz On in How-To

Everything you need to know about tags, managing and organizing tags in TradesViz trading journal

The complete guide to tags in TradesViz trading journal. You will learn how to manage tags, organize them and analyze with tags in your trading journal with this guide.


blog-post-image
By TradesViz On in How-To

Advanced journaling analysis with pivot grid: Examples and use-cases

Want to fully utilize the power of the new pivot grid? Check this blog. Read the blog see detailed used-cases of how you can utilize the pivot grid's power to understand your trading data better.


blog-post-image
By TradesViz On in Introduction

Pivot Grid + Charting: Visualize and analyze ANY statistic and metric on TradesViz

The next big thing on TradesViz journal: An all-in-one grid + pivot table where any column or data can be visualized and explored intuitively. Potential combinations of metrics: 400+ This is by far the most powerful singular trading performance analytics feature available online. Try it out!