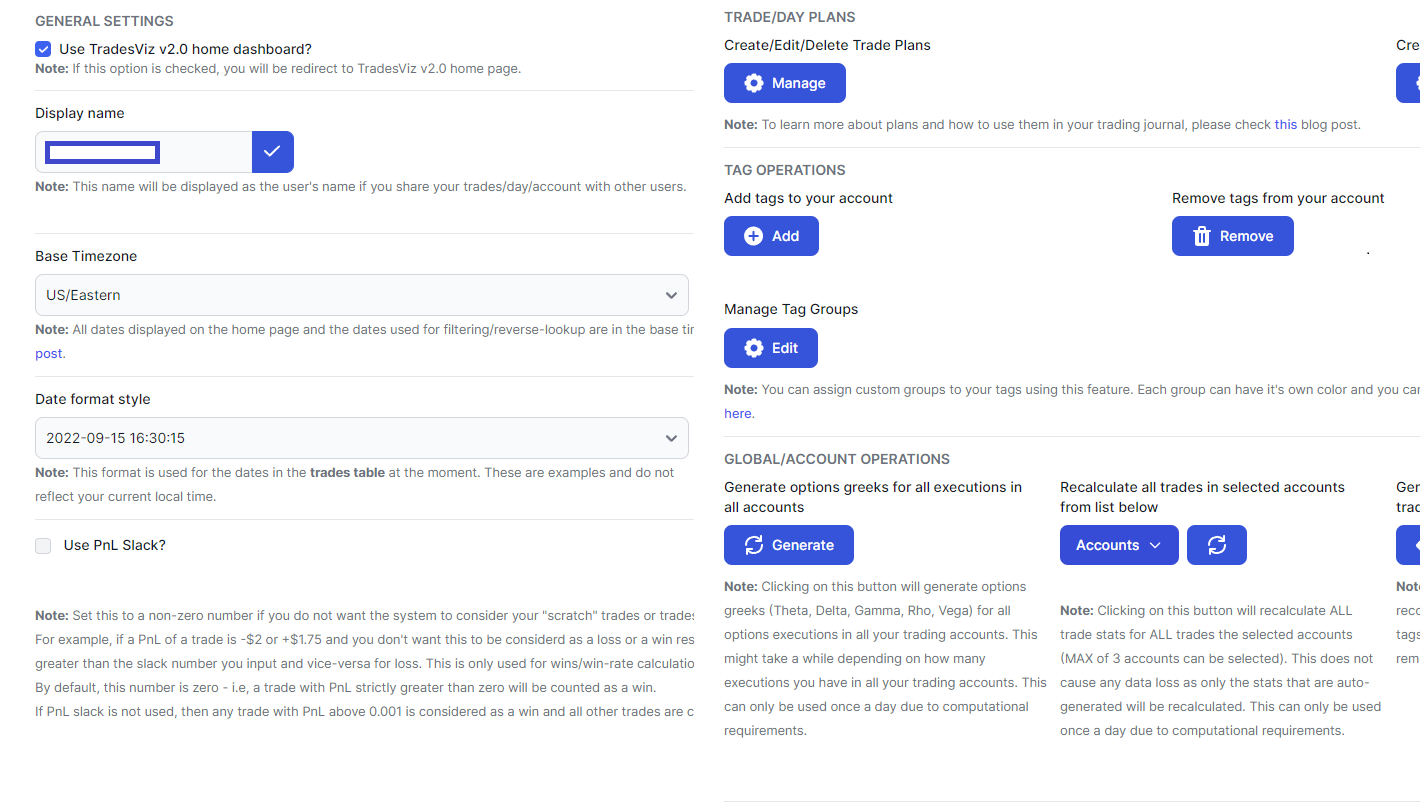
Account settings: Complete guide (TradesViz v2.0 Update)
Adding trading accounts, setting base currency, and more settings and options that affect what you see in your dashboard. [NEW] Updated with 2024 features and tips based on TradesViz v2.0 UI!
Guides, changelogs, deep dives and everything trade journaling.
Adding trading accounts, setting base currency, and more settings and options that affect what you see in your dashboard. [NEW] Updated with 2024 features and tips based on TradesViz v2.0 UI!
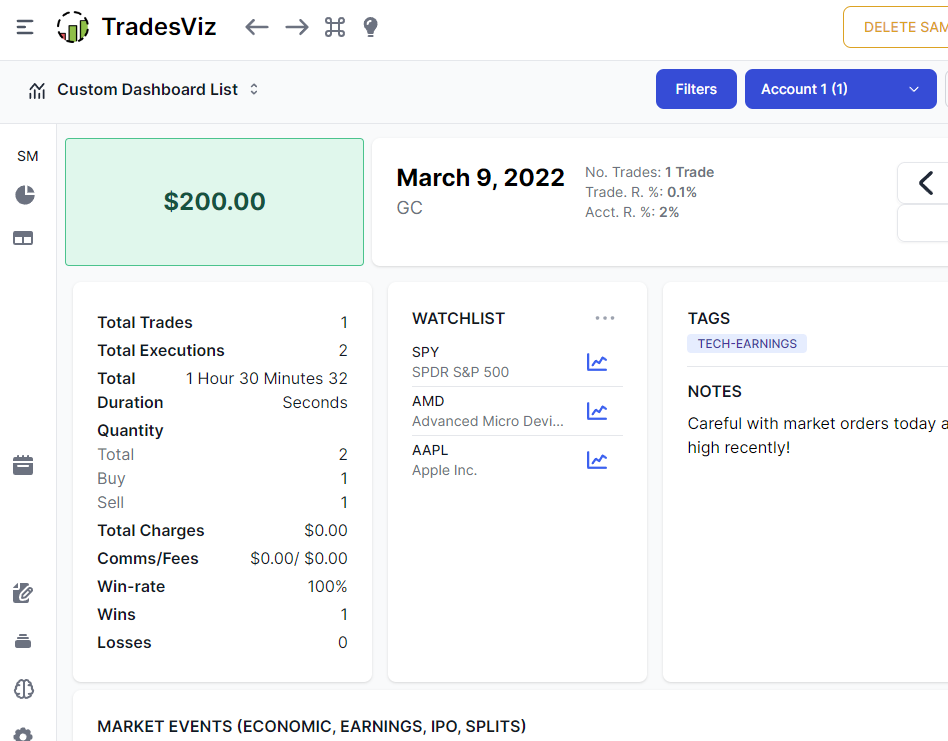
Day explore is a feature unique to TradesViz. It gives you the freedom to plan your trades, view economic events, and earnings, see all the trades you made on any particular day, add charts, and more! After tens of thousands of traders exploring their trading days, we have plenty of feedback and have put it all into the v2 version of the TradesViz Day Explore.
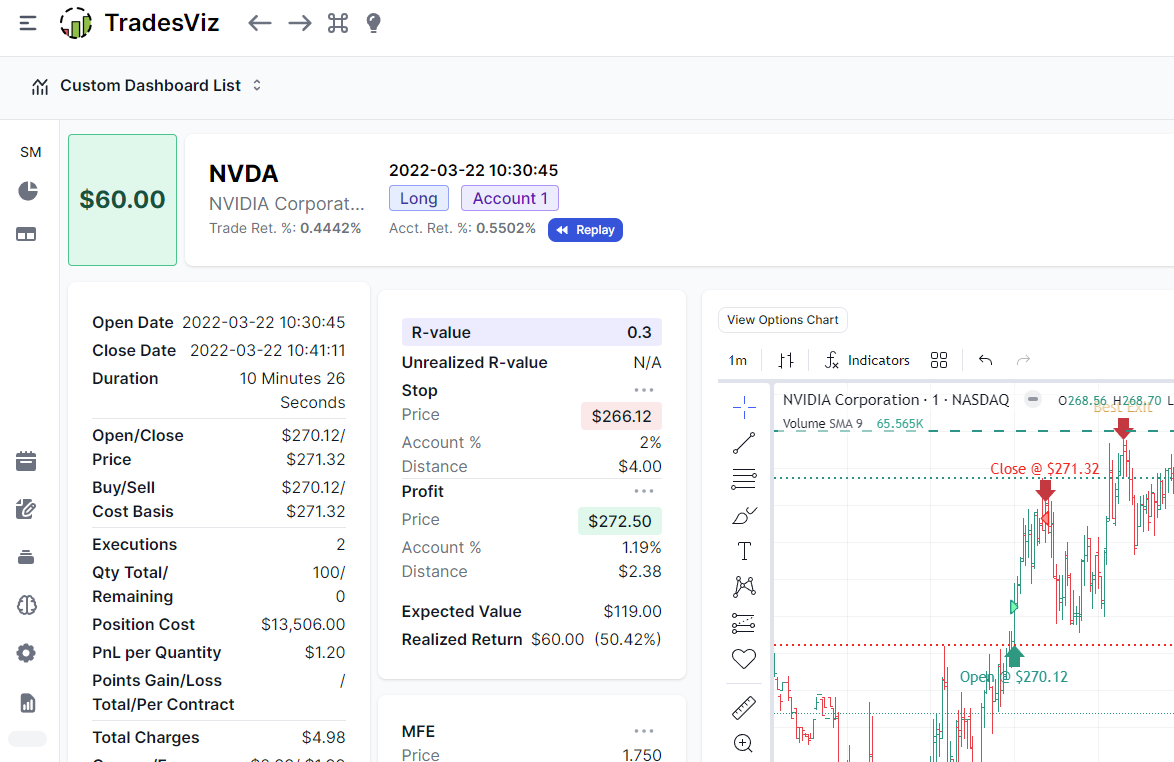
The first time we introduced the TradesViz trade explore tab was in 2020. There have been huge improvements in this whilst still preserving the originality and efficiency of viewing details about your trades. After millions of visits by tens of thousands of traders and many feedback and improvement suggestions, this blog will explore the current state of the most detailed trade information view available in any online trading journal.
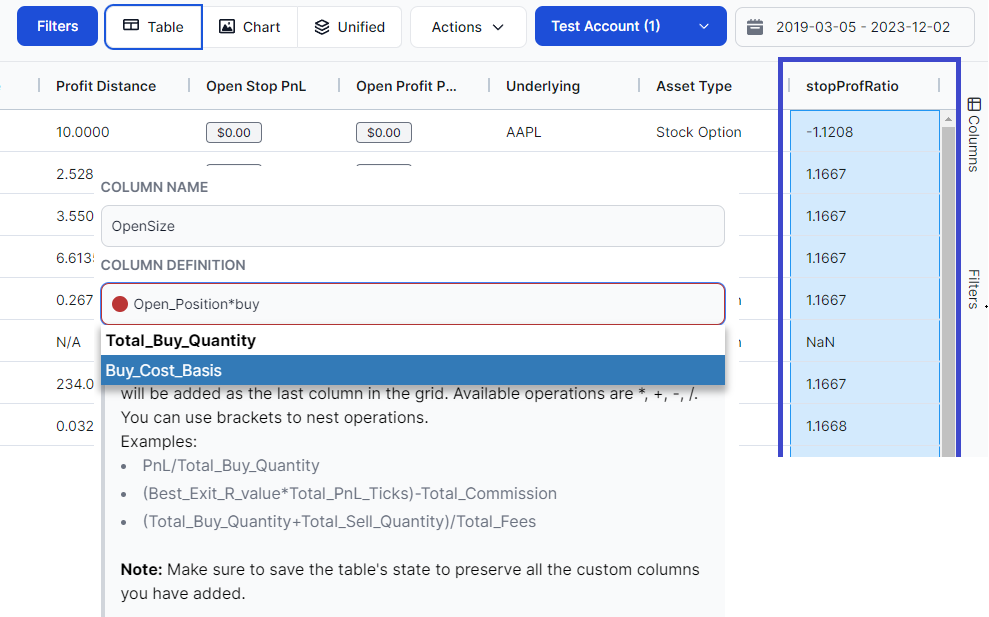
You can now create custom columns on the TradesViz trades table - another addition to the most customizable and the most versatile trading journal table in the world!
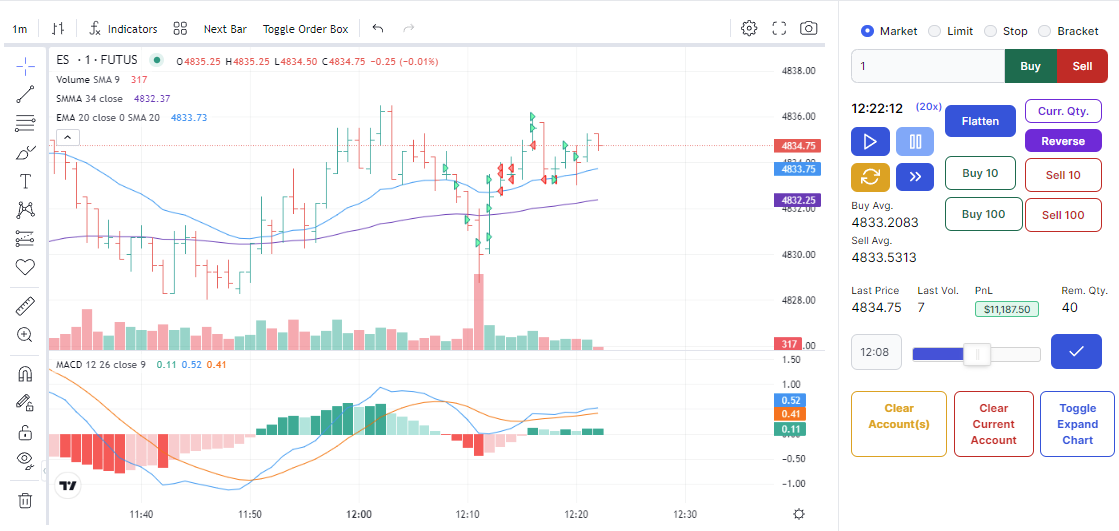
On top of being the most powerful trading journal in the world, we also offer stock, forex, futures, and options simulation - yes, real, second-by-second simulation for all asset types. How can you effectively use this? How is this tied to your trading account? What are the different ways to practice? This all-in-one guide will explore all these questions and more!
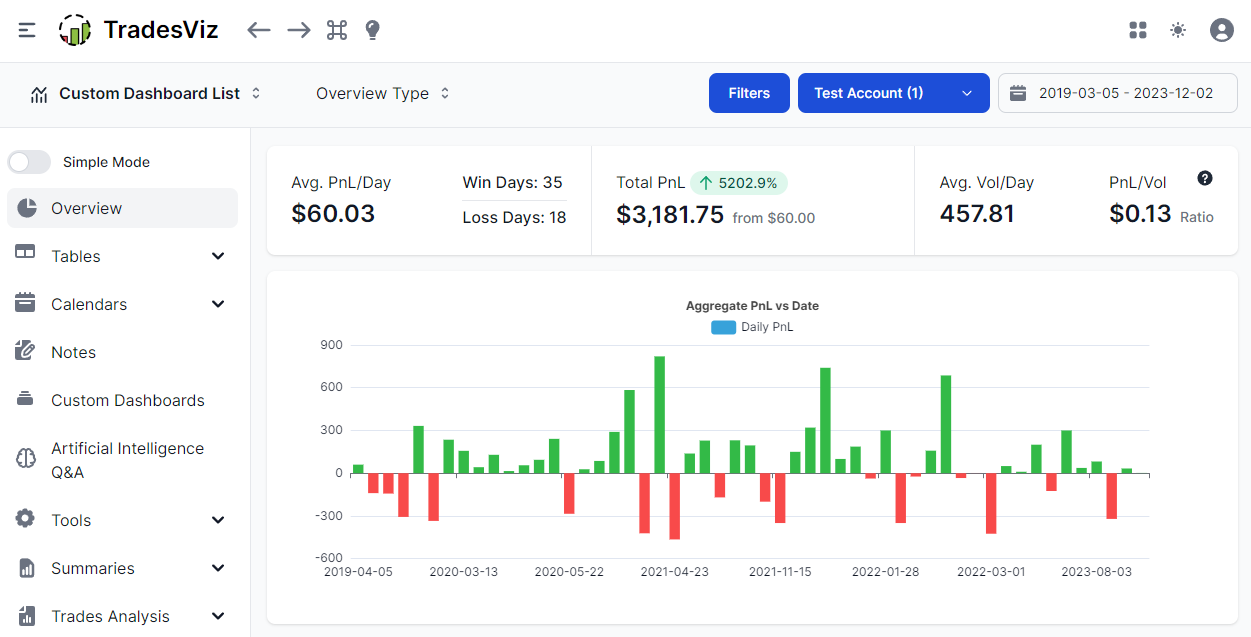
This is an all-in-one guide to get you up to speed on how to journal, analyze and manage your trades on TradesViz. Go from zero to trade journaling expert in under 1 hour.
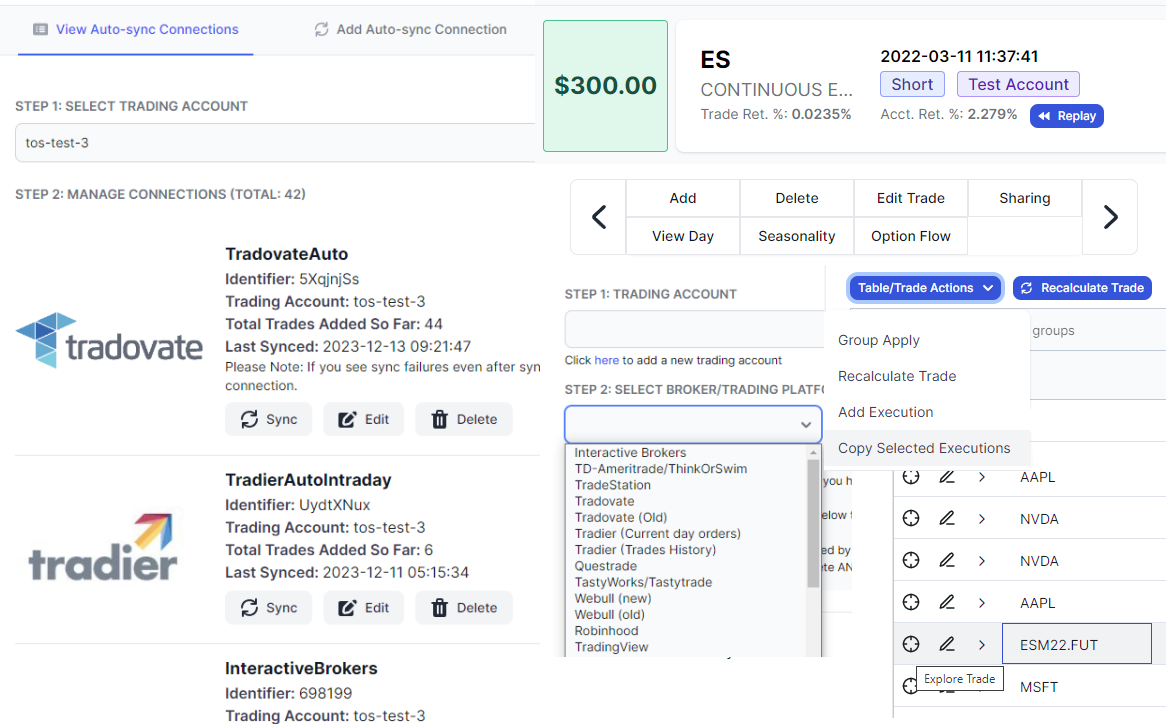
Importing trades from files, syncing trades from brokers, real-time sync indicators, and adding executions manually - there are plenty of ways to get your trades into TradesViz. This blog post lists and summarizes them all!
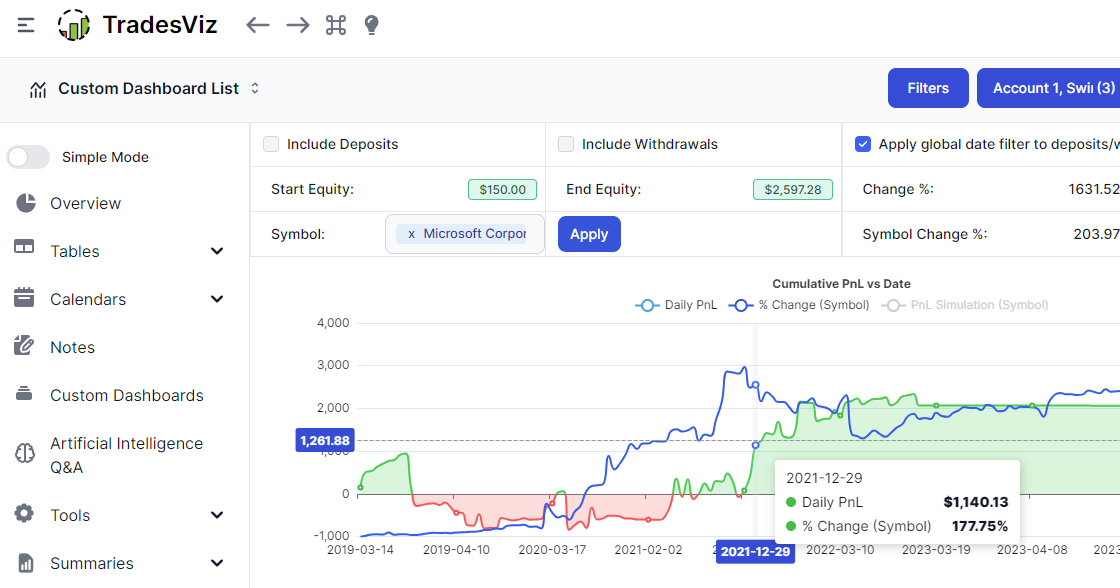
A perfect year-end feature! Compare your overall trading equity curve to ANY symbol - including indices, ETFs, etc., How did you fare against the market? This helps you understand and answer that question!
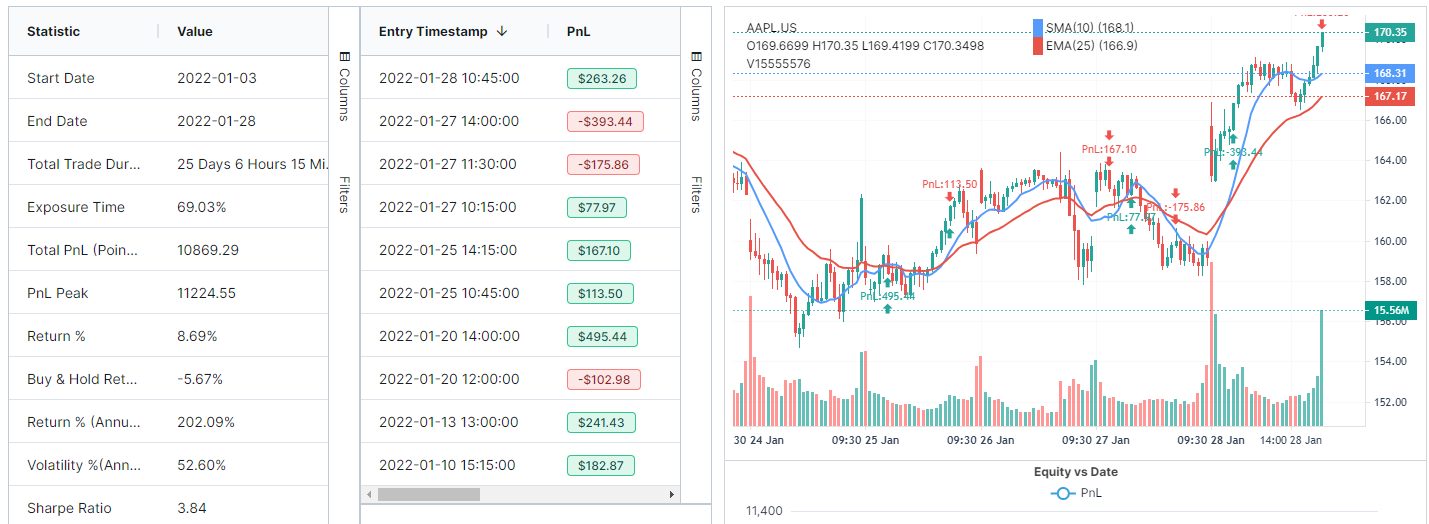
Another big addition to the TradesViz platform: A full-fledged backtester for any asset type on any timeframe with almost any indicator combination. Powered by the infinitely flexible EZstockscreener, you can now do quick and easy backtesting on TradesViz itself.
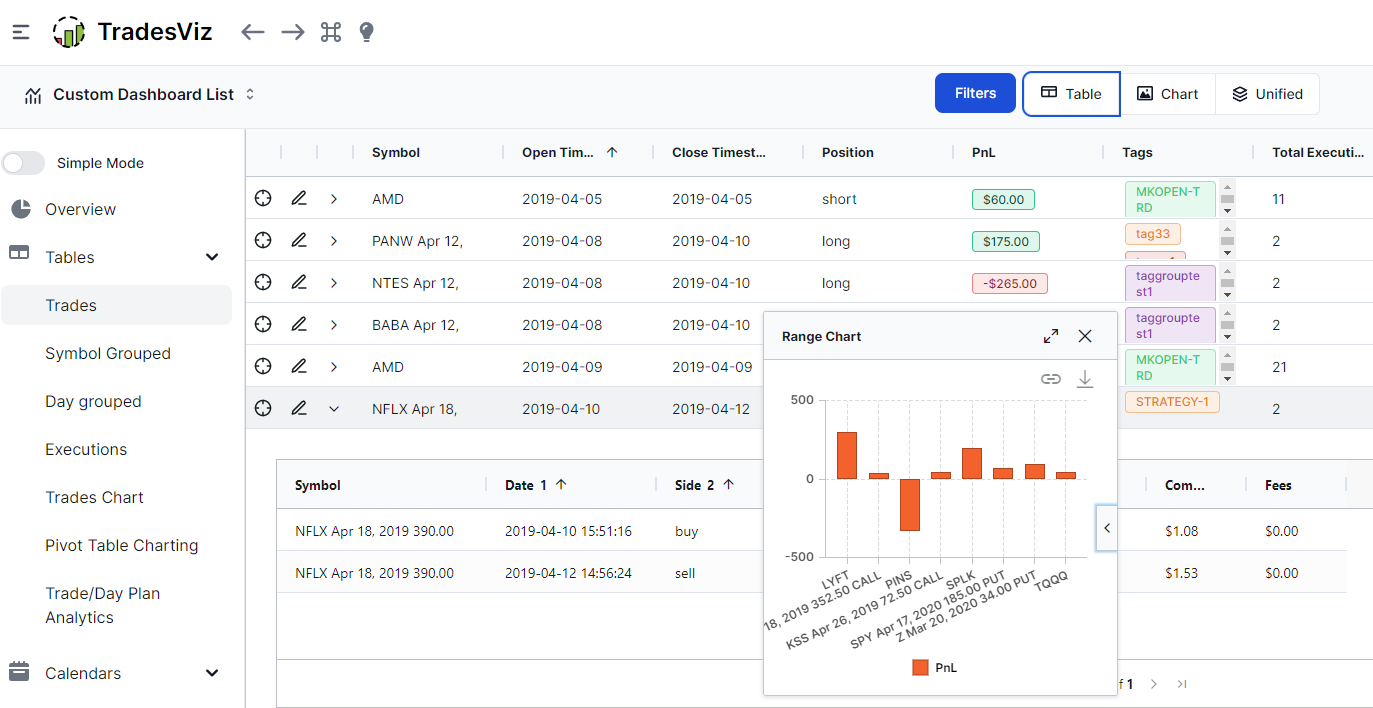
With the introduction of TradesViz v2.0, we have completely changed all the tables of the main dashboard to be based on advanced and flexible grids. Read on to learn more about the new features and just how much better this is compared to any other tabular journaling solutions out there.
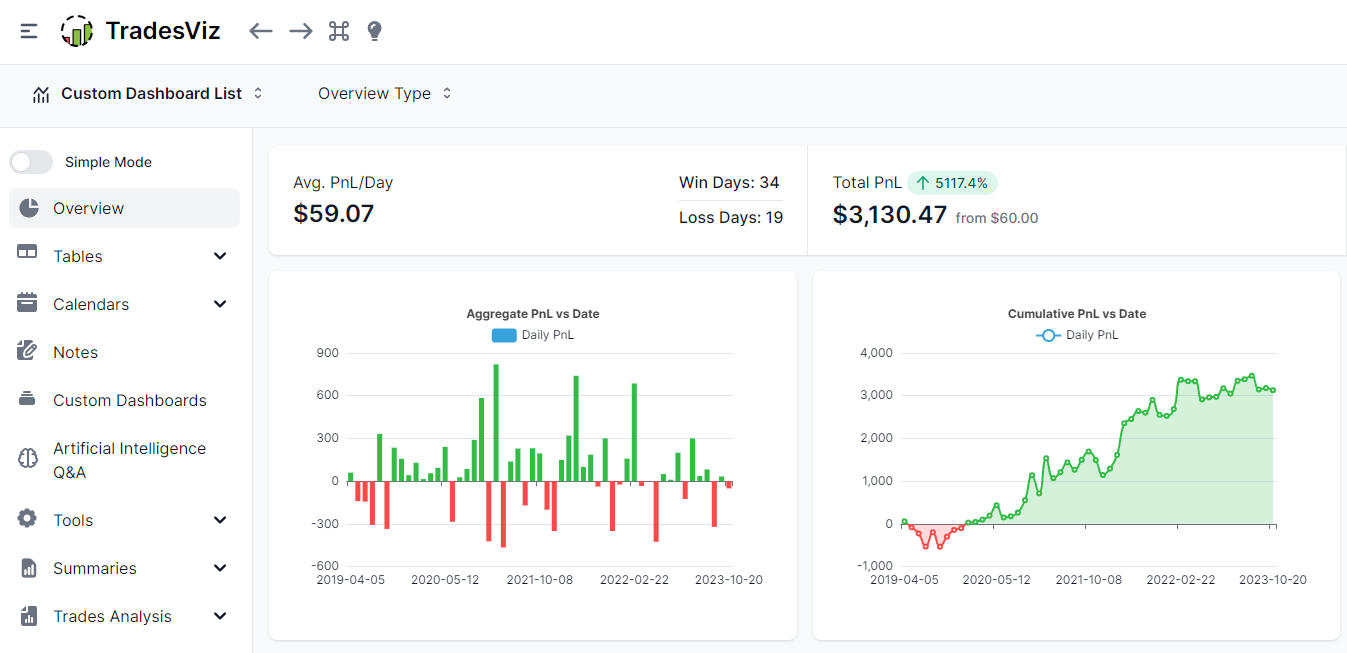
Introducing TradesViz v2.0. The entire dashboard is completely redesigned with state-of-the-art charts and tables to make journaling smooth and seamless for users of all experience levels and on all devices!
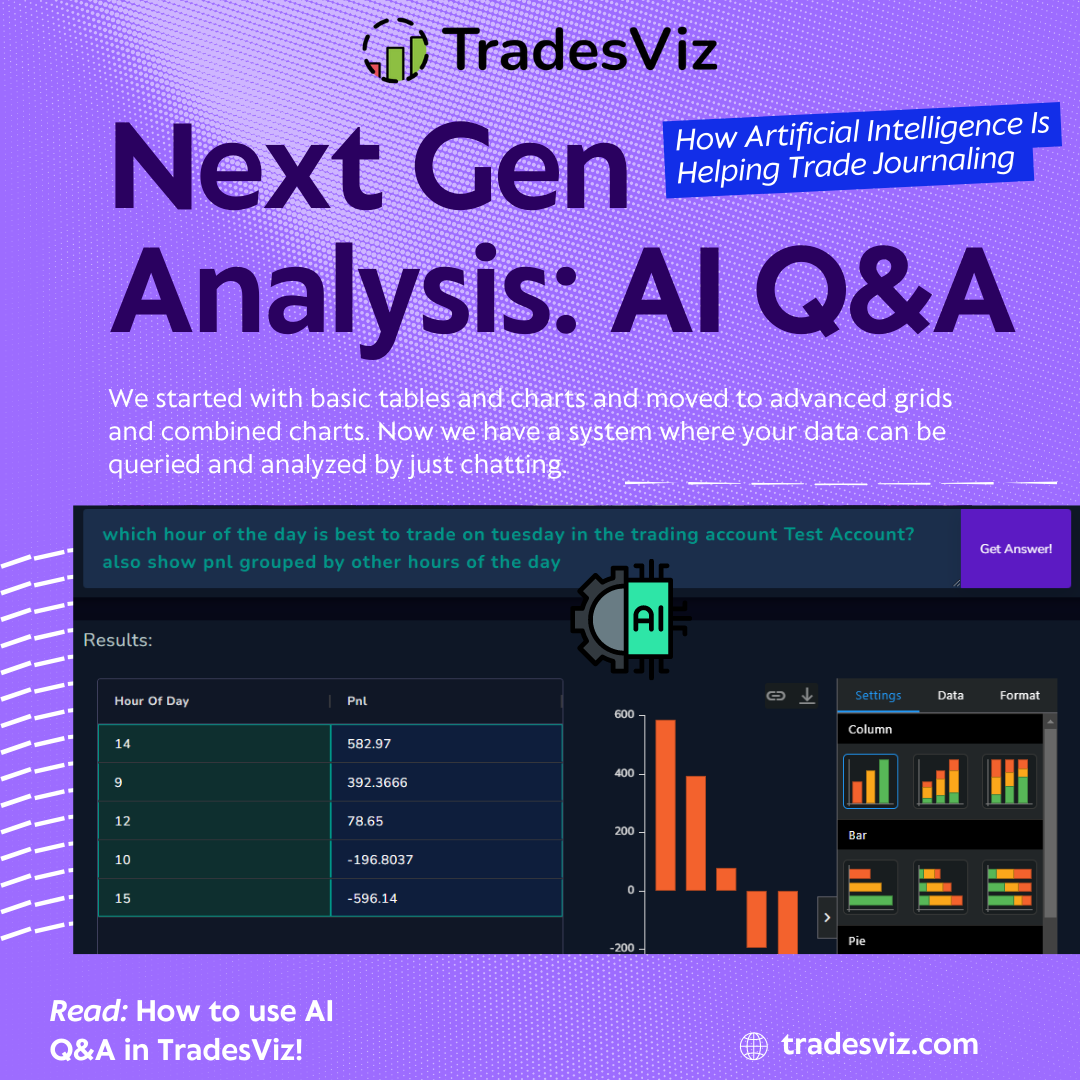
Are you ready to find answers to all your burning trading questions? Have you wished there was a way to visualize a particular stat? The TradesViz's AI query will solve a lot of your trading problems! Read this guide to get a list of queries you can use every day to find deeper insights!
We have 64 detailed guides for connecting your broker and importing trades.
View all integrations & import guides