Introduction
6 min read
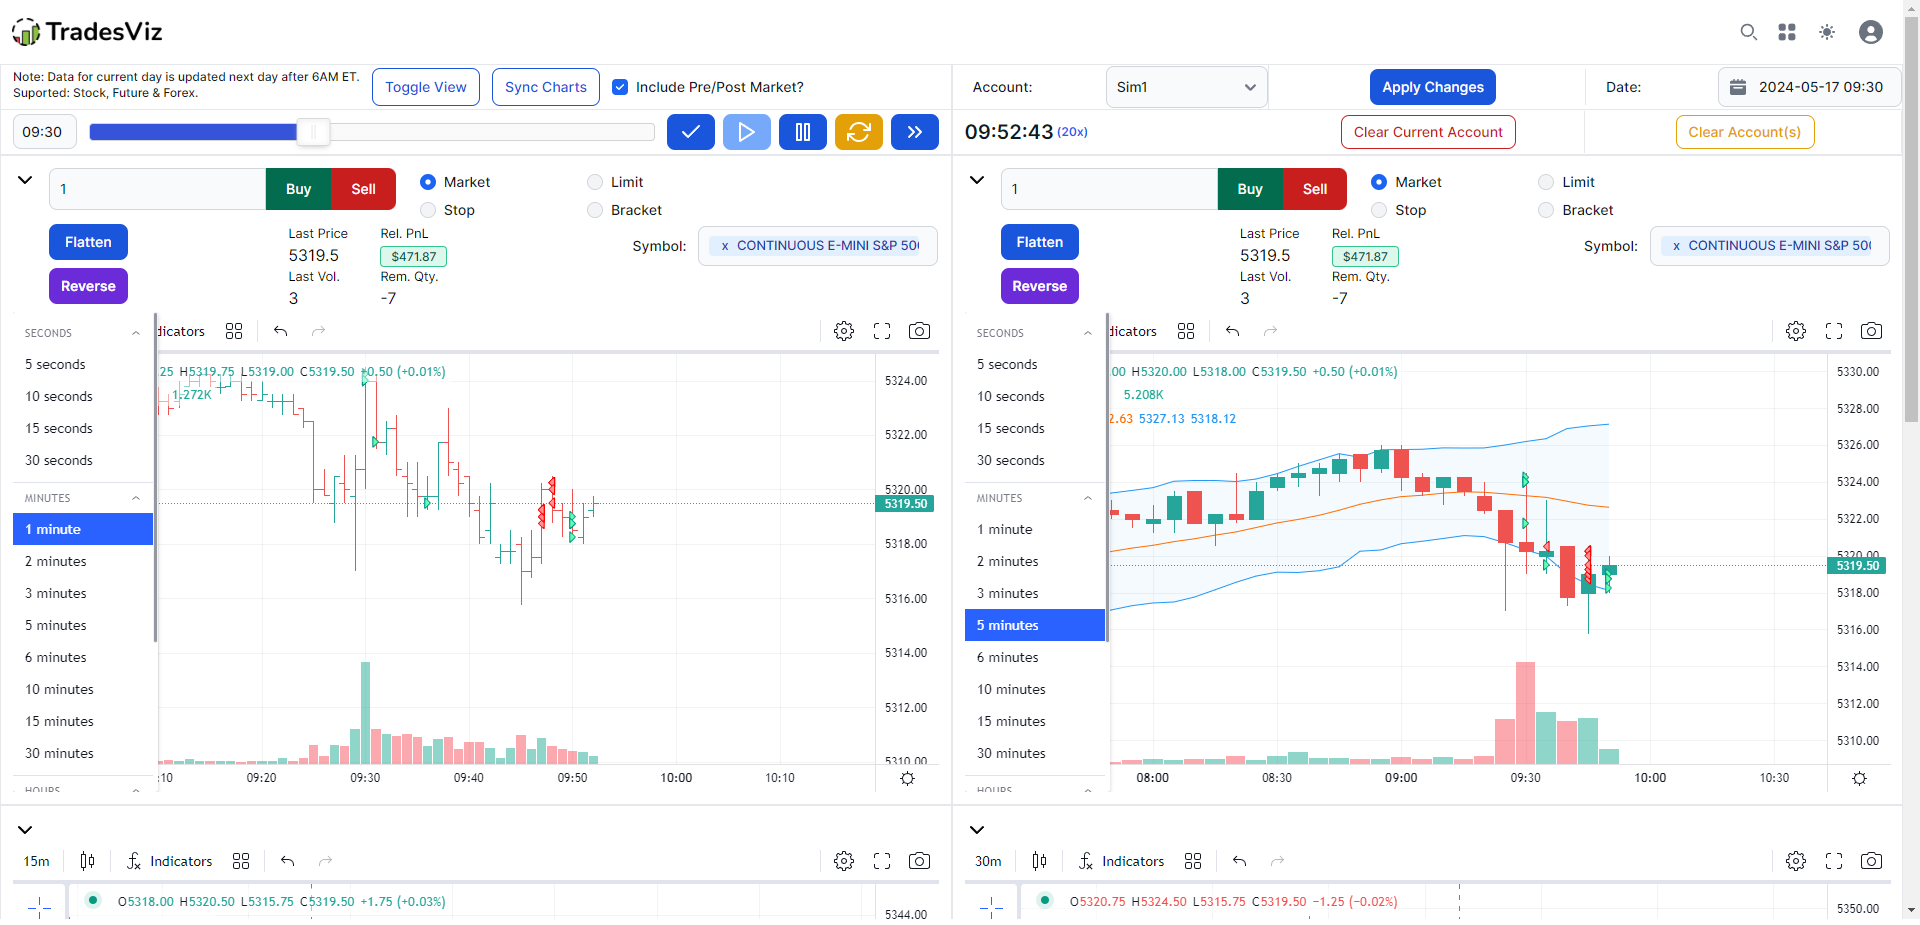
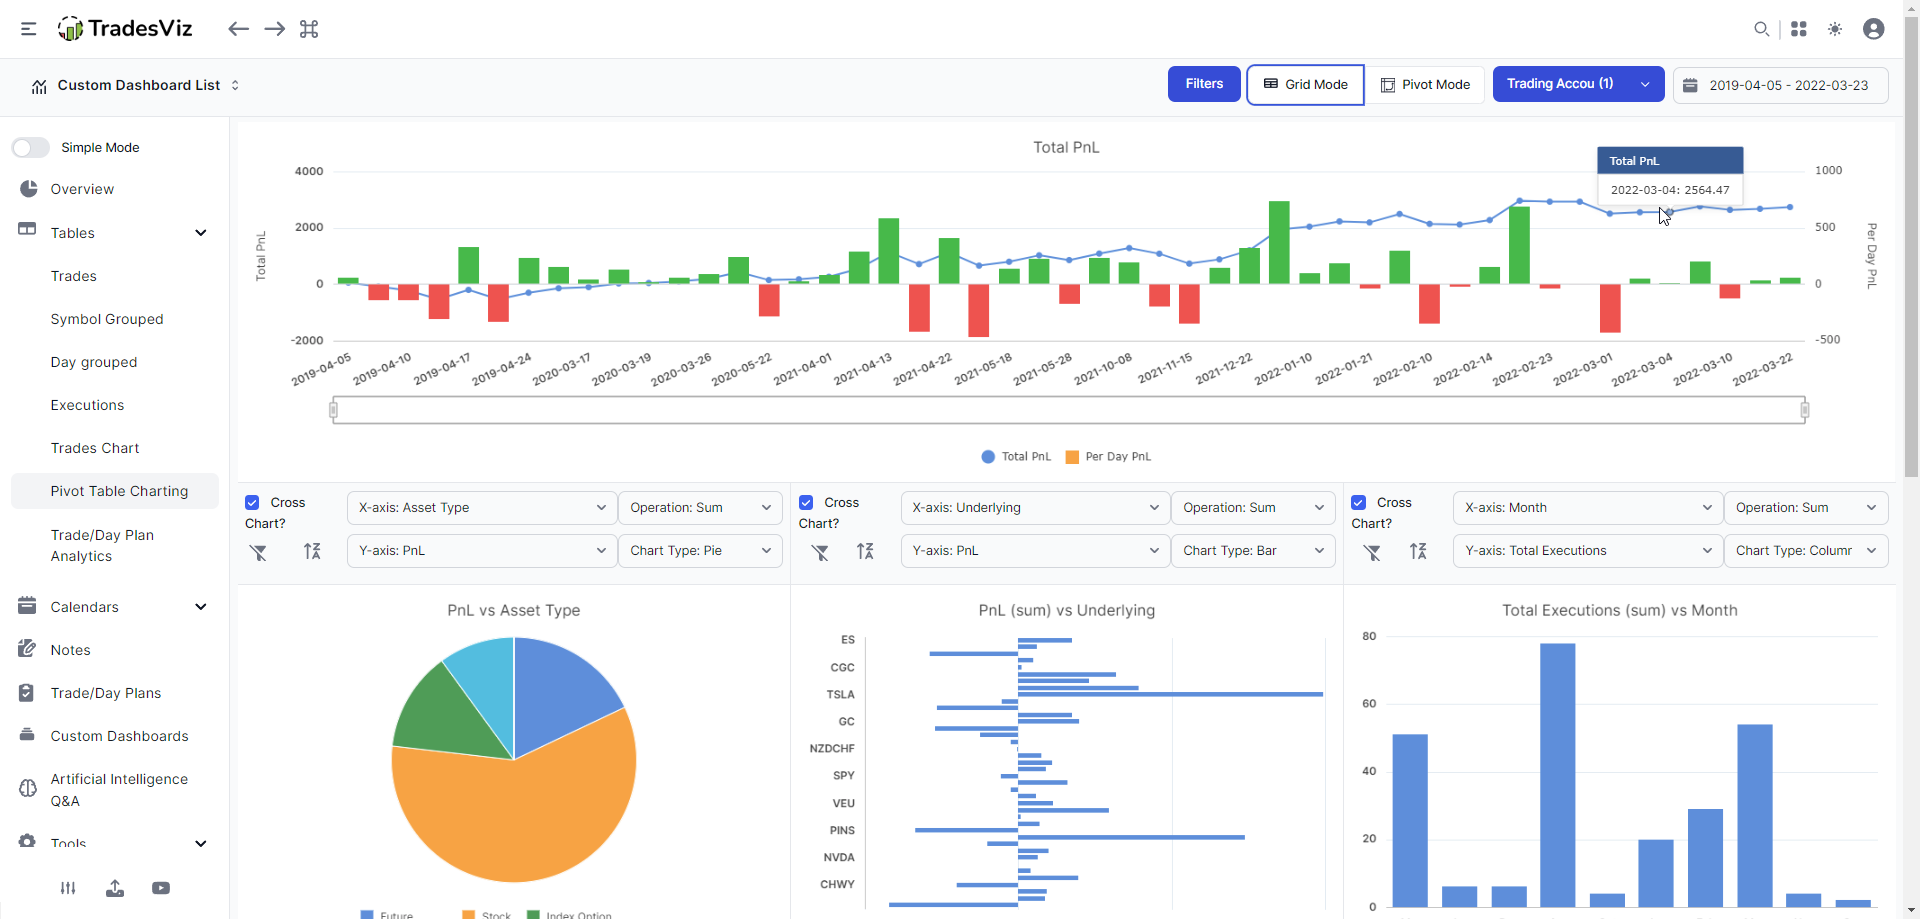
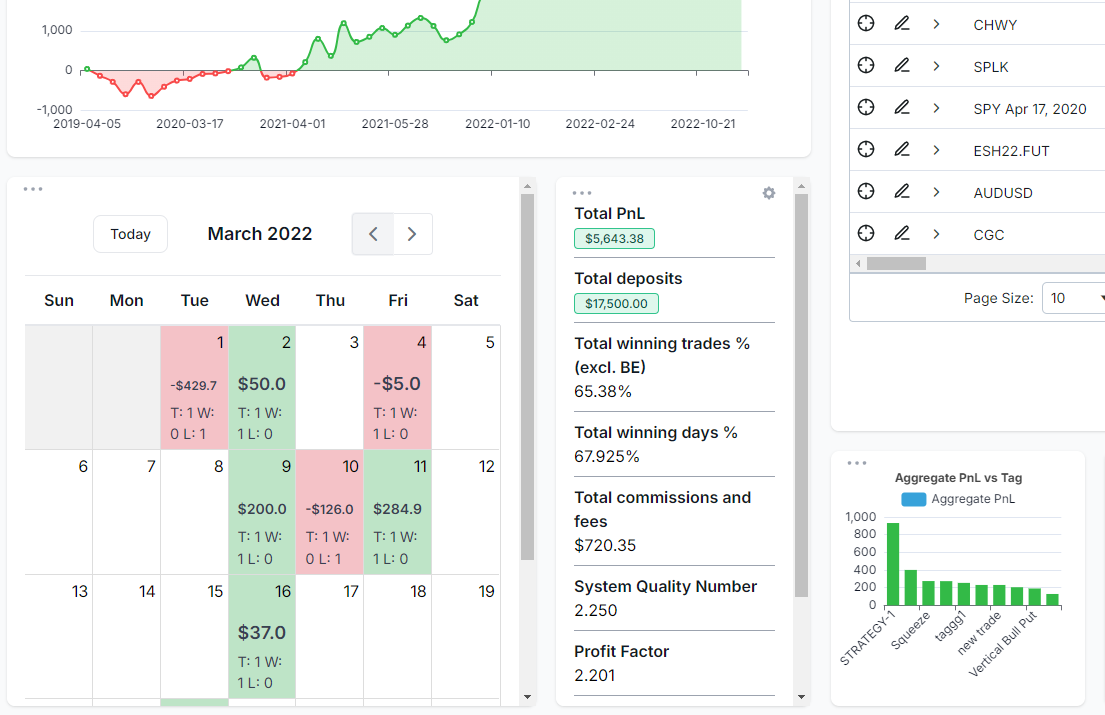
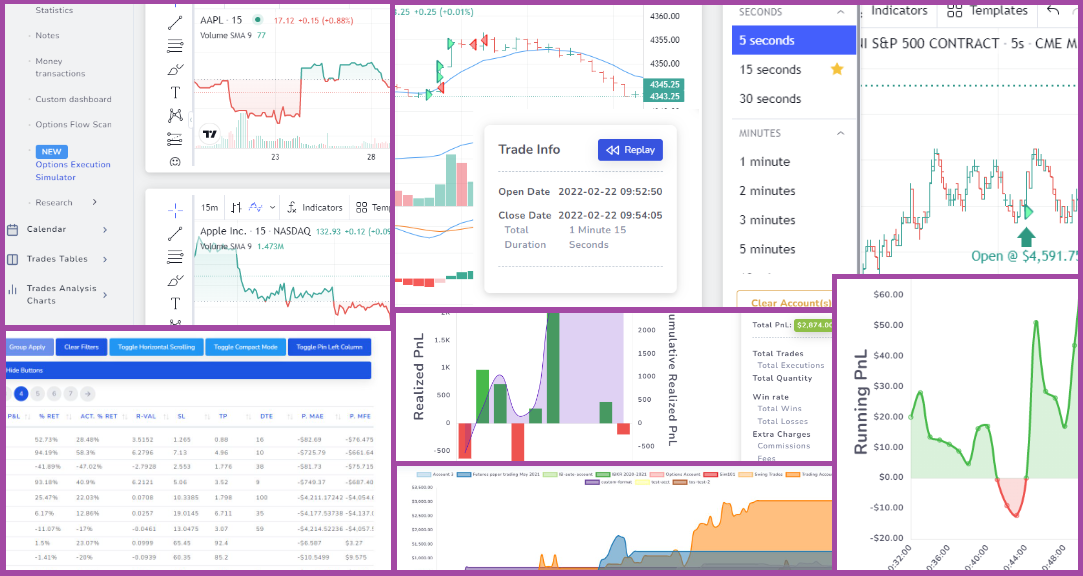
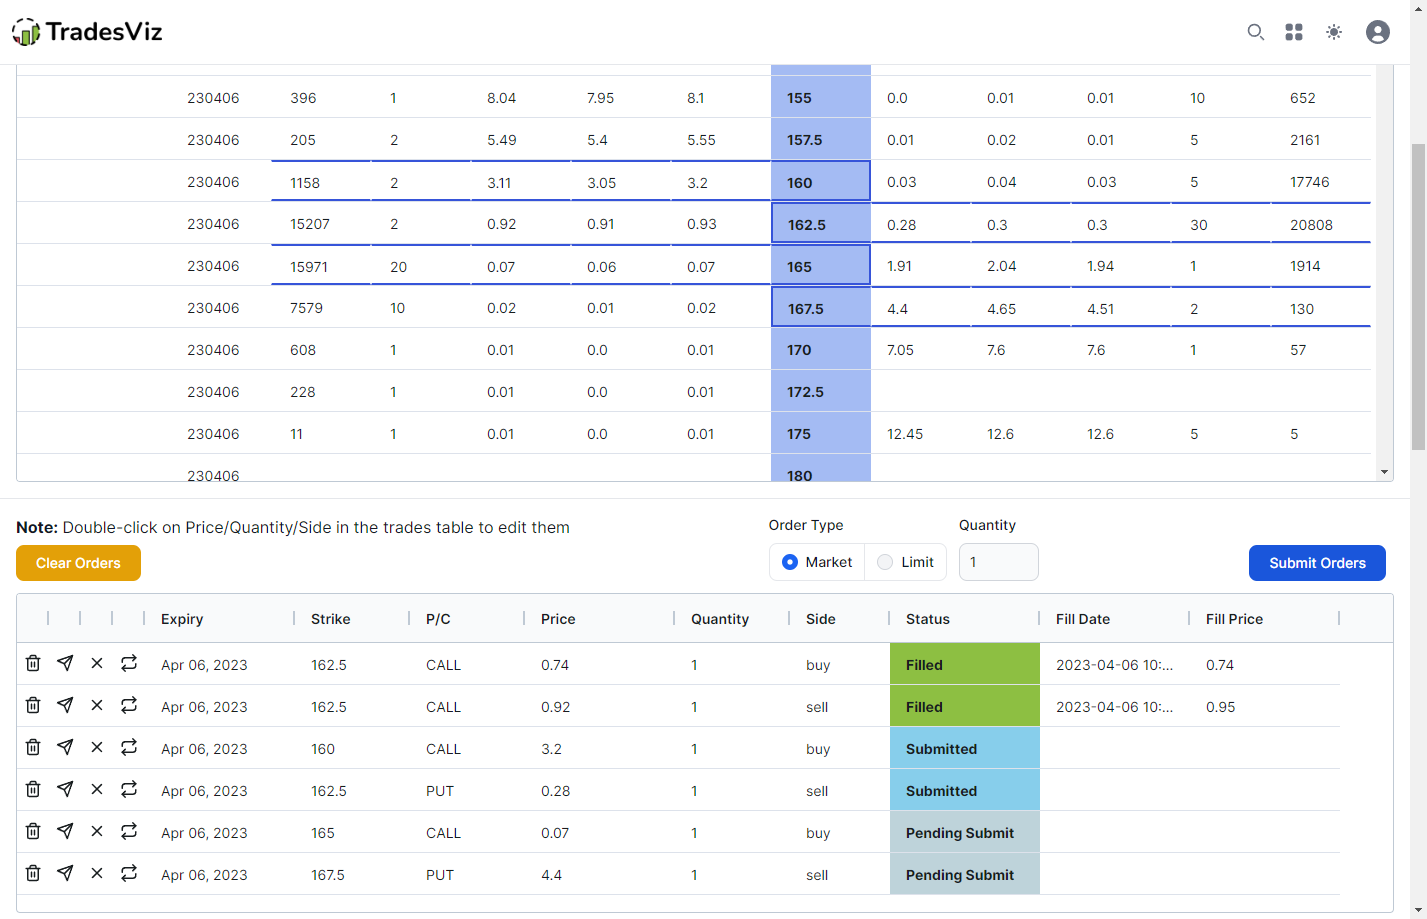
Full-fledged Options Chain Simulator in TradesViz
A full options simulator with the capability to execute and simulate any options spread/strategy! For the first time in the trade journaling world, TradesViz now has the complete simulation package: stock, forex, futures, AND options. Looking to practice your options trading? There's no better tool than the TradesViz options simulator!