By
TradesViz
On
in
How-To
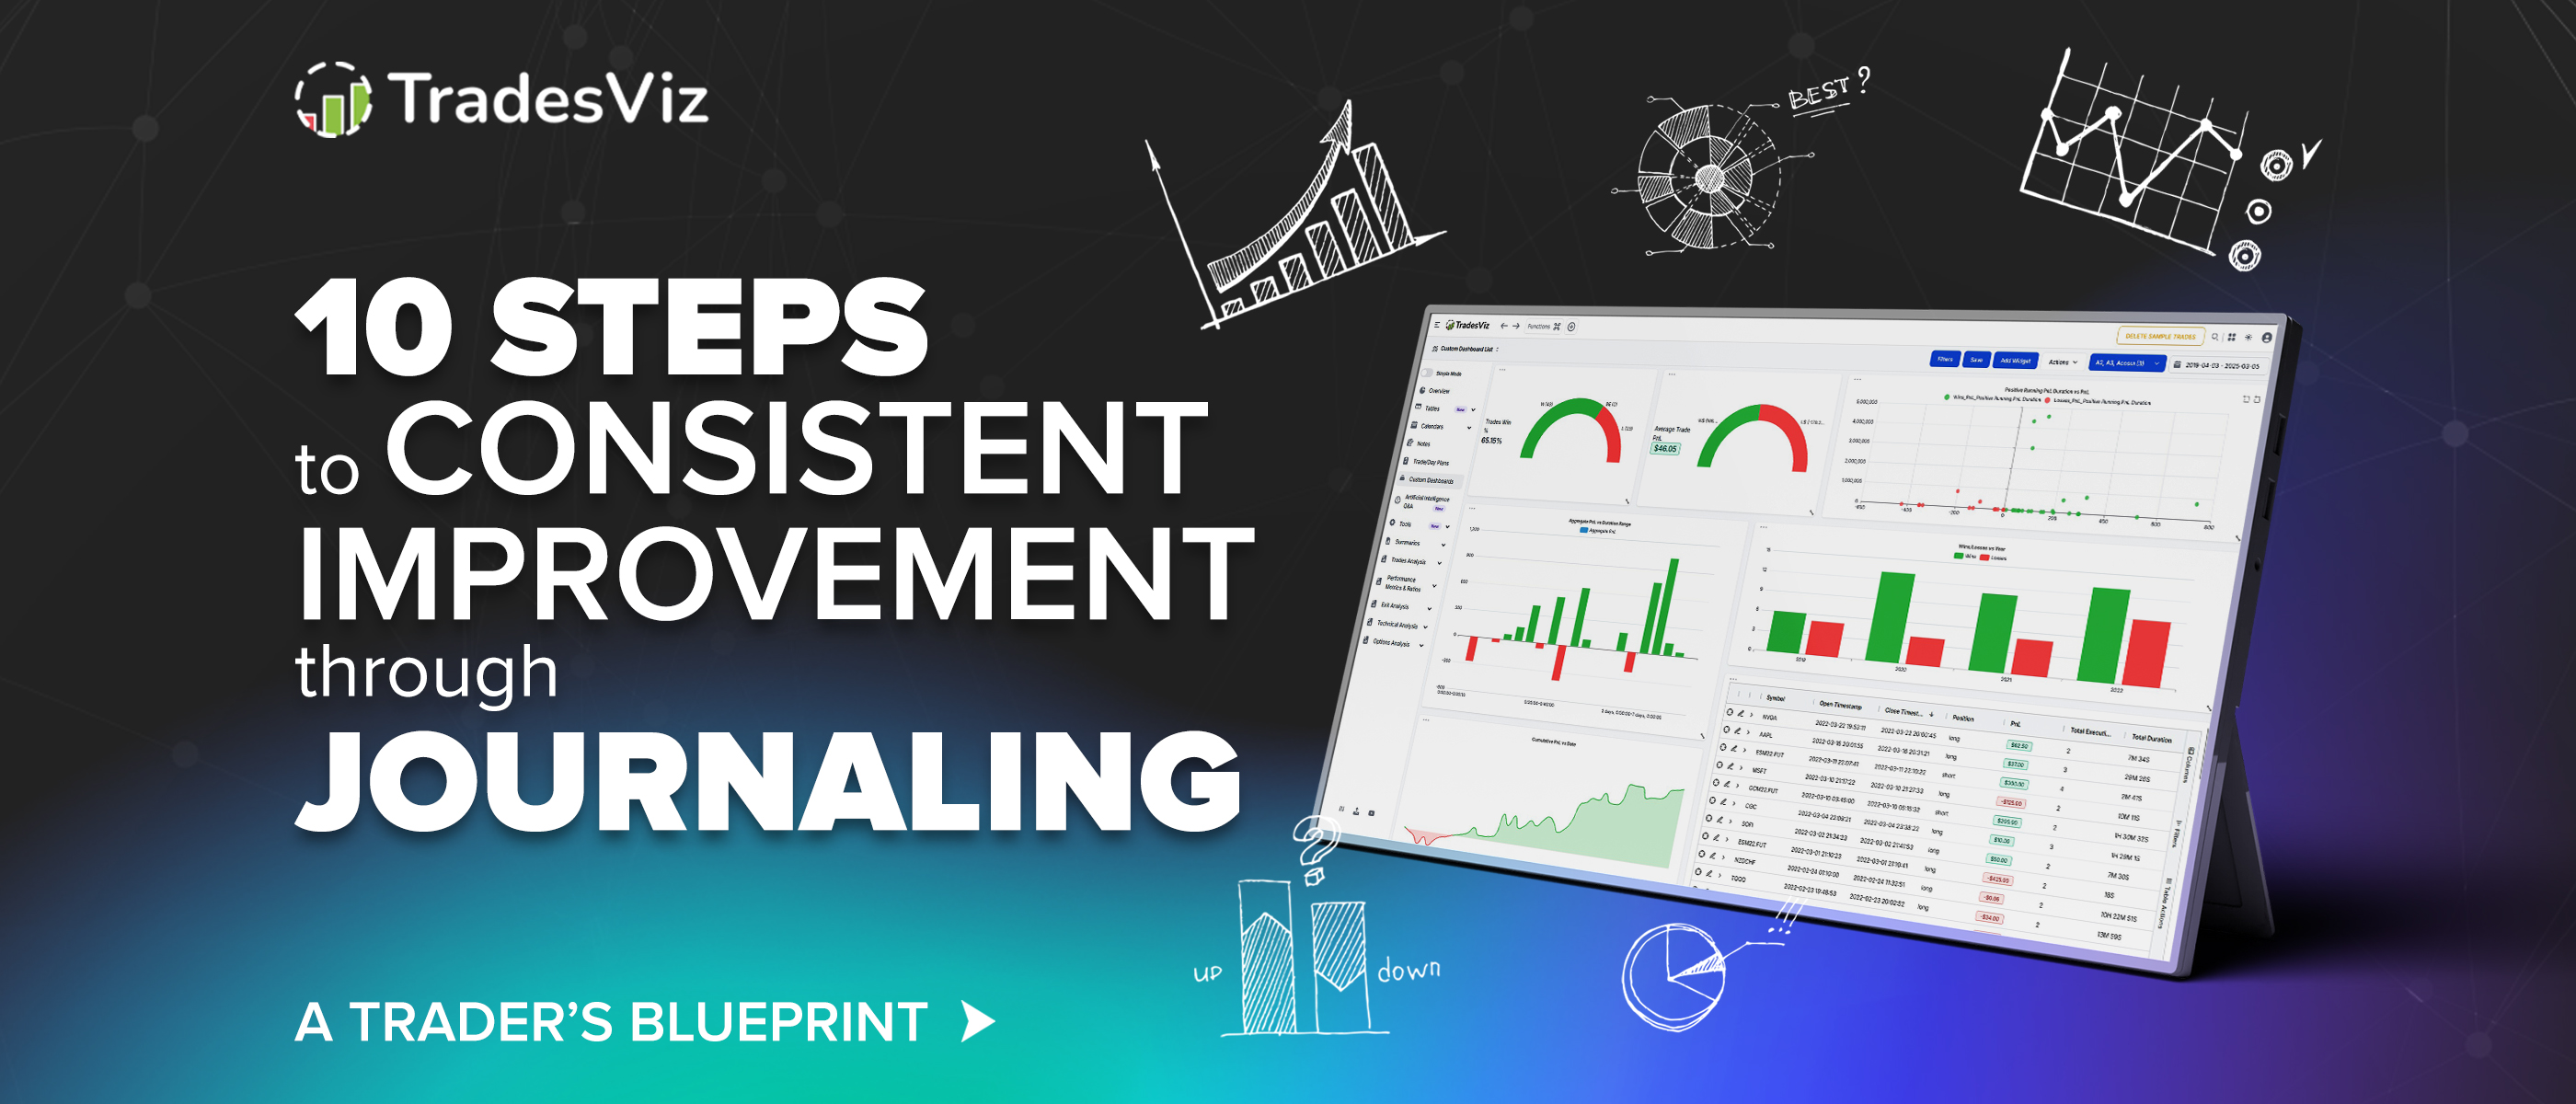
The Trader's Blueprint: 10 Steps to Consistent Improvement Through Journaling
Tired of not knowing where to start with trade journaling? this blog post should answer everything you need to know.
By
TradesViz
On
in
Auto Import Trades
Auto import trades from Hyperliquid
Auto-import your trades from Hyperliquid!
By
TradesViz
On
in
Introduction
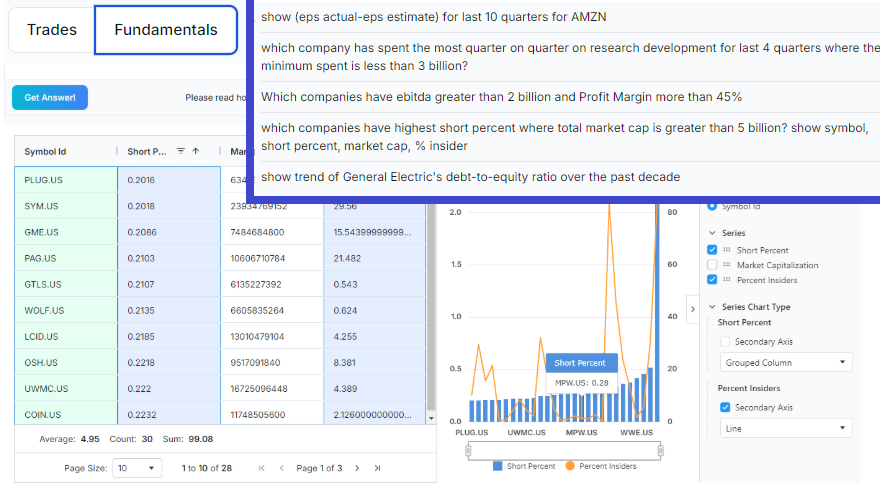
Fundamentals AI Q&A: Explore stock fundamentals using AI
Explore tens of thousands of stocks from supported exchanges/countries using AI right here on TradesViz. Just like our AI Q&A, you can now query stock fundamentals using our new AI agent.
By
TradesViz
On
in
Auto Import Trades
Auto import trades from WOOX
Auto-import your trades from WOOX!
By
TradesViz
On
in
General
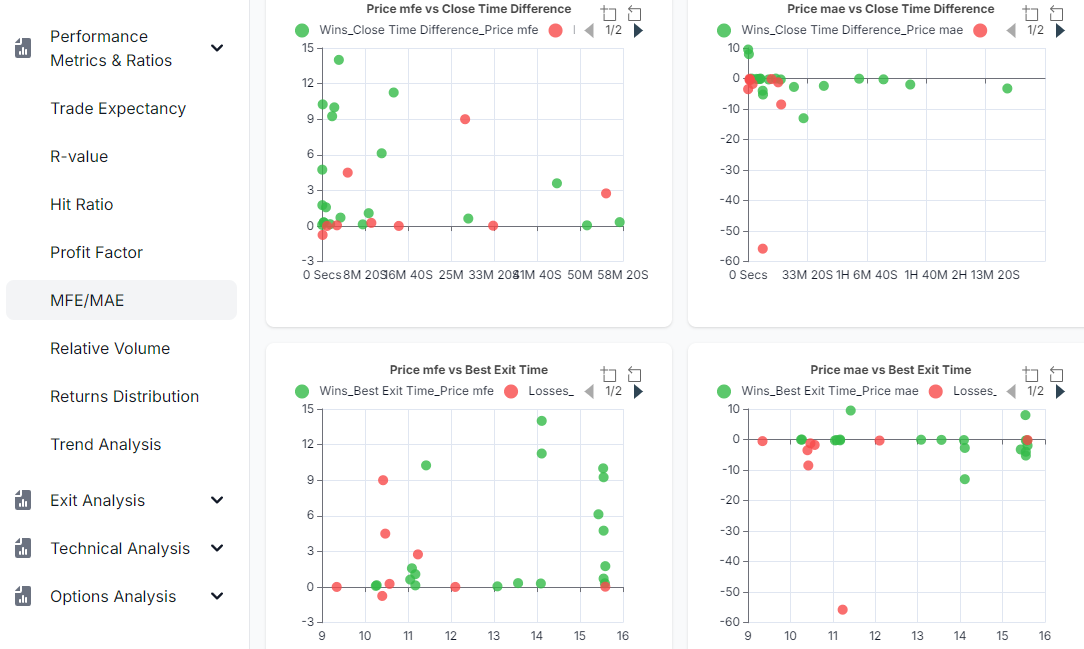
MFE and MAE Updates: Analysis of duration to MFE and MAE
Usage of MAE/MAE has exponentially risen in the last year. What more can we extract from this crucial data? In this blog post, we explore the distance factor from MFE/MAE to open, close, and best exit.
