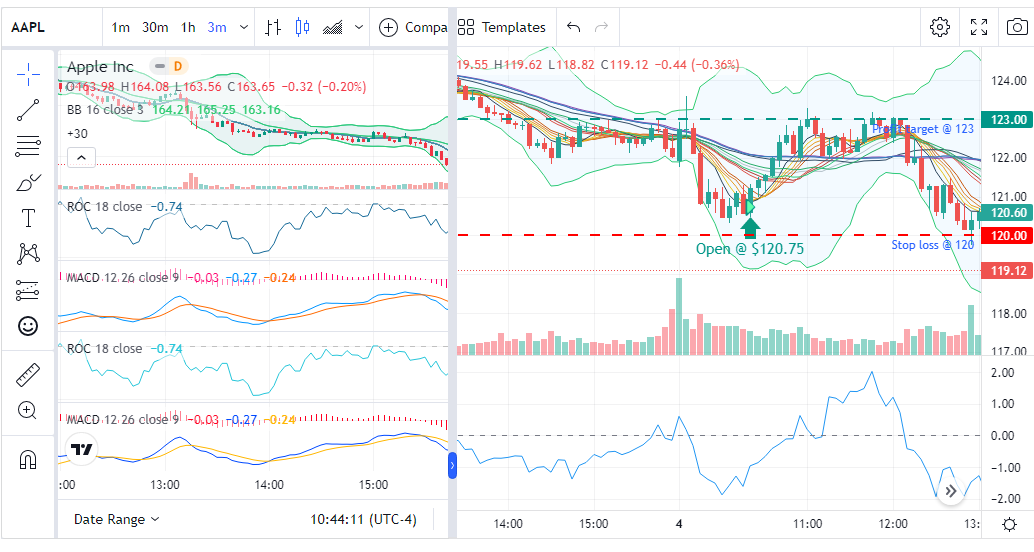
Create custom TradingView chart setups for all your trades!
Create a TradingView setup that will be auto-imported/applied to your technical analysis charts whenever you explore any trade.
Guides, changelogs, deep dives and everything trade journaling.
Create a TradingView setup that will be auto-imported/applied to your technical analysis charts whenever you explore any trade.
We have had yearly and monthly views. Now, you can get in-depth with your PnL stats for each week!
Overwhelmed by the features of TradesViz? Do you think it's too much for you? Read this post and learn more on how you can get max value out of your account all while keeping things super simple!
You can now share the entire trading performance of your trading account(s) via a simple public dashboard - choose exactly what data you want to share. It's your data - you have complete control over what you want to share with your fellow traders!
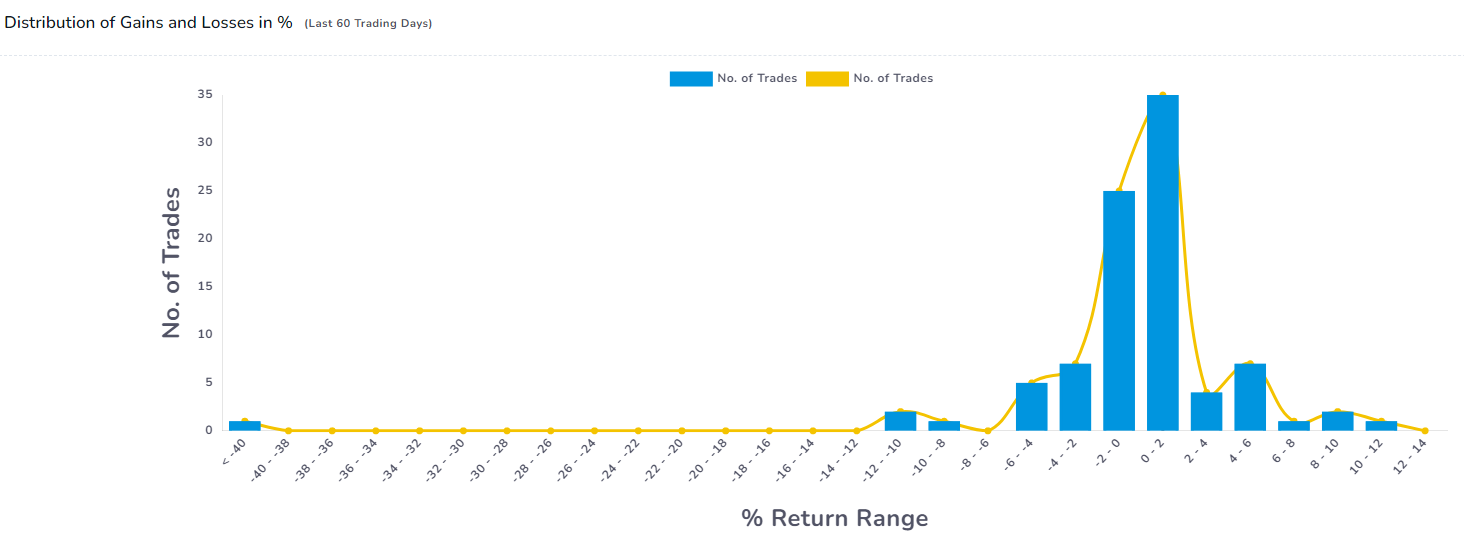
We have a few sets of charts that can help provide more value to your analysis and pinpoint the set of trades that you need to improve - Distribution curves and also DRMA curve.
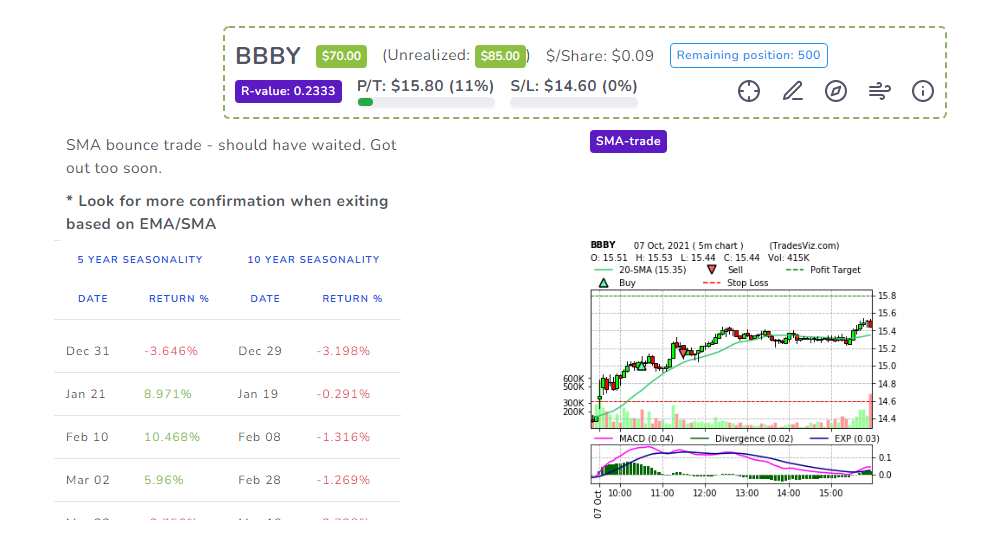
PnL, Unrealized PnL, Risk info, Comments/Tags, Recent options flow, Upcoming seasonality prediction, and more... View all of this in a single tab for all your trades. Use every piece of market info to hone your trading edge and make trading simpler.
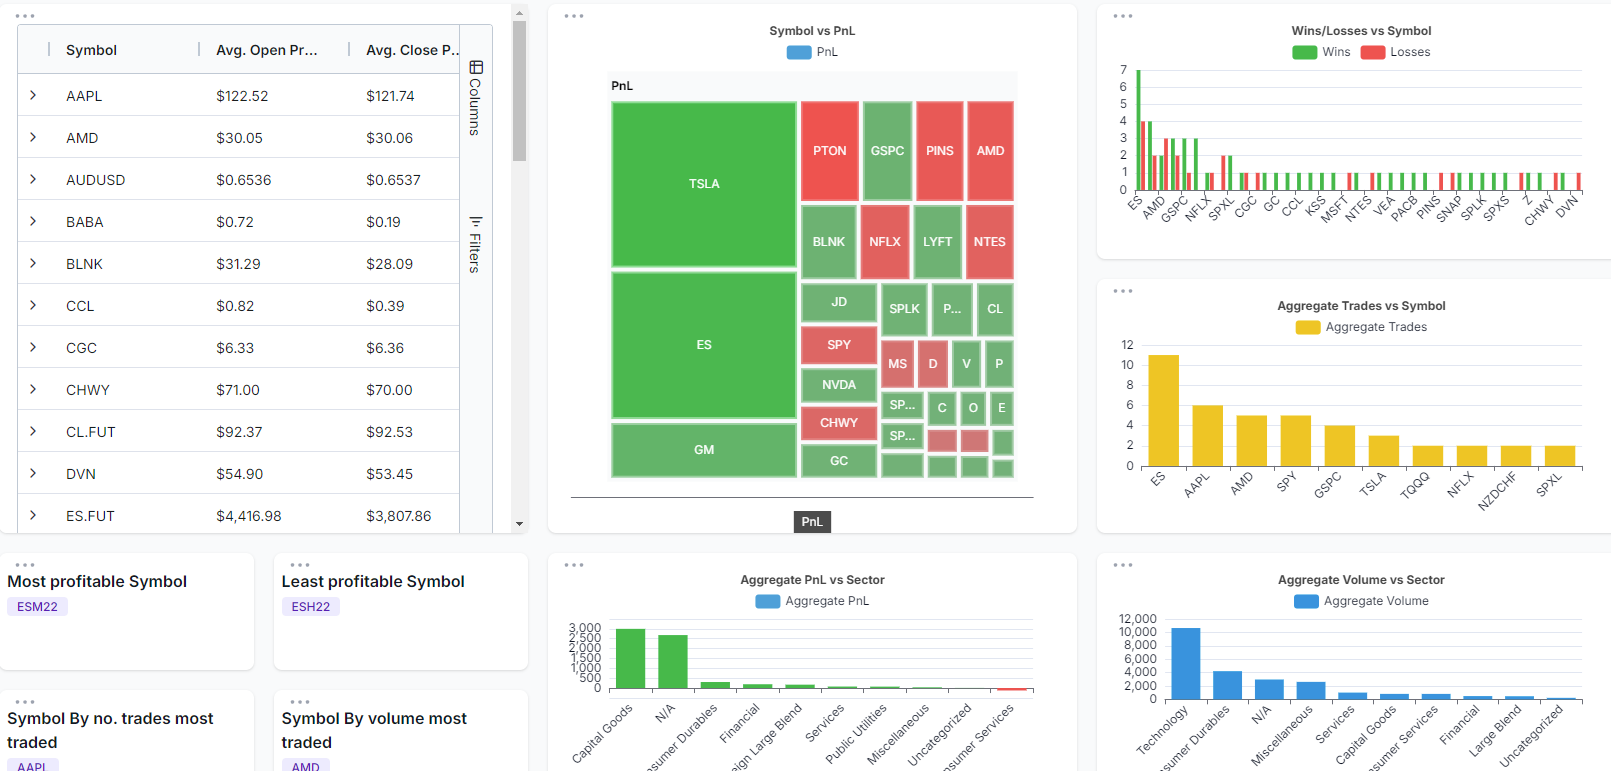
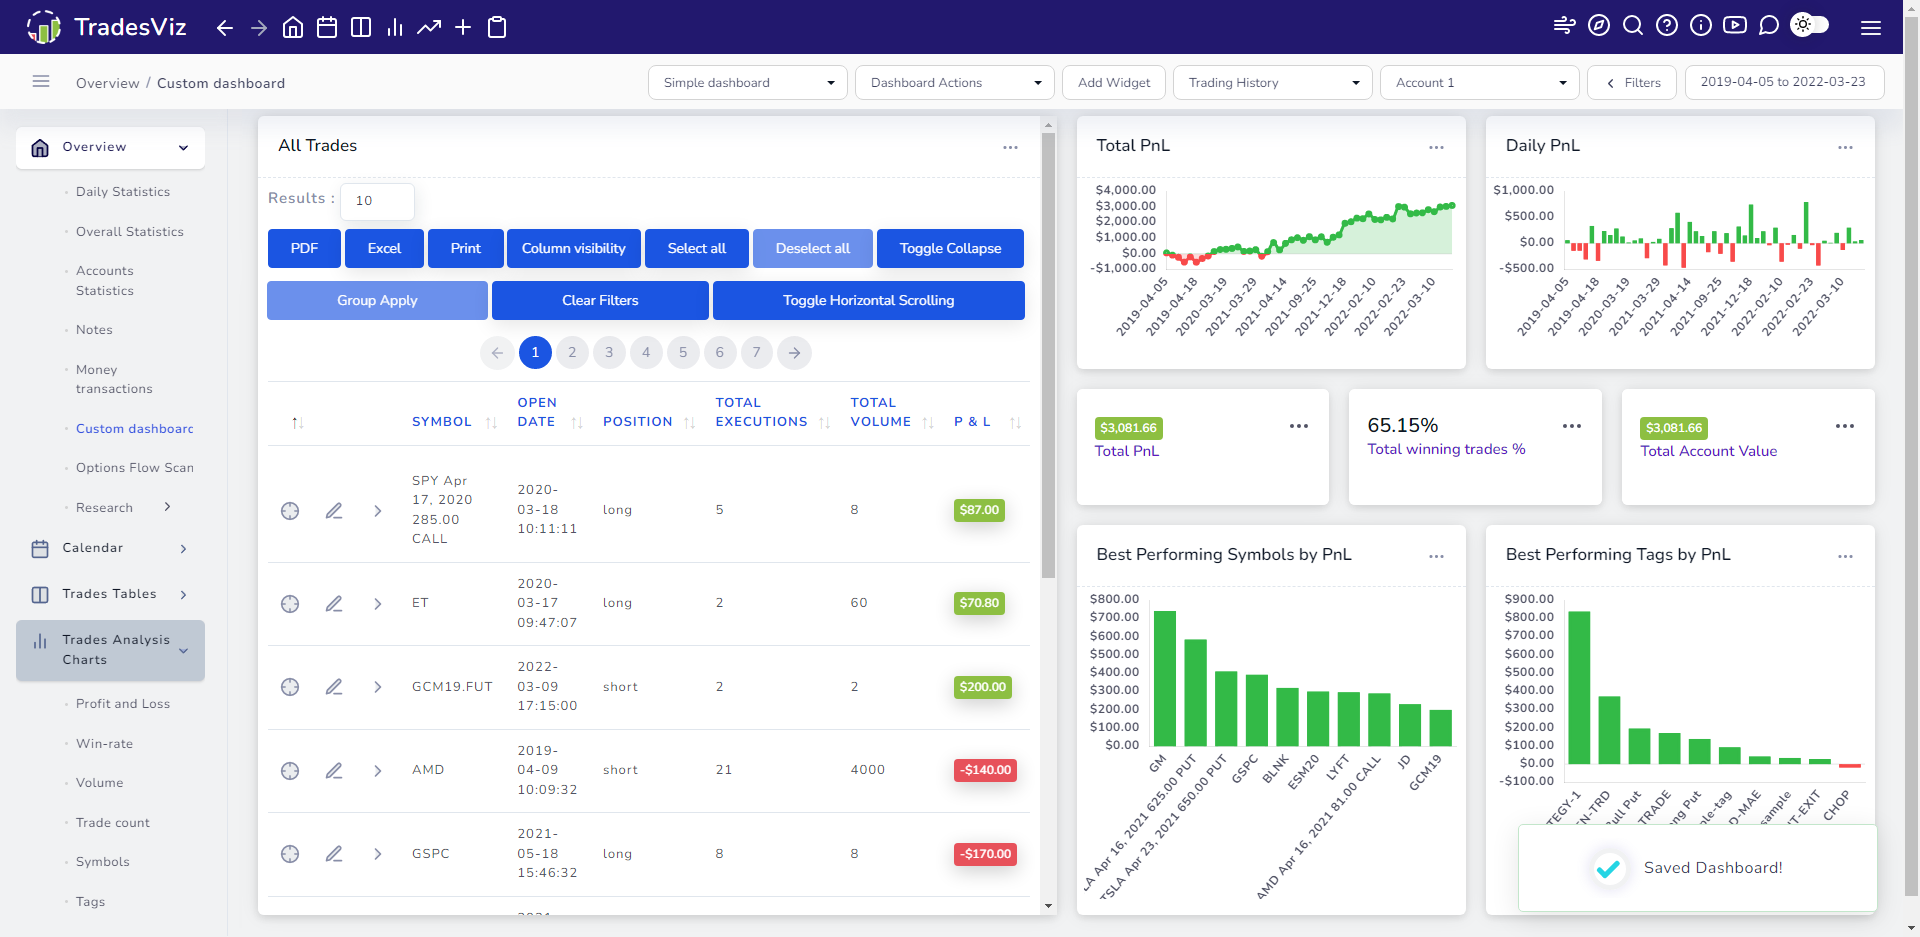
Learn how to create a custom dashboard with any charts and statistics you want! We really mean it when we say TradesViz is THE MOST FLEXIBLE trading journal available!
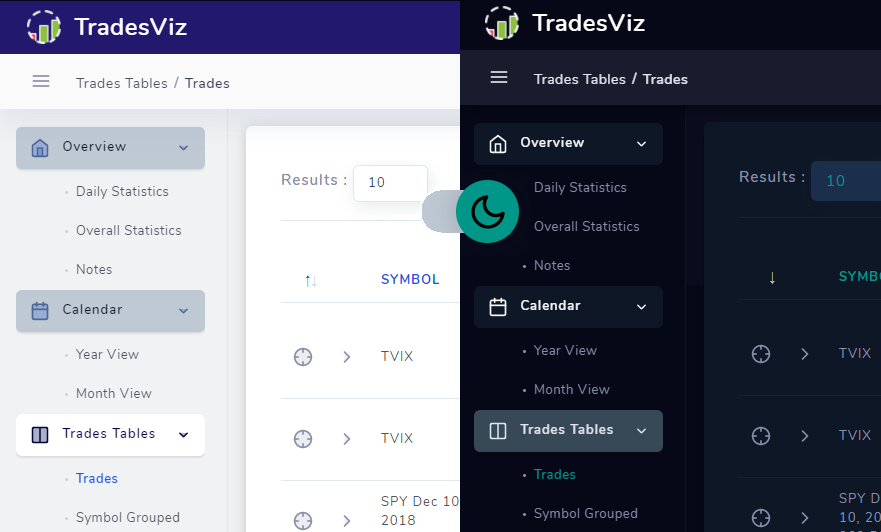
You can now switch between light and dark mode with a single click in your dashboard itself!