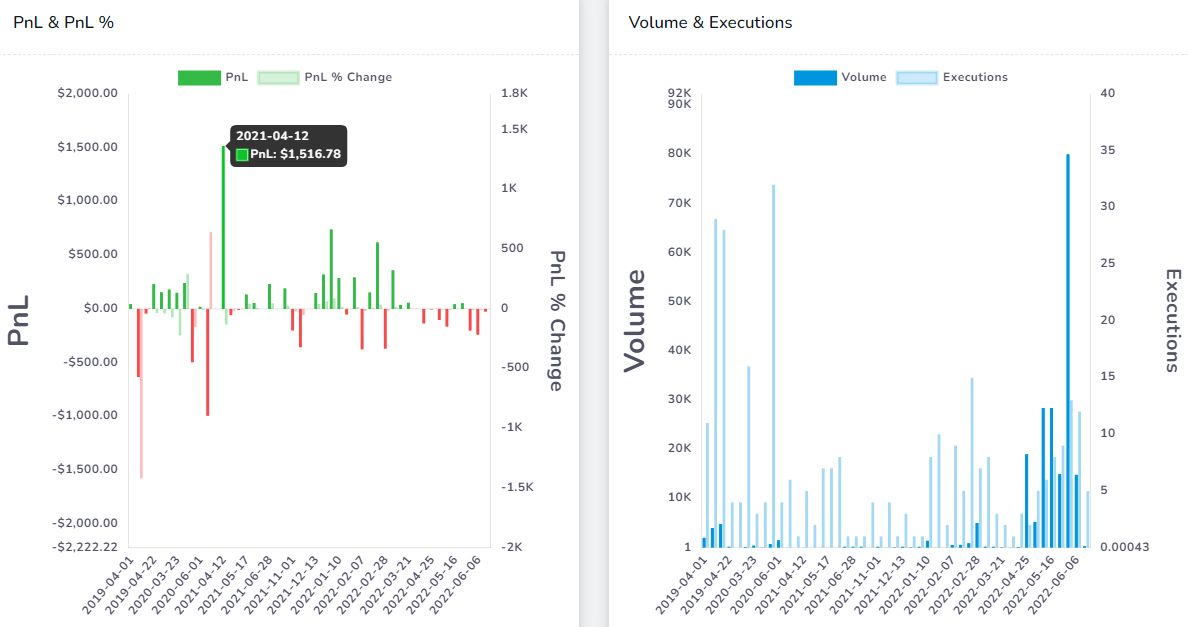
New feature: Weekly View
We have had yearly and monthly views. Now, you can get in-depth with your PnL stats for each week!
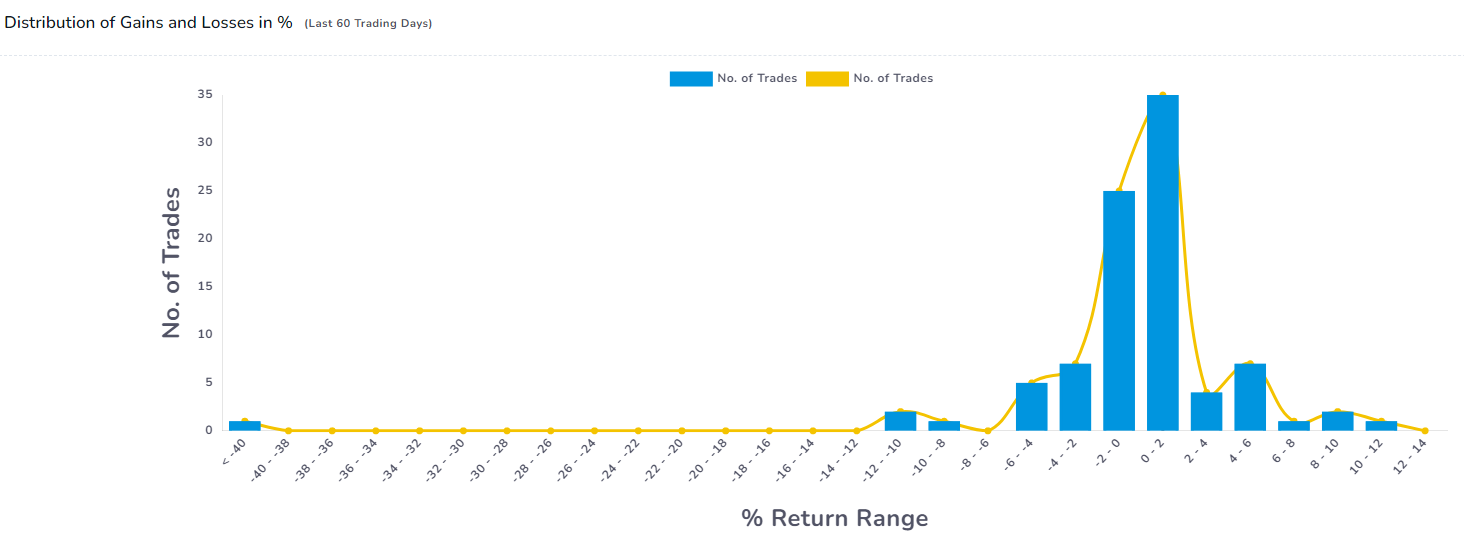
New charts: Distribution curves
We have a few sets of charts that can help provide more value to your analysis and pinpoint the set of trades that you need to improve - Distribution curves and also DRMA curve.
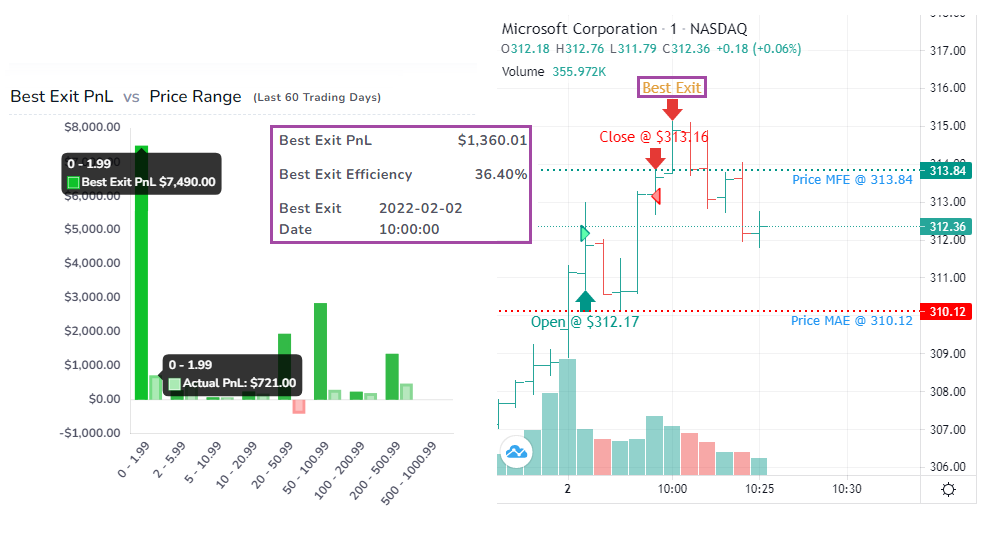
New: Exit Analysis Charts
Ever wonder how much money you could have made if you held on to that trade for just a little longer? No need to daydream about it anymore. You can visualize and analyze every single trade's exit efficiency and best exit time to tweak your strategy to maximize your profits.
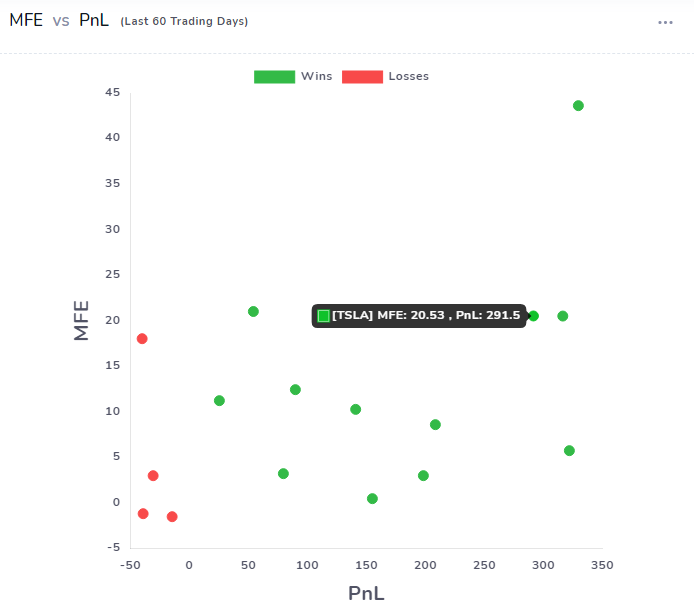
New: MFE/MAE Charts
A new addition to TradesViz charts: MFE/MAE vs trade properties charts. You can now analyze and find the best profit and stop targets for all of your trades. Like every other TradesViz chart, these charts are also FULLY EXPLORABLE!
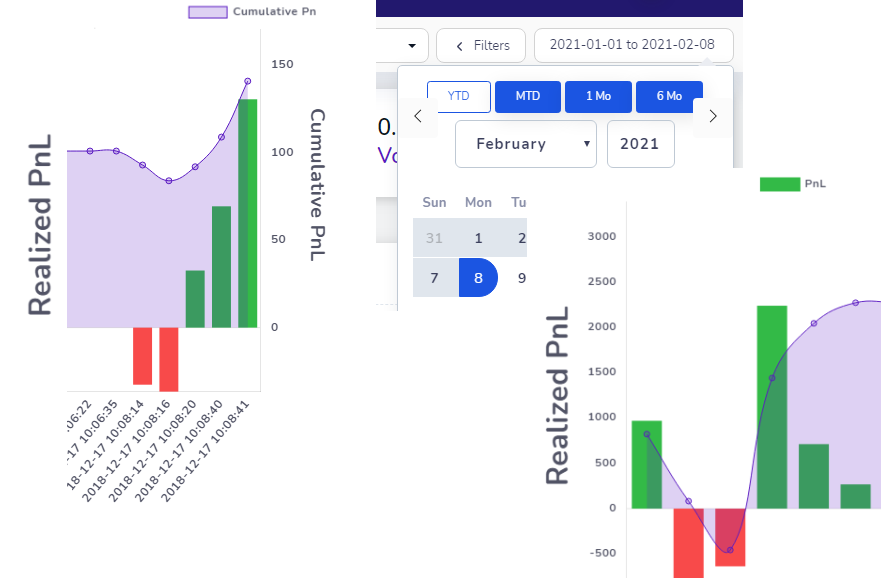
New feature: Continuous PnL view for trades and trading days + Fixed timeframes
What to know how you performed in-between every trade in a trading day or in-between every execution in a trade? Take a look at the all-new continuous pnl charts - now available in all trade and day explore charts!