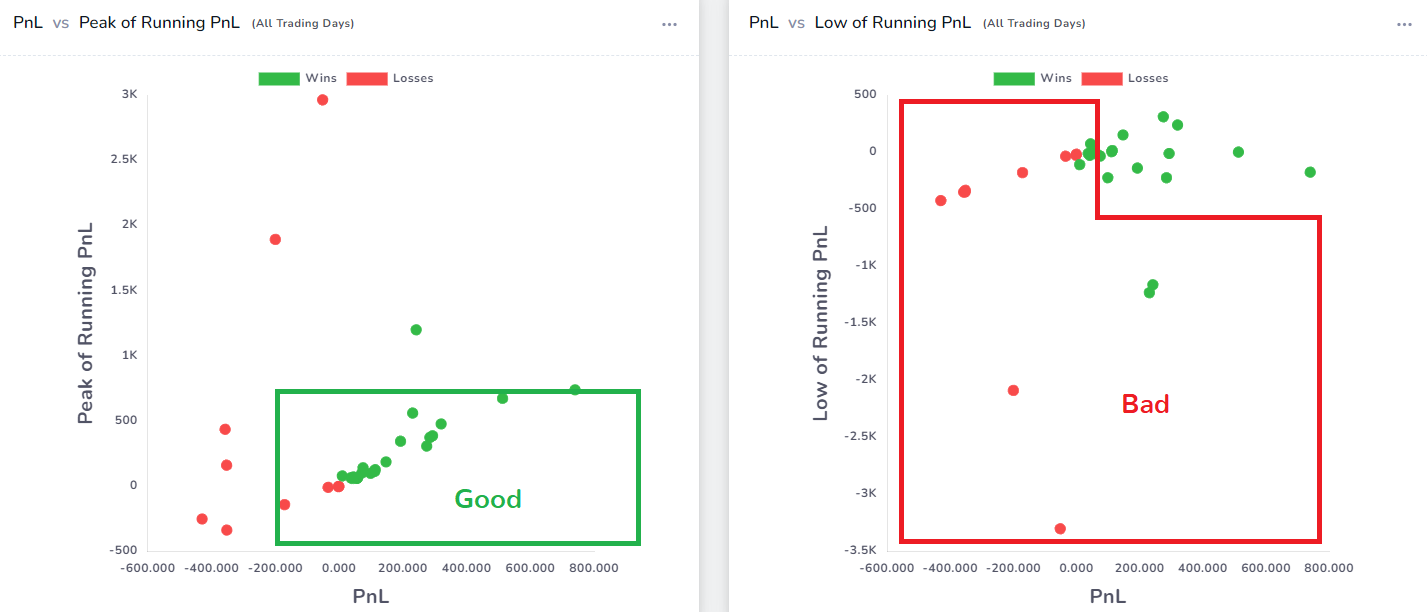
Running PnL Analytics: How well are you managing your risk and drawdowns?
Are you a "lucky" bag holder? Do you find yourself holding on to winners too short or losers too long? You can now quantify and visualize these stats! Hard to accept for many traders, but it is easy to learn and improve yourself with these insights.
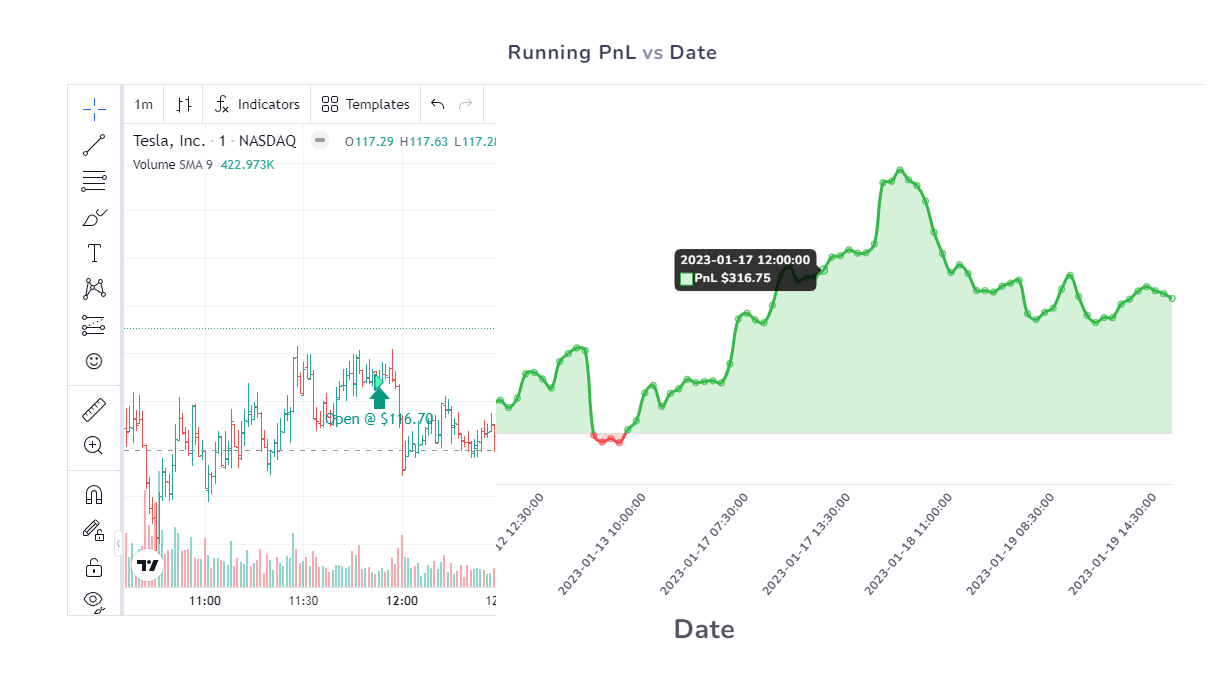
New feature: Unrealized Running PnL Charts
View full running pnl including unrealized till the current date for your trades - available as a chart in Trade explore view!
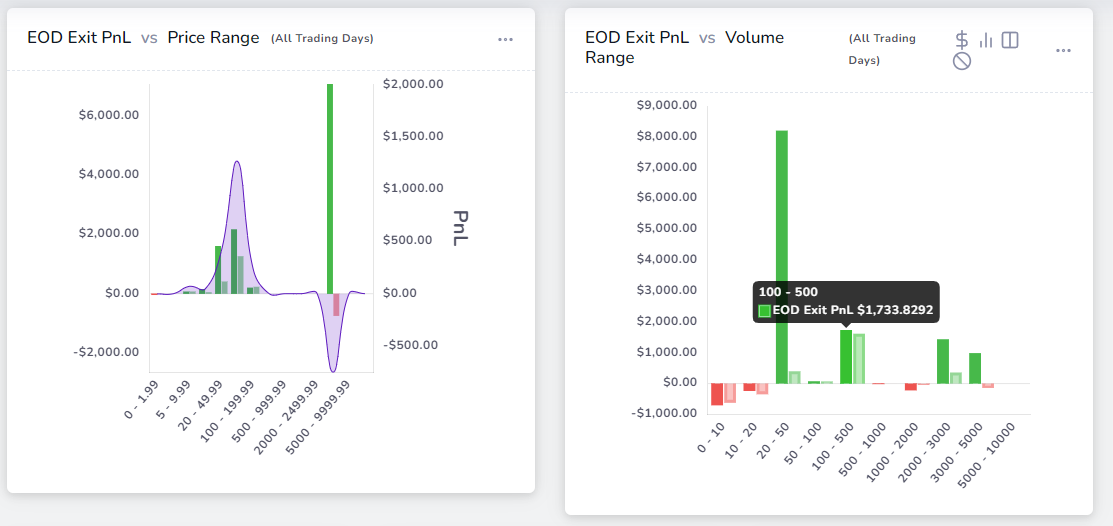
New: EOD Exit Analysis Charts
We've already seen the "best" exit, but what happens if you just held your positions till EOD? These charts help answer the question if your strategy is really better than just buy and hold intraday.
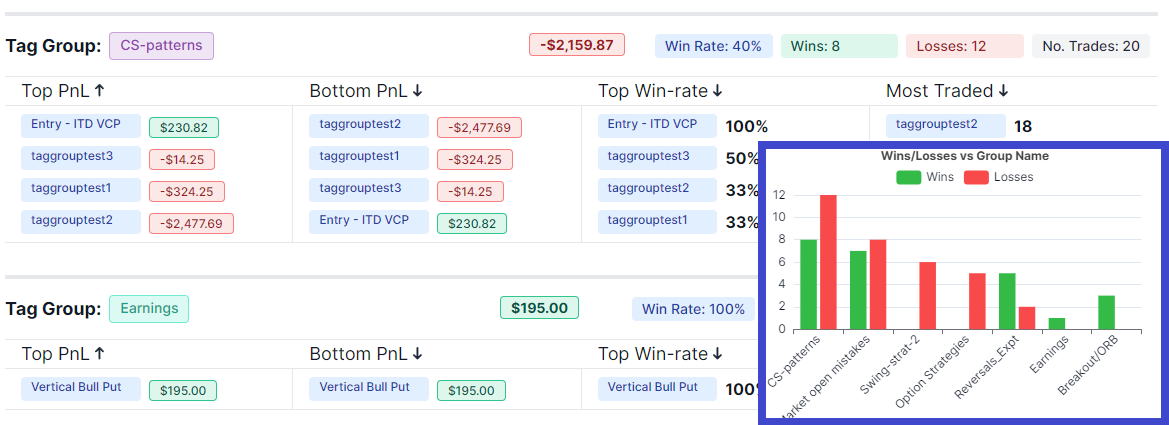
New Tabs: Tag groups analysis & Tag groups summary
We wouldn't just stop at tag groups. With the introduction of tag groups, the first 2 new tabs are about visualizing your tag groups statistics and finding which tags within each tag groups you should focus on.
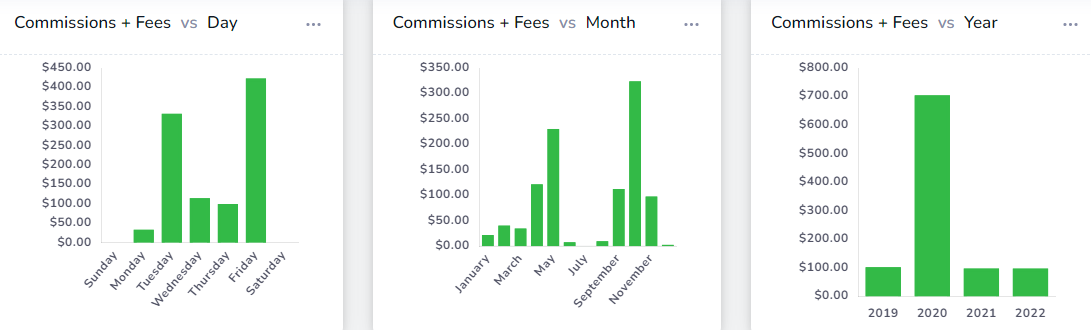
New charts: Commission and fees statistics
Commissions are the new/small account killers. With these charts, you can exactly know where you are spending most of your account's value in commissions and fees and try to reduce it!