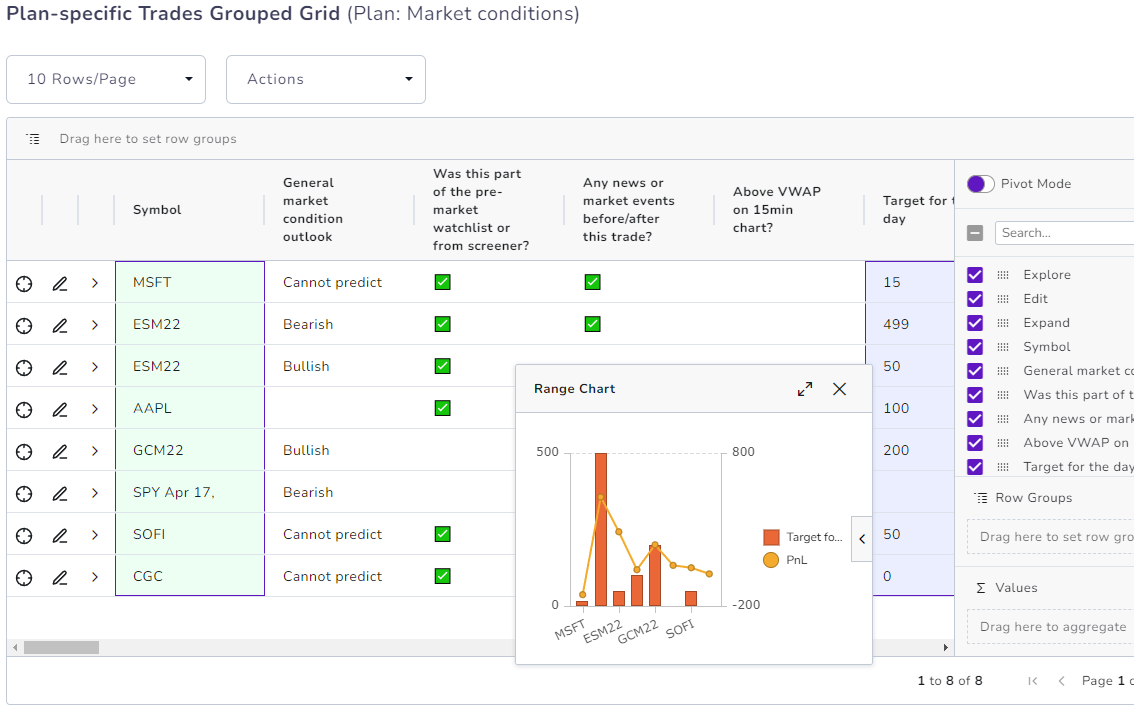
New feature: 100% Custom analysis of trade and day Plans + Trading checklist statistics (Pivot grid)
Create fully custom statistics/metrics (via plans) and attach them to your trades, and trading days and you can now analyze all of those features with our advanced pivot grid and get even more personalized trading insights.
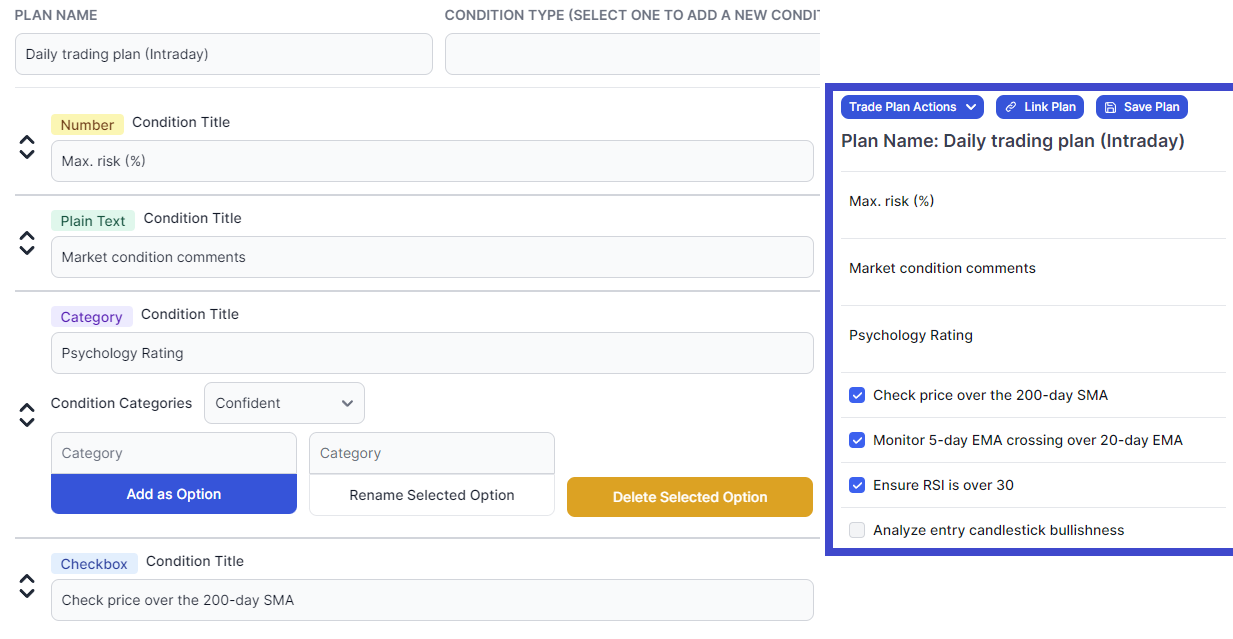
New feature: Create trade and trading day plans (custom checklist & more)
Learn how to create custom plans and checklists you can attach to any trade or even trading day. All of these stats can be analyzed in full detailed - 100% flexibility in creating your own custom stats and plans for the trade/day!
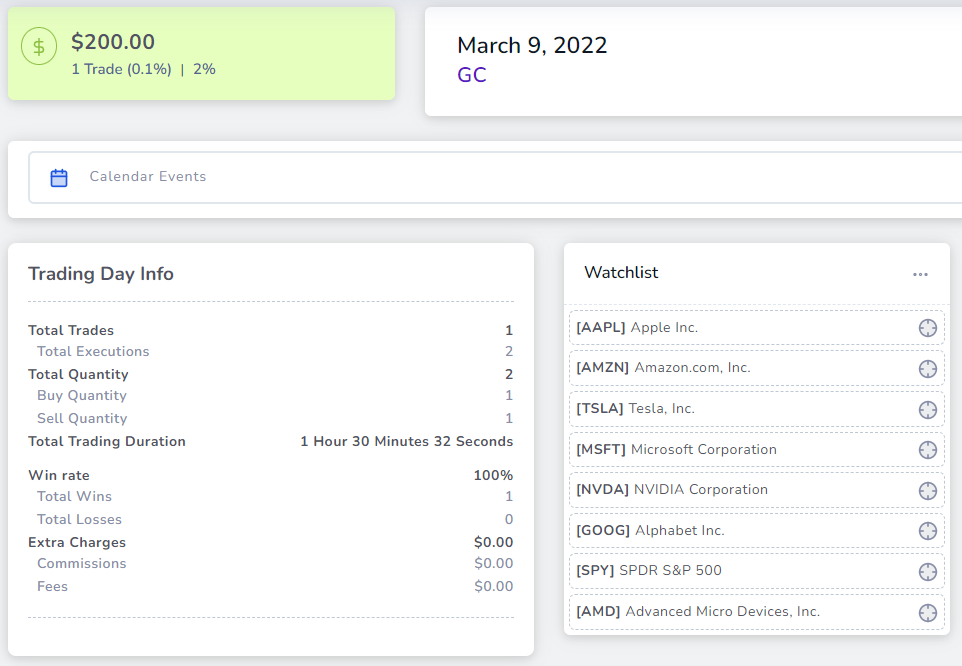
New feature: Daily watchlists
You can now create a watchlist for each trading day easily via the day explore tab! Plan every step of your trading day easily with TradesViz!
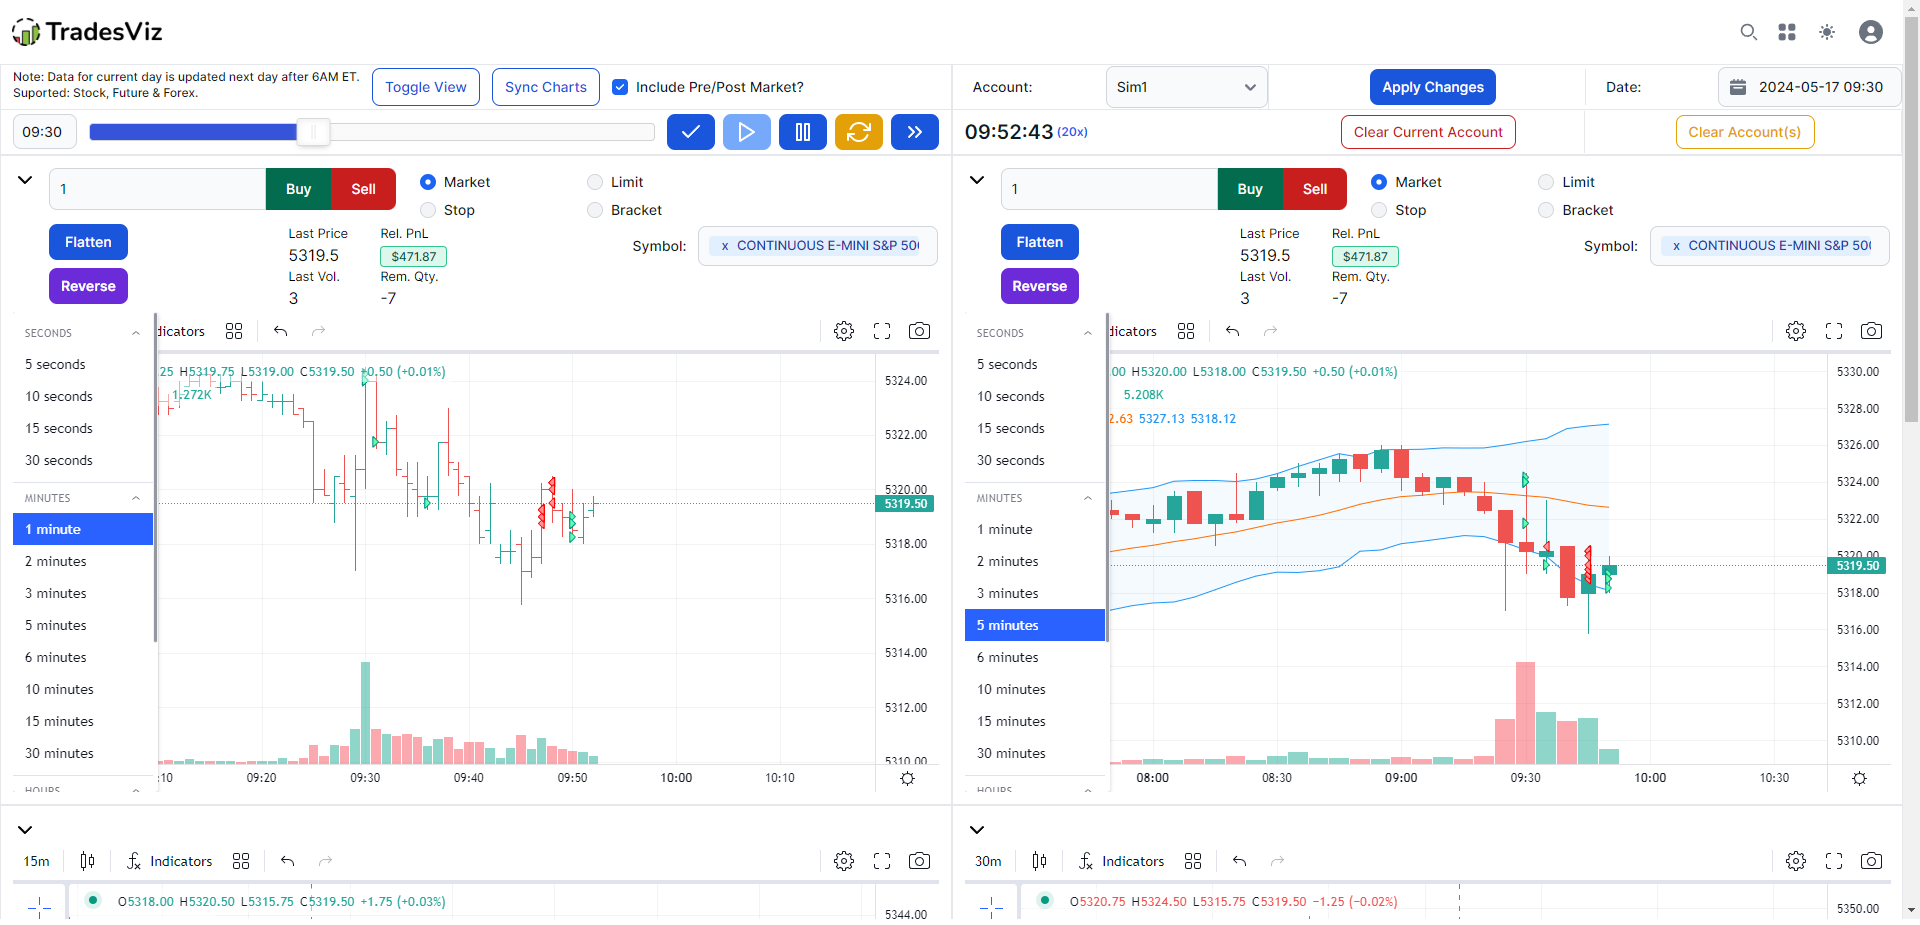
Multi chart trading simulator: Trade any symbols in multiple timeframes in a single screen
A first in ANY trading journal/simulation platform online: multi-chart, multi-timeframe trading simulator dashboard. Trade multiple symbols on multiple timeframes - all synced in the same page!
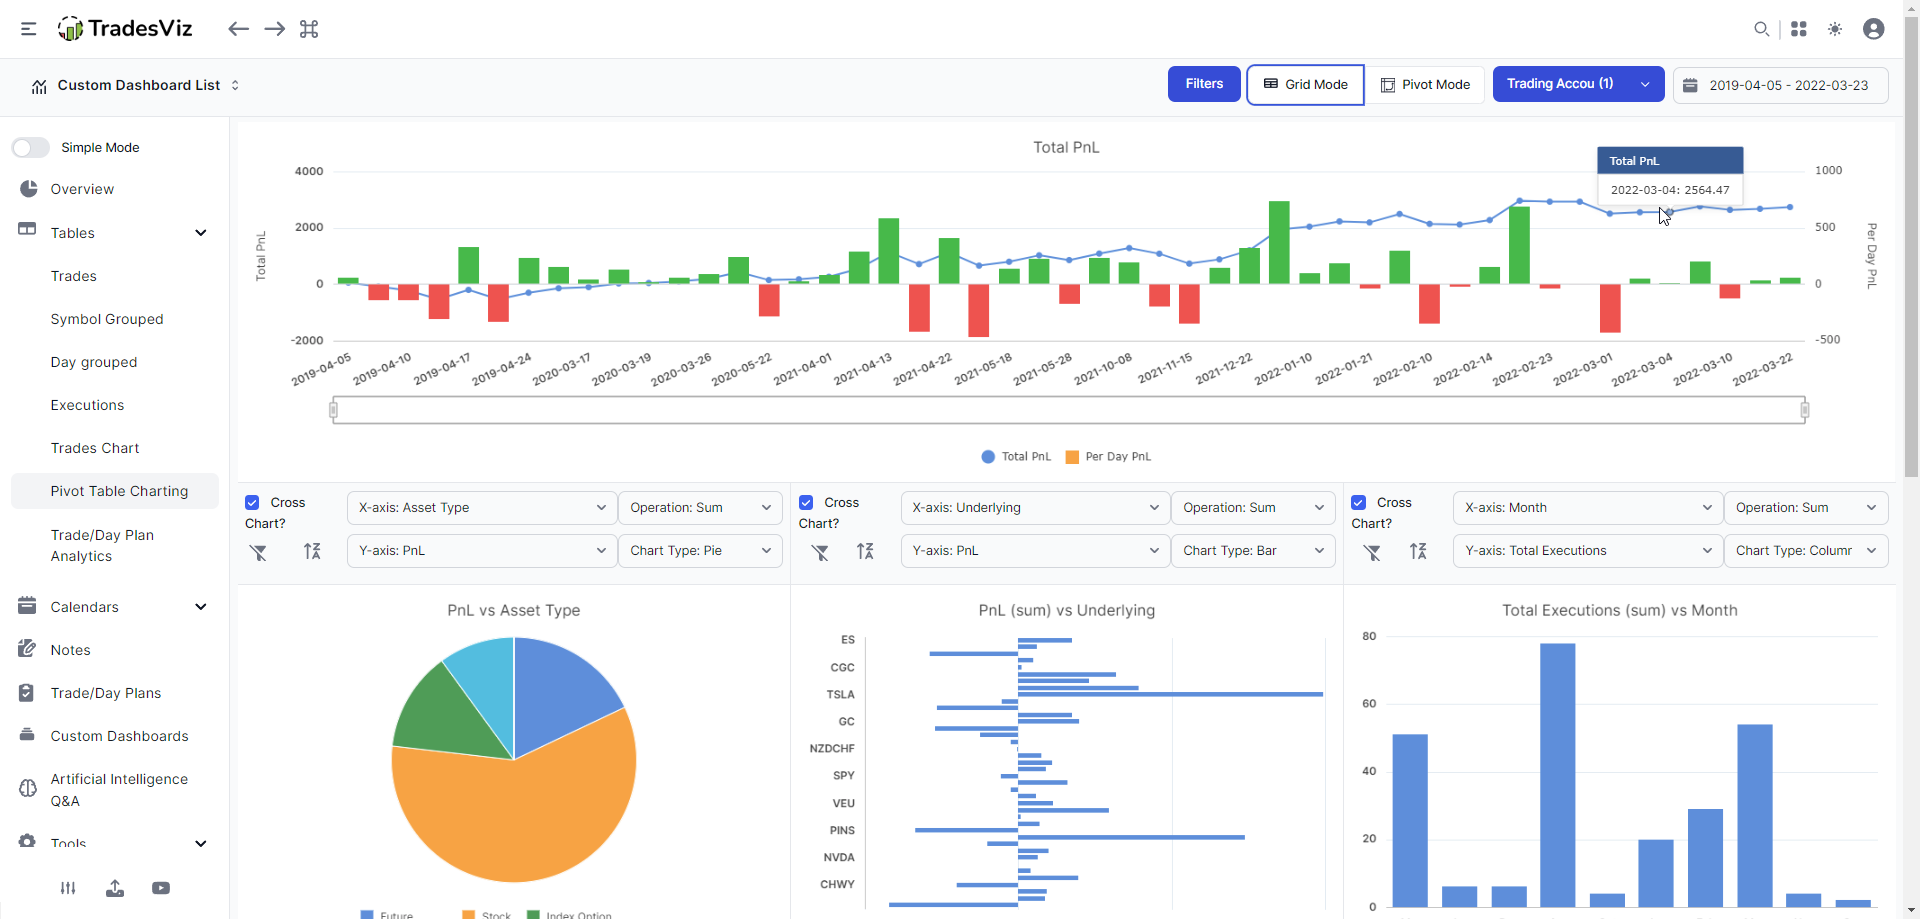
Pivot Grid + Charting: Visualize and analyze ANY statistic and metric on TradesViz
The next big thing on TradesViz journal: An all-in-one grid + pivot table where any column or data can be visualized and explored intuitively. Potential combinations of metrics: 600+ This is by far the most powerful singular trading performance analytics feature available online. Try it out!