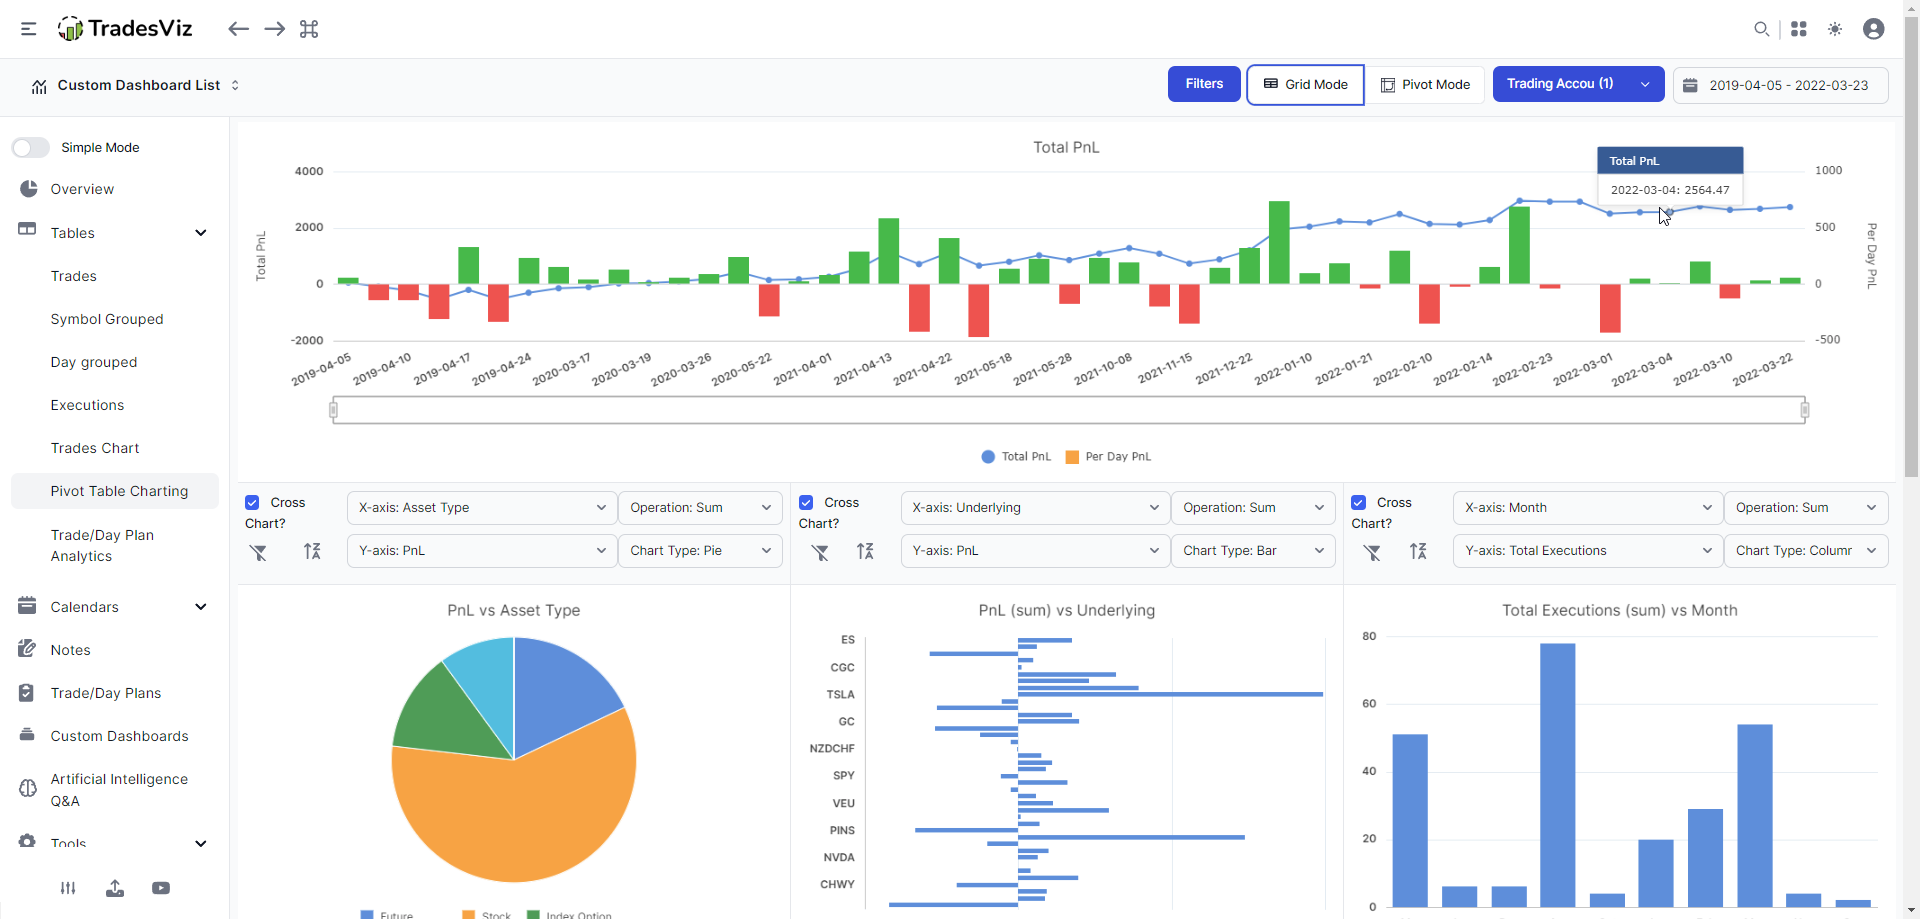
Pivot Grid + Charting: Visualize and analyze ANY statistic and metric on TradesViz
The next big thing on TradesViz journal: An all-in-one grid + pivot table where any column or data can be visualized and explored intuitively. Potential combinations of metrics: 600+ This is by far the most powerful singular trading performance analytics feature available online. Try it out!
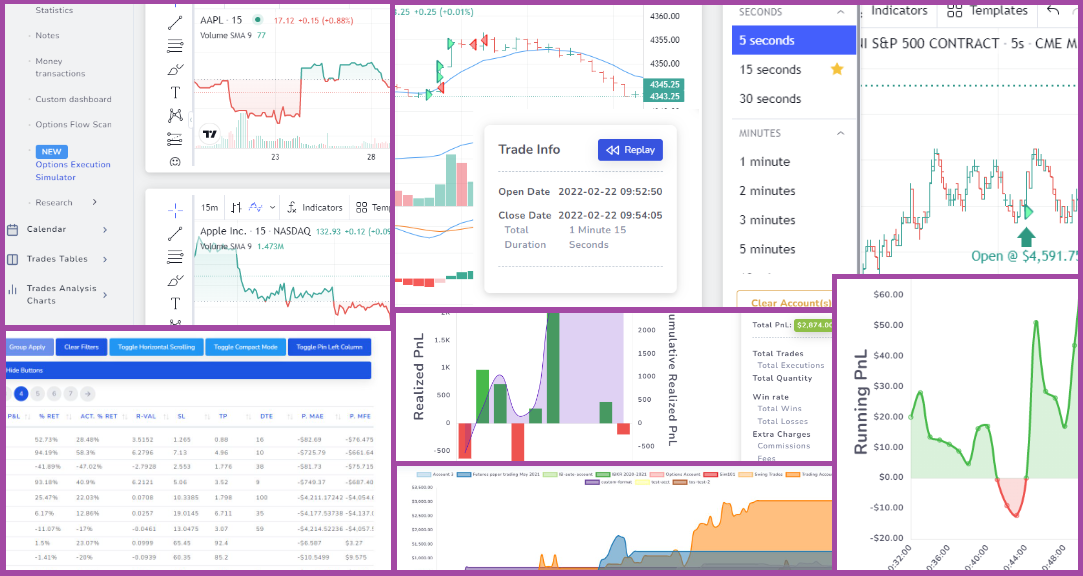
Sep 2022 to Jan 2023 Updates: Simulator, Options spread PnL, EOD Exit + more features!
A LONG list of new features to TradesViz - a lot of it, being the first time ever on any online trading journal. This is a must-read change log - showing how much we are committed to improving TradesViz every single day!
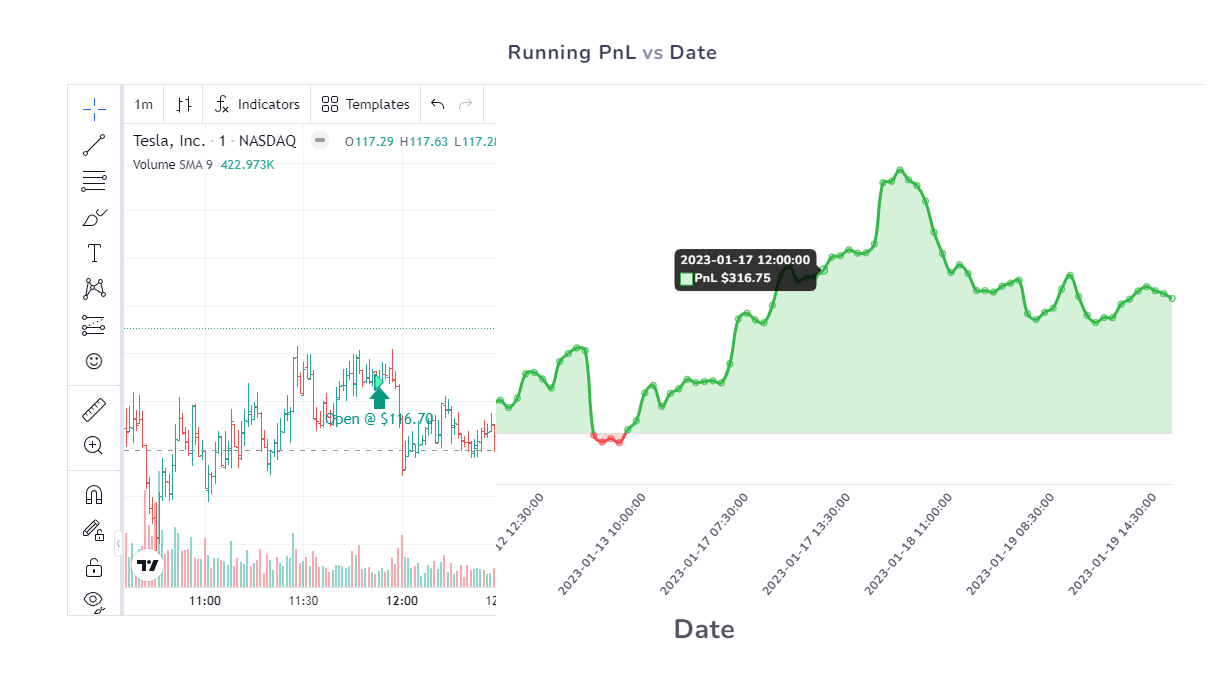
New feature: Unrealized Running PnL Charts
View full running pnl including unrealized till the current date for your trades - available as a chart in Trade explore view!
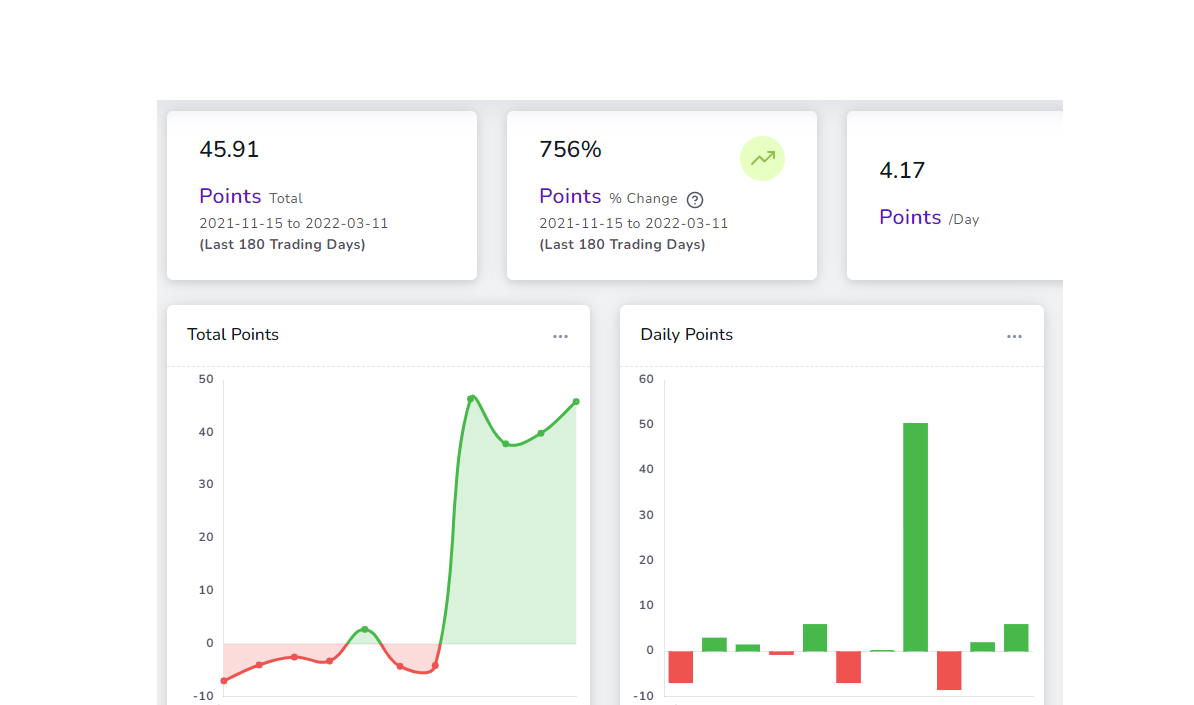
New feature: Dashboard Points/Ticks toggle (Switch all charts from PnL to Points/Ticks)
View your PnL in points and ticks across most charts in your dashboard!
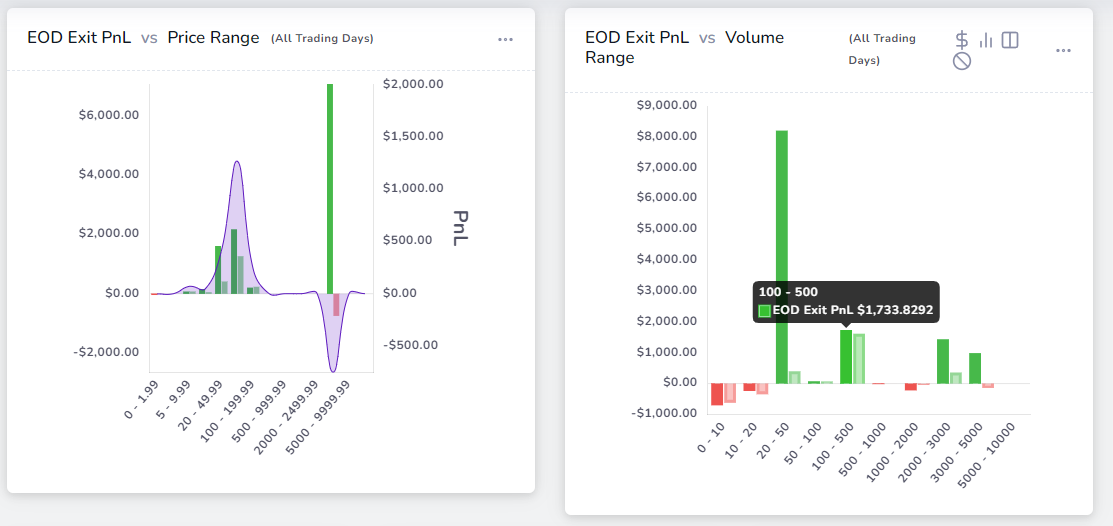
New: EOD Exit Analysis Charts
We've already seen the "best" exit, but what happens if you just held your positions till EOD? These charts help answer the question if your strategy is really better than just buy and hold intraday.
