Beyond Win Rate: Mastering Your Trading with R-Value and Profit Factor in TradesViz
This comprehensive guide explains how to calculate and analyze, and use R-value and Profit Factor in TradesViz using powerful features such as the General Statistics dashboard, Pivot Grid analysis, AI Query tool, and Custom Dashboards to identify your most profitable setups and optimize your trading strategy.
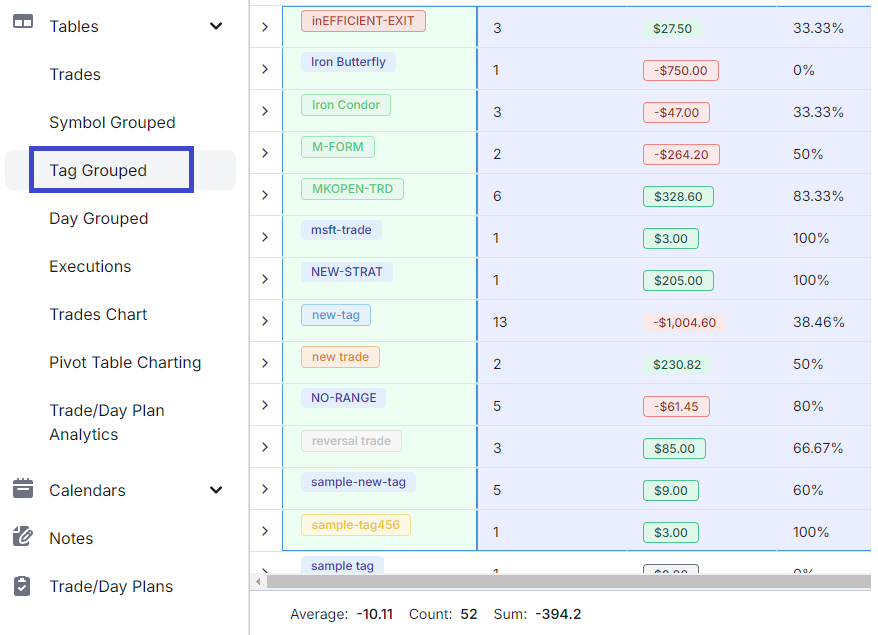
New tab: Tag grouped table
The 5th main table in TradesViz: Tags table! You can now quickly view summaries based on tags and generate charts/export data and more with the tags table.
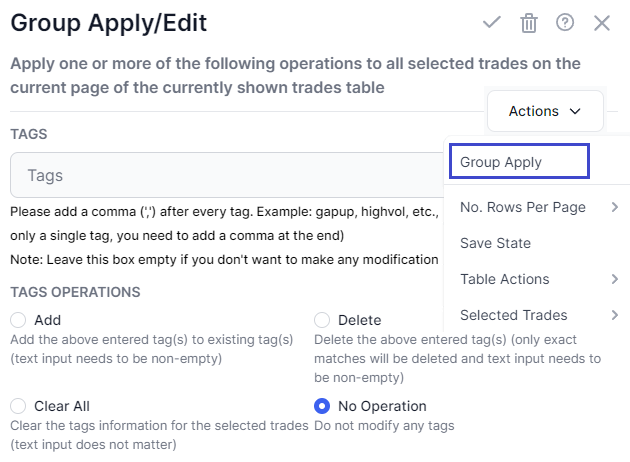
Trades table functions: Group Trade Operations (TradesViz v2.0 Update)
Add notes, tags, merge, share - a group of trades with a single click. Learn how to use the various grouping operations available in all the table views in TradesViz. [NEW] Updated with 2024 features and tips based on TradesViz v2.0 UI!
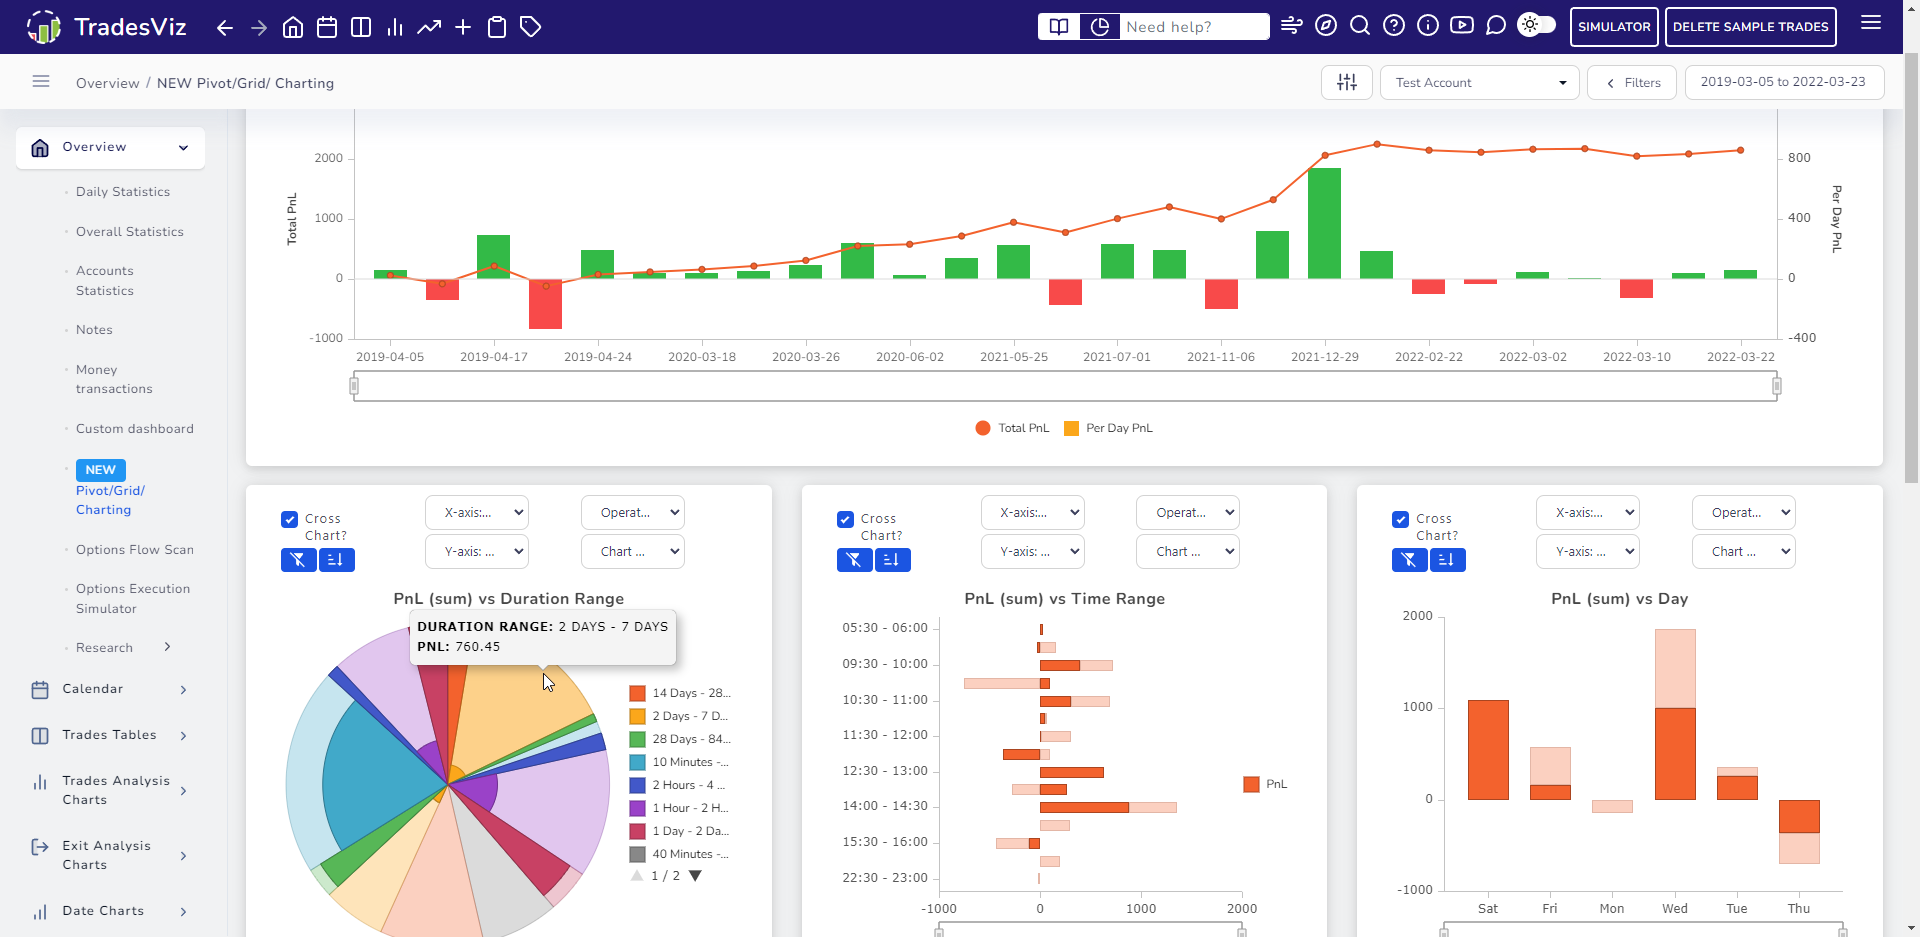
Advanced journaling analysis with pivot grid: Examples and use-cases
Want to fully utilize the power of the new pivot grid? Check this blog. Read the blog see detailed used-cases of how you can utilize the pivot grid's power to understand your trading data better.
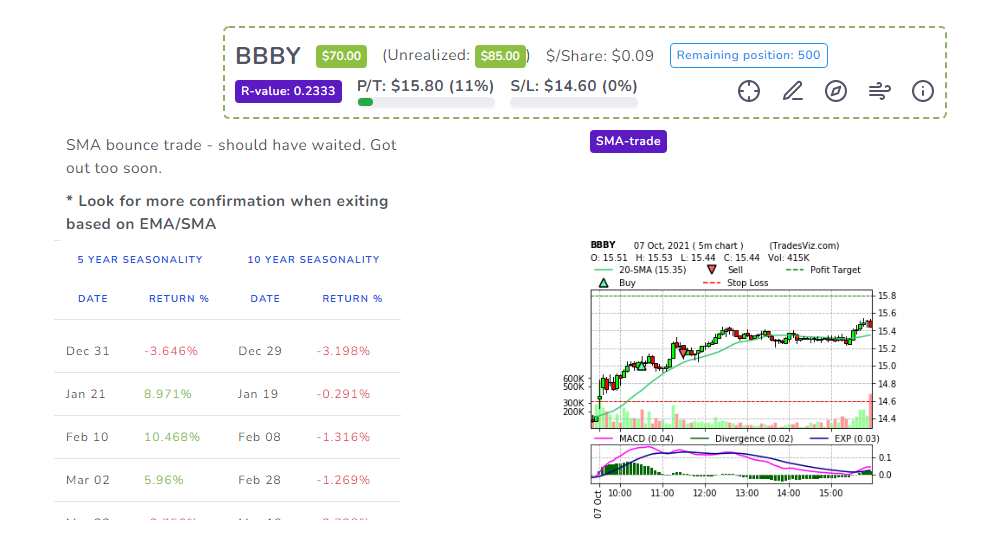
Ultimate context combination: The Unified View
PnL, Unrealized PnL, Risk info, Comments/Tags, Recent options flow, Upcoming seasonality prediction, and more... View all of this in a single tab for all your trades. Use every piece of market info to hone your trading edge and make trading simpler.