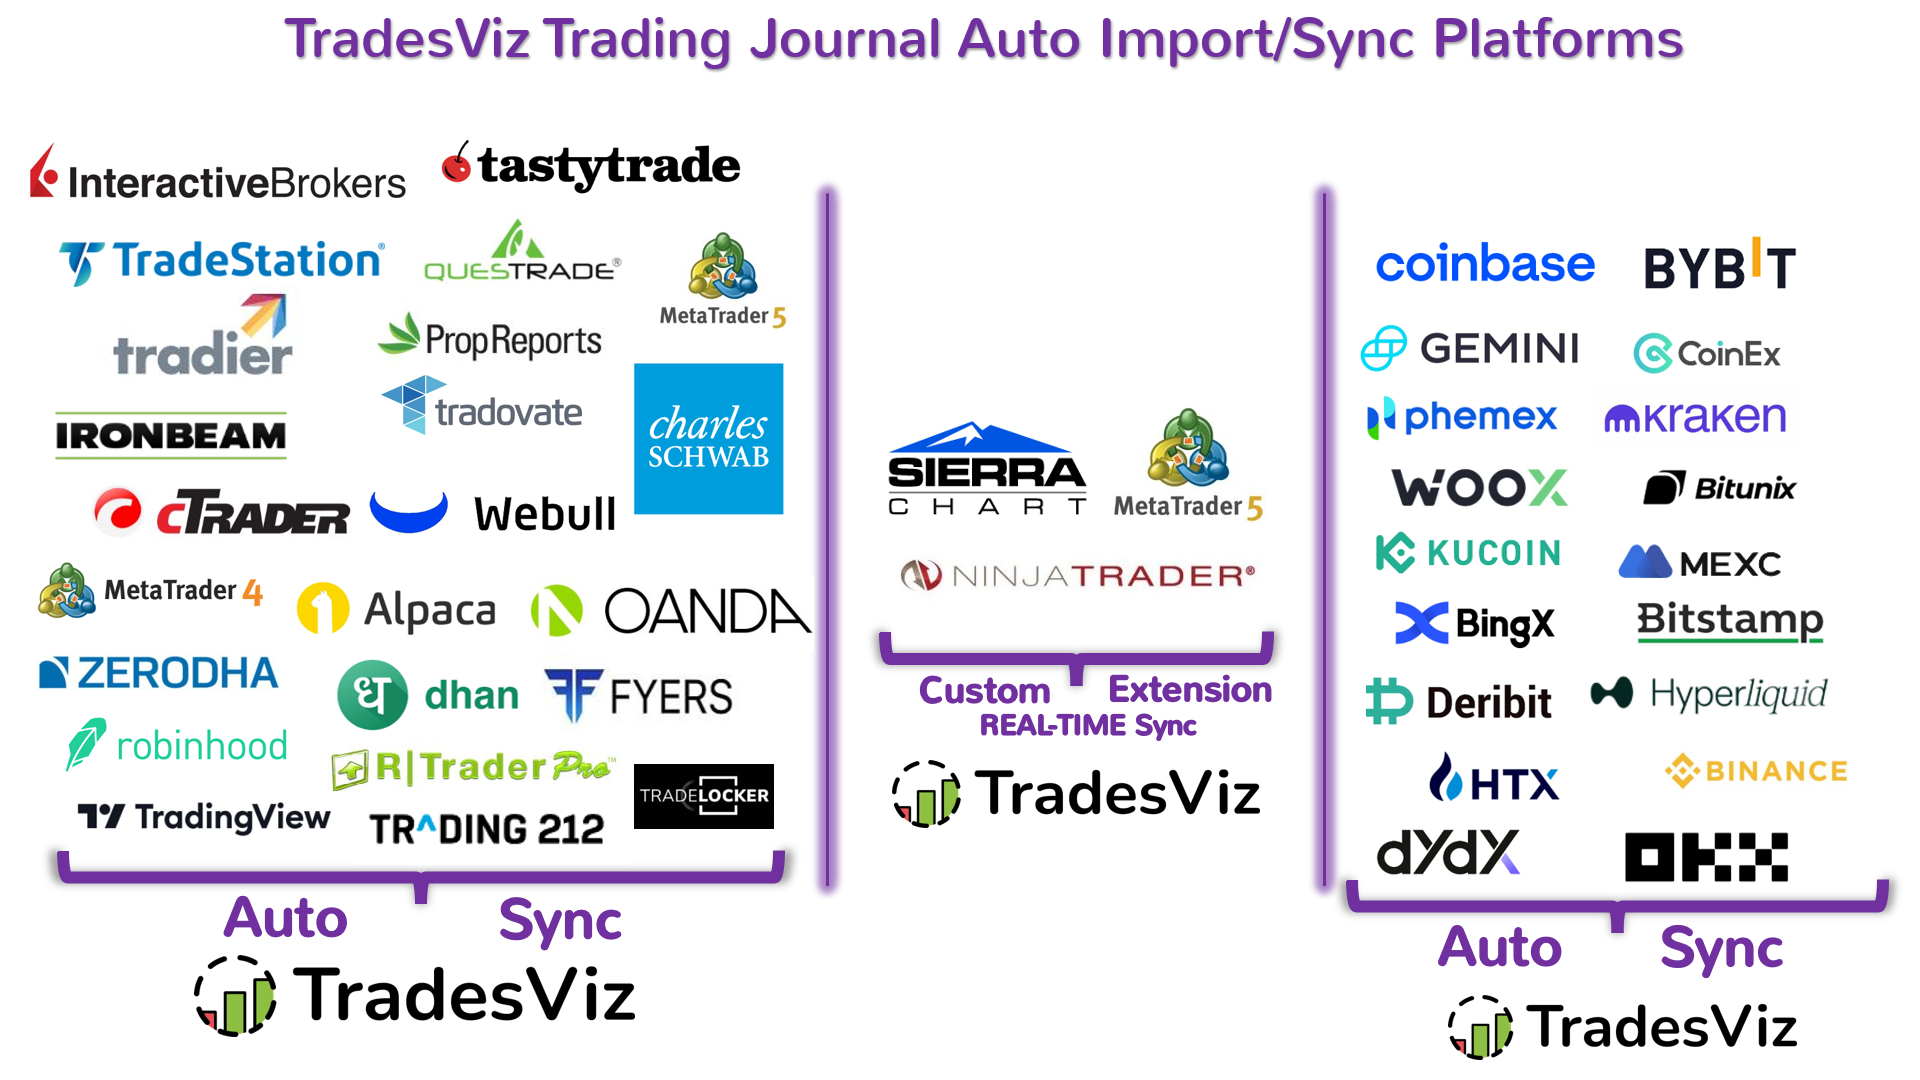
How to import trades automatically (auto-sync trades)!
No more CSV file importing! One-click = all your trades get synced with your TradesViz account! 100% auto-sync of your trades to your journal every 24-hrs!
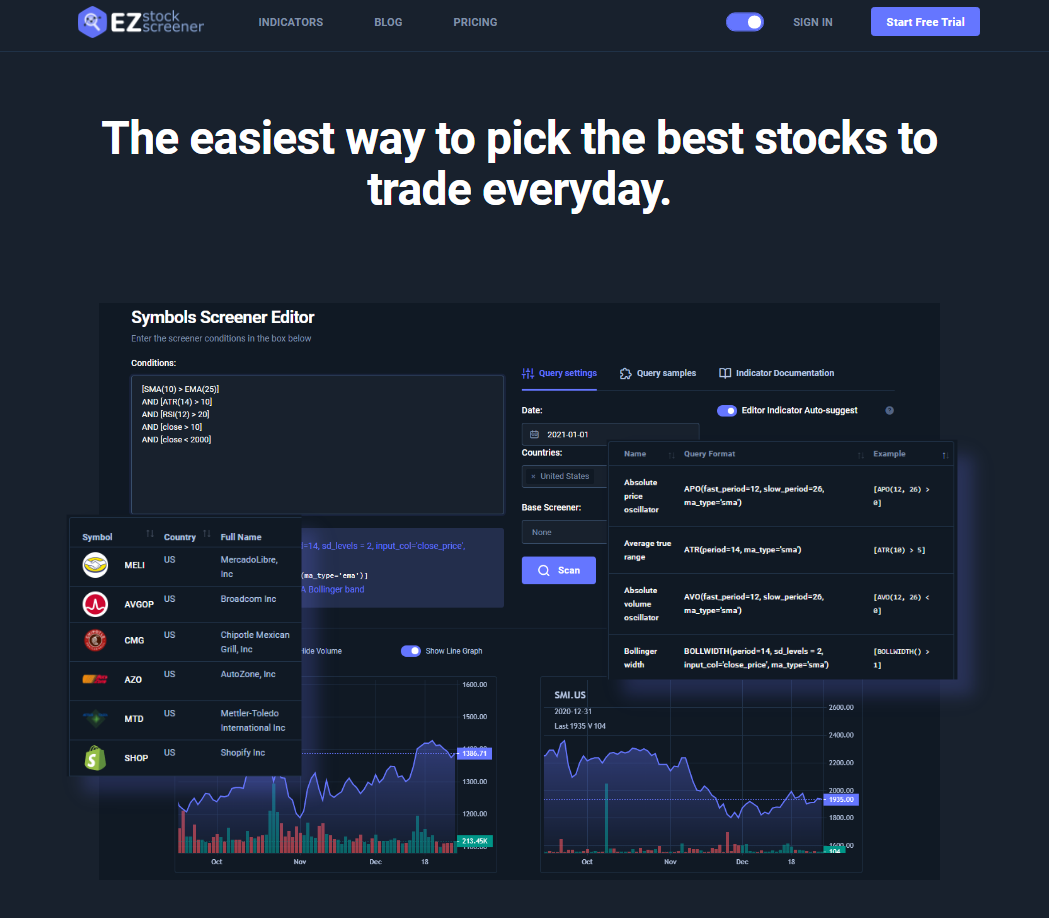
Introducing: EZstockscreener - An easy way to screen for the best stocks to trade every day in international markets!
After creating a very versatile post-trading tool where you can analyze and get insights about your trading performance, we set our sights on creating a pre-trading tool where you can now plan out your trading by creating watchlists by screening for the best opportunities among 15,000+ stocks worldwide! Visit ezstockscreener.com to learn more!
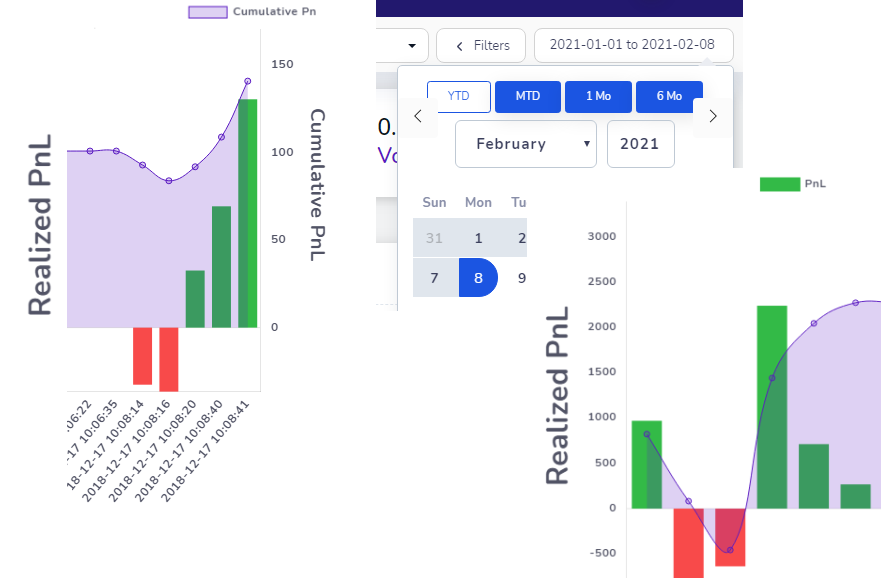
New feature: Continuous PnL view for trades and trading days + Fixed timeframes
What to know how you performed in-between every trade in a trading day or in-between every execution in a trade? Take a look at the all-new continuous pnl charts - now available in all trade and day explore charts!
Oct, Nov 2020 Updates: Lots of new features, bug fixes and additional import formats
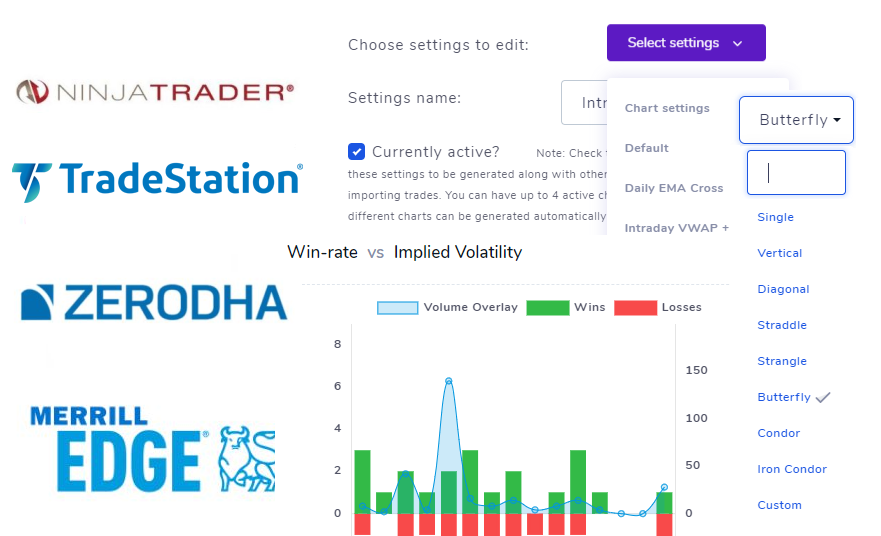
New options analytics, option spread inputs, global chart settings, and more import formats!
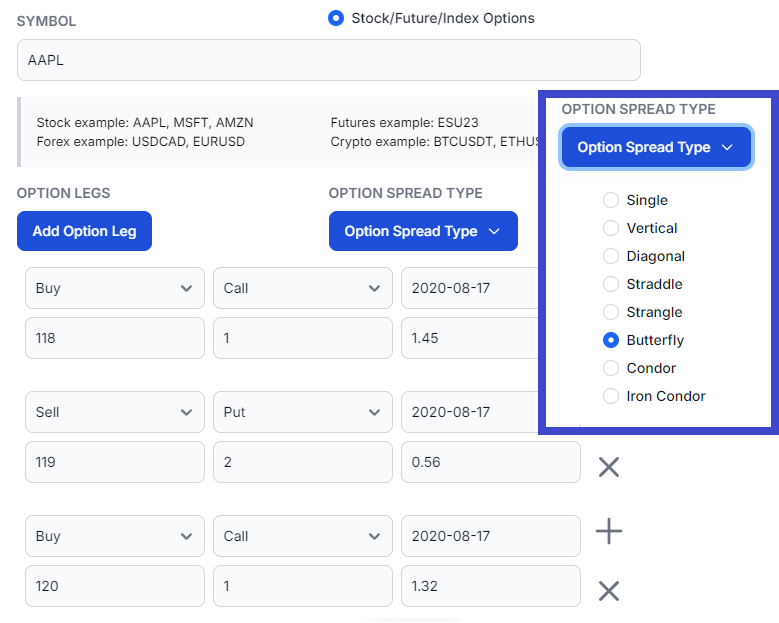
New feature: Option spread/multi-leg input
Learn how to input multi-leg option spreads - iron condors, butterfly - no more inputting manual executions! Add any no. of legs to your trade and easily edit them!