Trading Journal in 2021: Why TradesViz?
How has trade journaling changed in the last year? How has TradesViz helped traders achieve what was not possible before? Read to learn more!
Guides, changelogs, deep dives and everything trade journaling.
How has trade journaling changed in the last year? How has TradesViz helped traders achieve what was not possible before? Read to learn more!
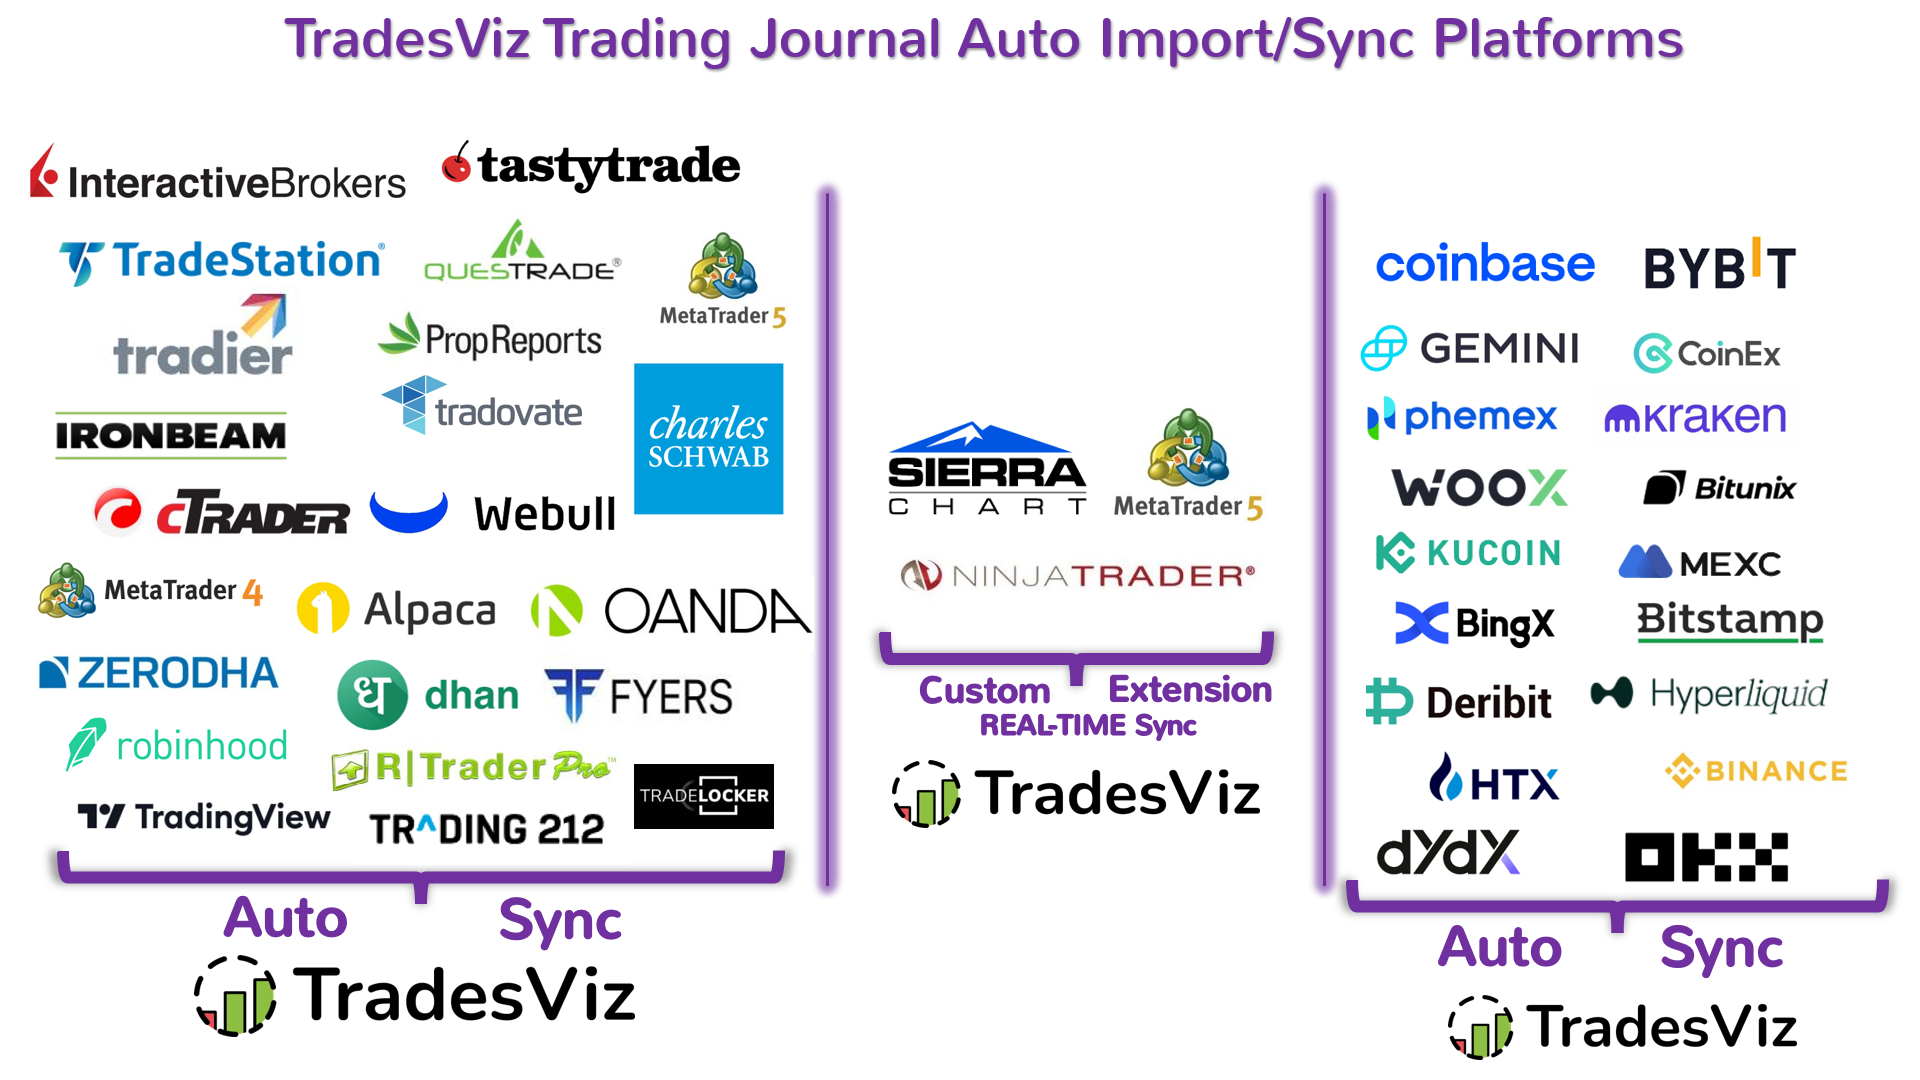
No more CSV file importing! One-click = all your trades get synced with your TradesViz account! 100% auto-sync of your trades to your journal every 24-hrs!
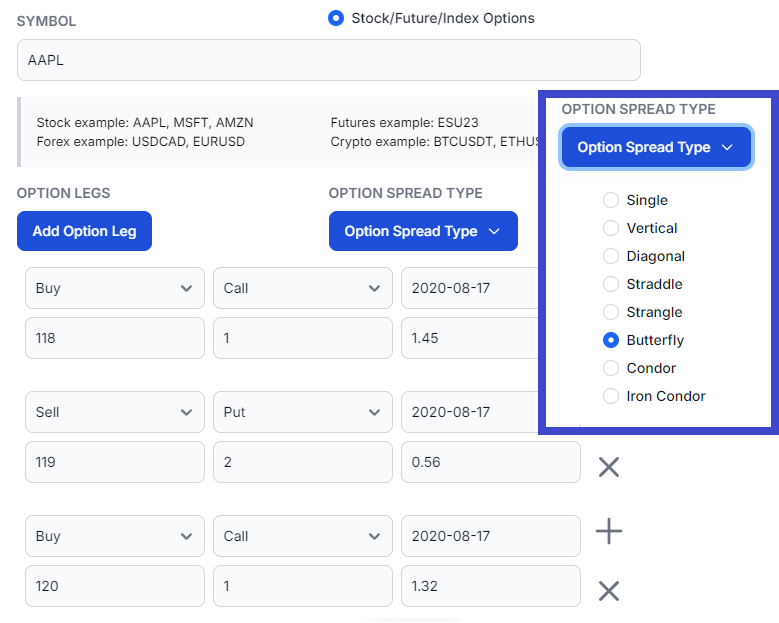
Learn how to input multi-leg option spreads - iron condors, butterfly - no more inputting manual executions! Add any no. of legs to your trade and easily edit them!
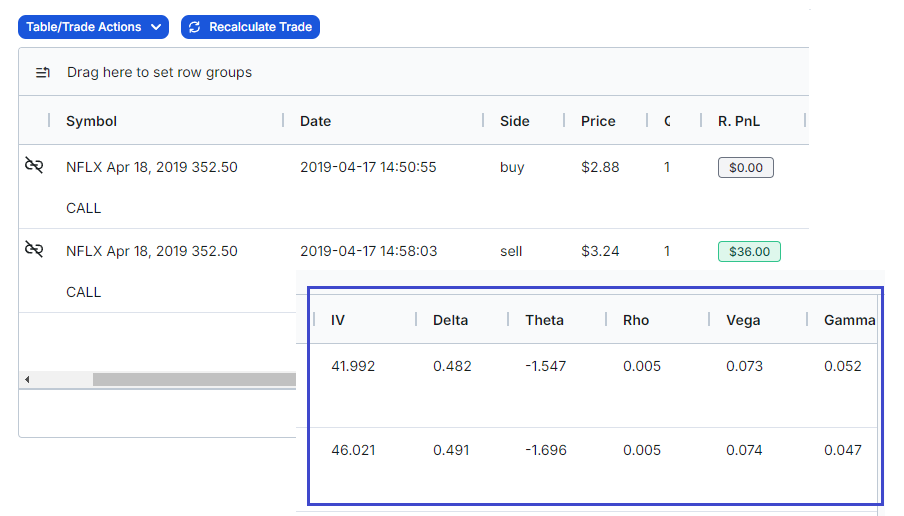
A treat for all options traders: view all options greeks right in your dashboard itself! No need to mess with your trading client to lookup greeks for your executions!
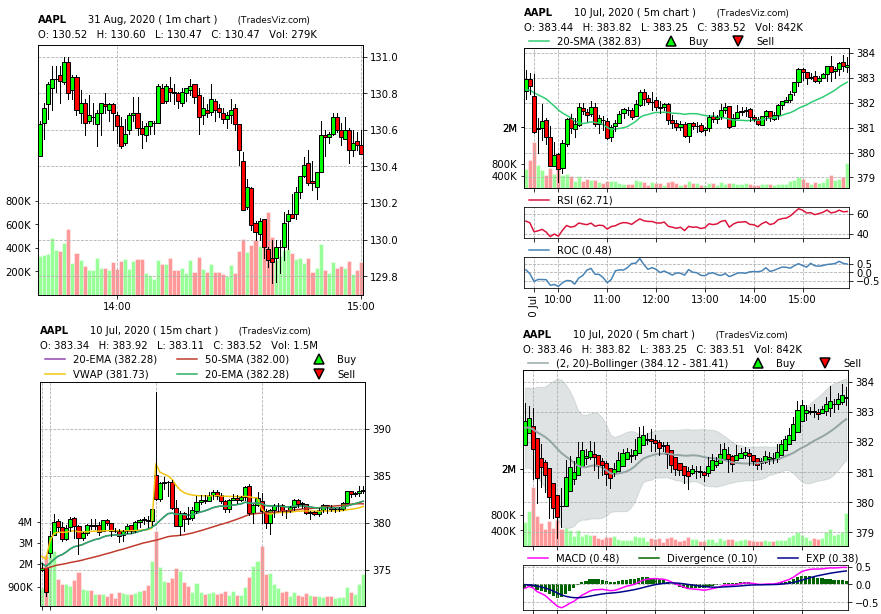
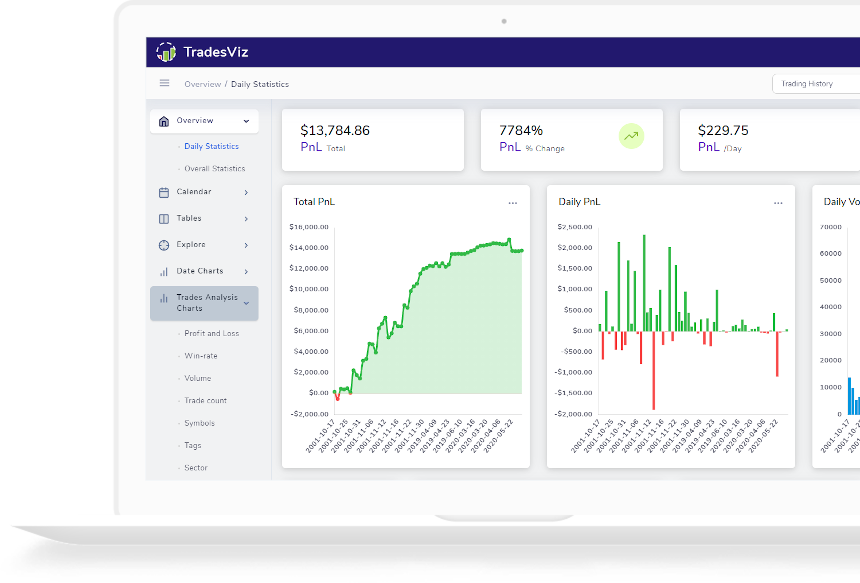
Learn how to set global default chart settings so that multiple charts according to your specifications are automatically generated for every trade imported from your broker's export files.
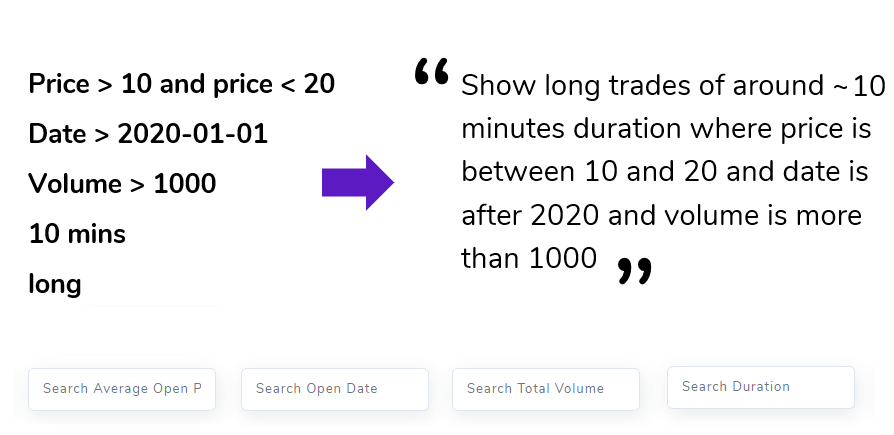
"Show all winning trades from 2018 where volume was more than 100 shares" "Show all SPY trades where the pnl is between 10 and 200 dollars and the trade lasted for a few minutes" Did you know you can query from the trades table to extract exactly what you want using the filter boxes under the tables? Learn more in this post!
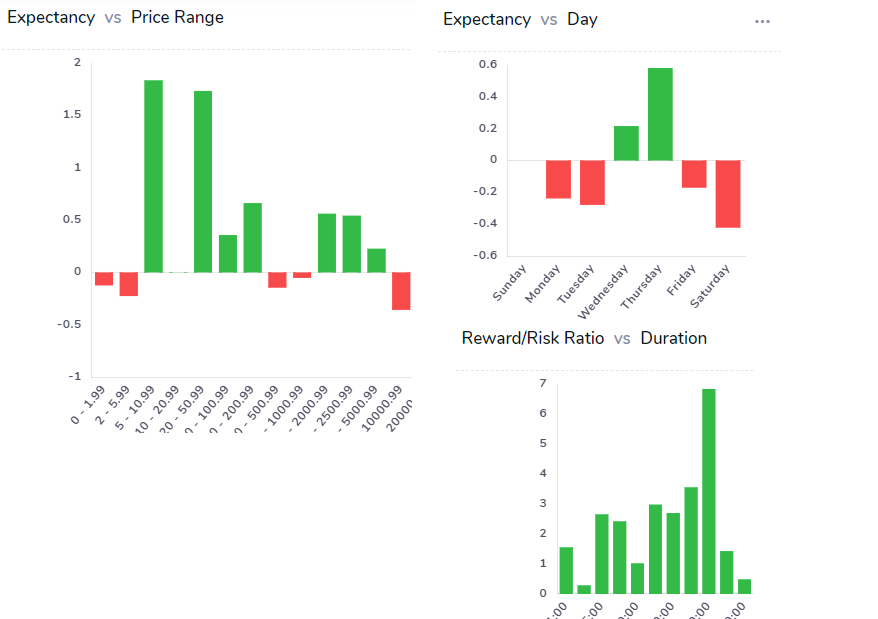
Reward/Risk ratio, Expectancy ratio for all your trades - learn more about new performance metrics and how you can access them!
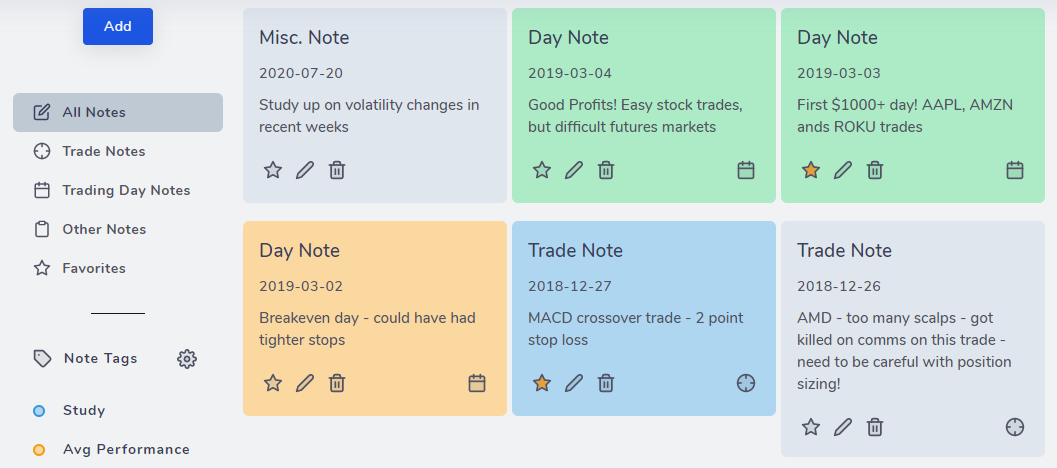
View all your journal notes in once place! tag, edit, filter from 100s of your notes quickly and efficiently!

Learn how to add notes, comments to shared user's trades and trading days!
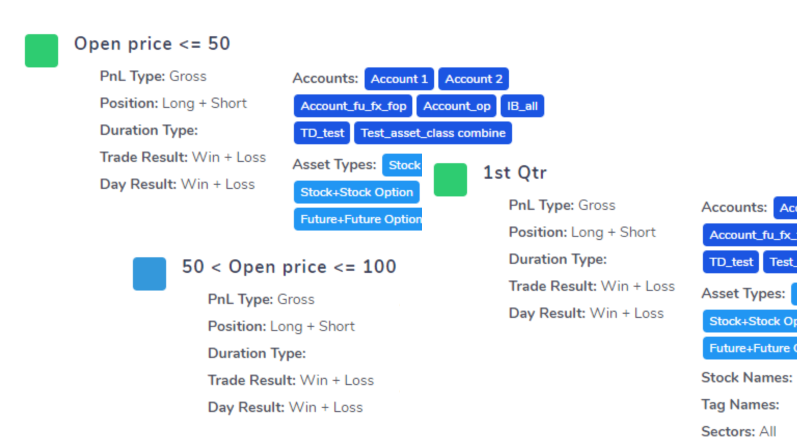
Group trades using 15+ filters and compare them against each other side-by-side using interactive charts to learn more about how your performance changes across different setups and trades!
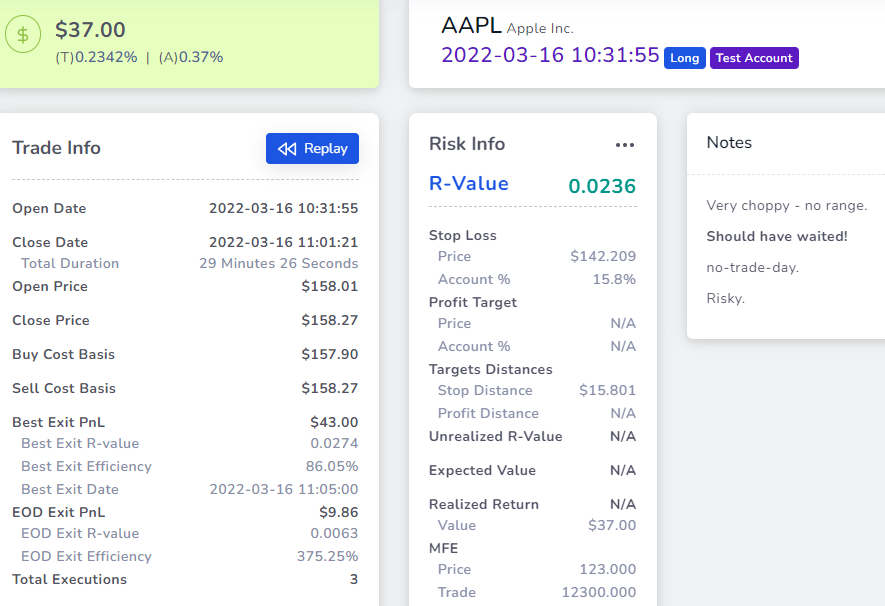
One of the 3 main tabs of TradesViz. View everything - charts, executions, risk info, trade statistics about a trade in this tab. Learn how to customize and add tags, images, charts in this blog post.
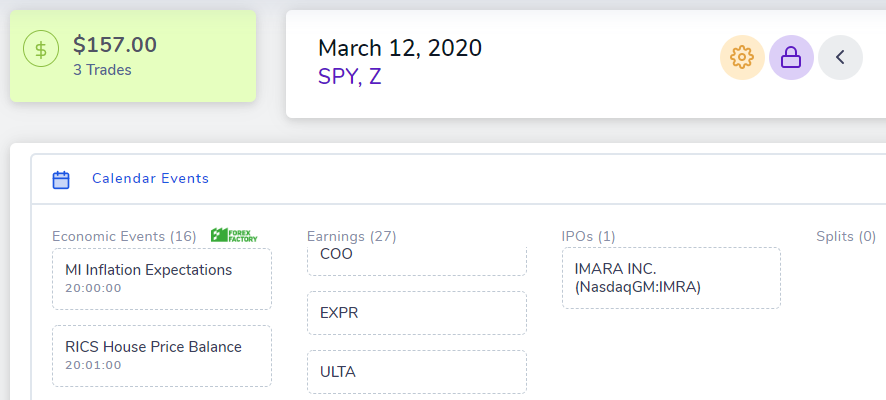
Get an overview of your full trading day with info about all market events such as earnings, IPOs, and also a list of global economic events happening on that day. Learn more about how you can even add charts, share your trading day, etc., in this post.