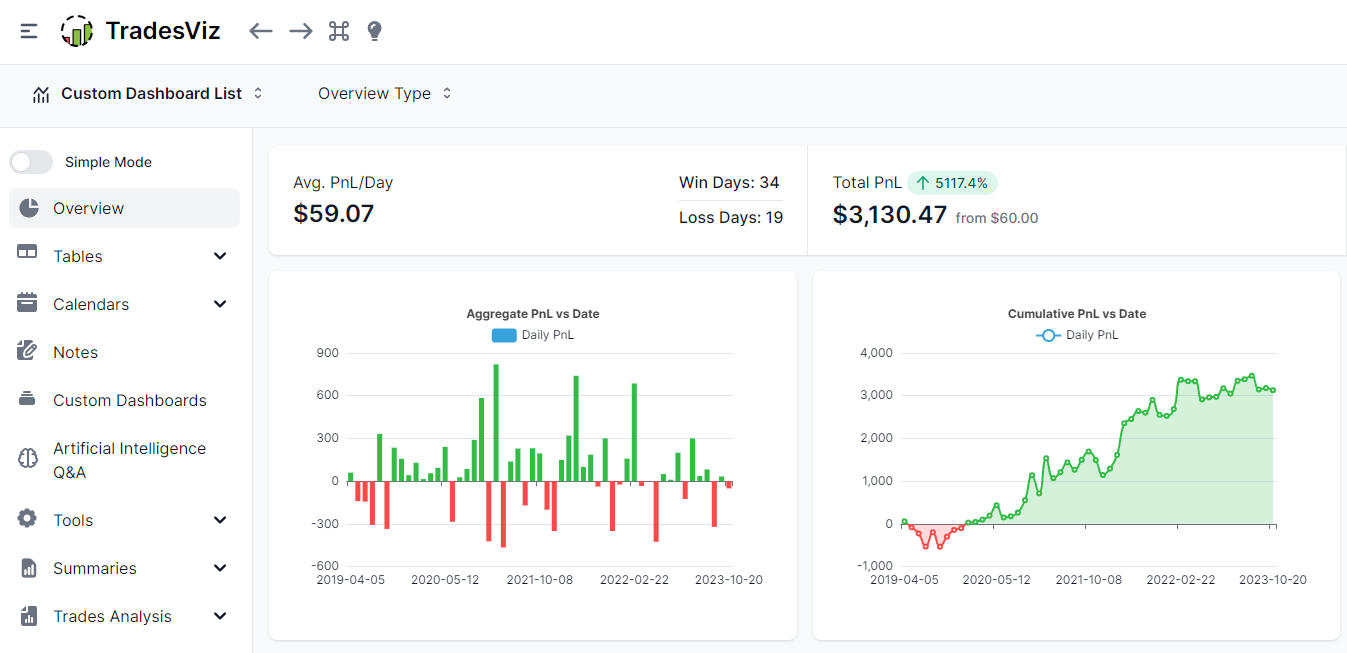
TradesViz v2.0: The next generation of TradesViz & Trade journaling (Complete Dashboard Revamp)
Introducing TradesViz v2.0. The entire dashboard is completely redesigned with state-of-the-art charts and tables to make journaling smooth and seamless for users of all experience levels and on all devices!
Artificial Intelligence Powered Trade Journaling: Queries list and cheatsheet guide
Are you ready to find answers to all your burning trading questions? Have you wished there was a way to visualize a particular stat? The TradesViz's AI query will solve a lot of your trading problems! Read this guide to get a list of queries you can use every day to find deeper insights!
Advanced AI Query Guide for Trade Journaling Querying and Analysis
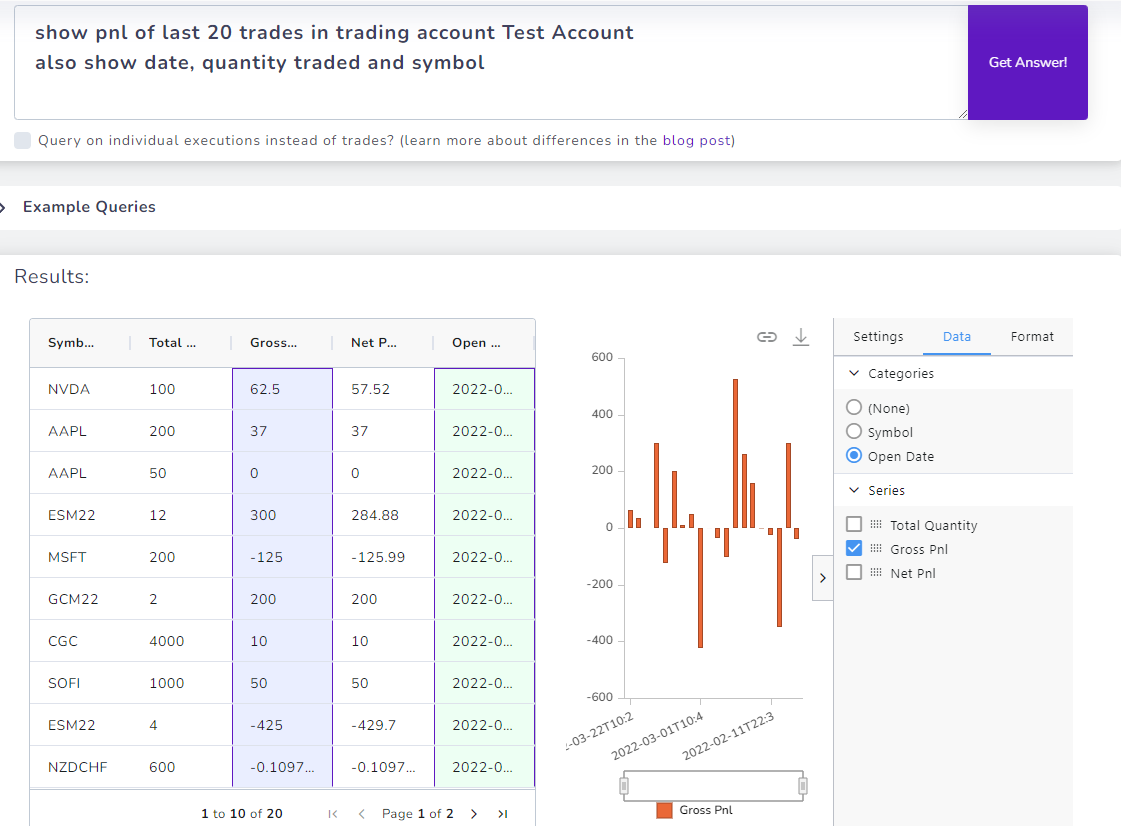
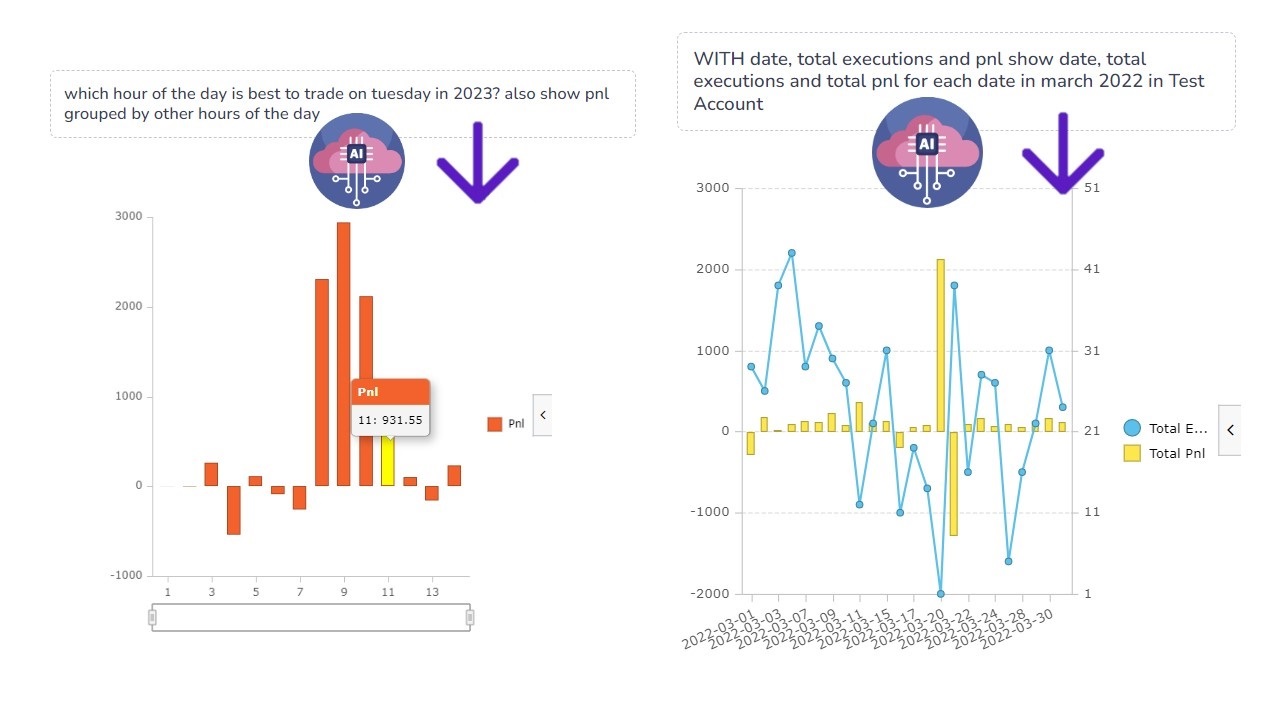
The AI Q&A is a LOT more powerful than you think! In this post, we explore some powerful AI query that gives VERY actionable results and analytics that are not possible with any other platform.
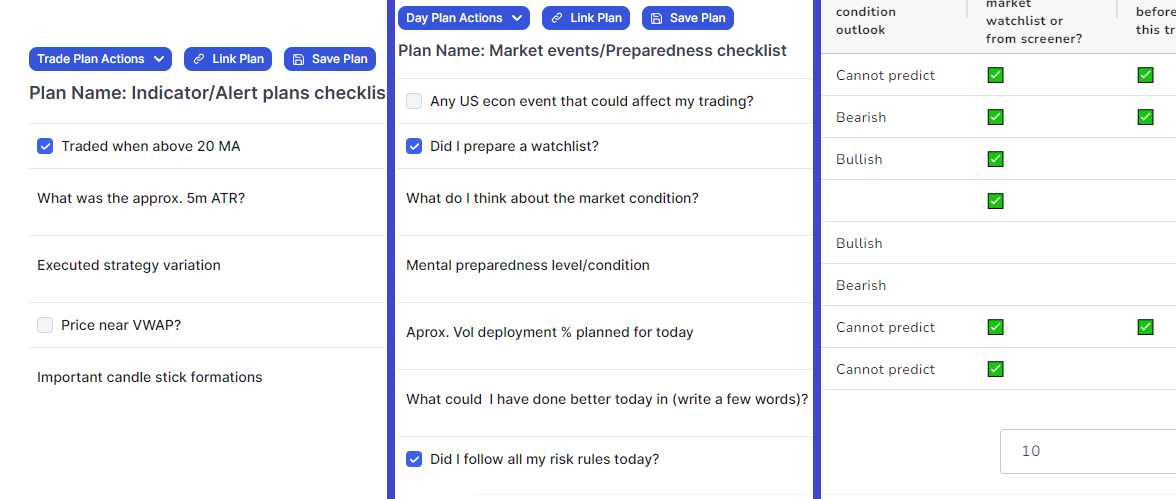
Trade and Day Plans: Examples and use-cases on how to effectively track your trading
Learn all about how to effectively use trading day and trade plans to track your mistakes, and strategies and see how well you have performed with highly detailed and flexible pivot grid analytics.
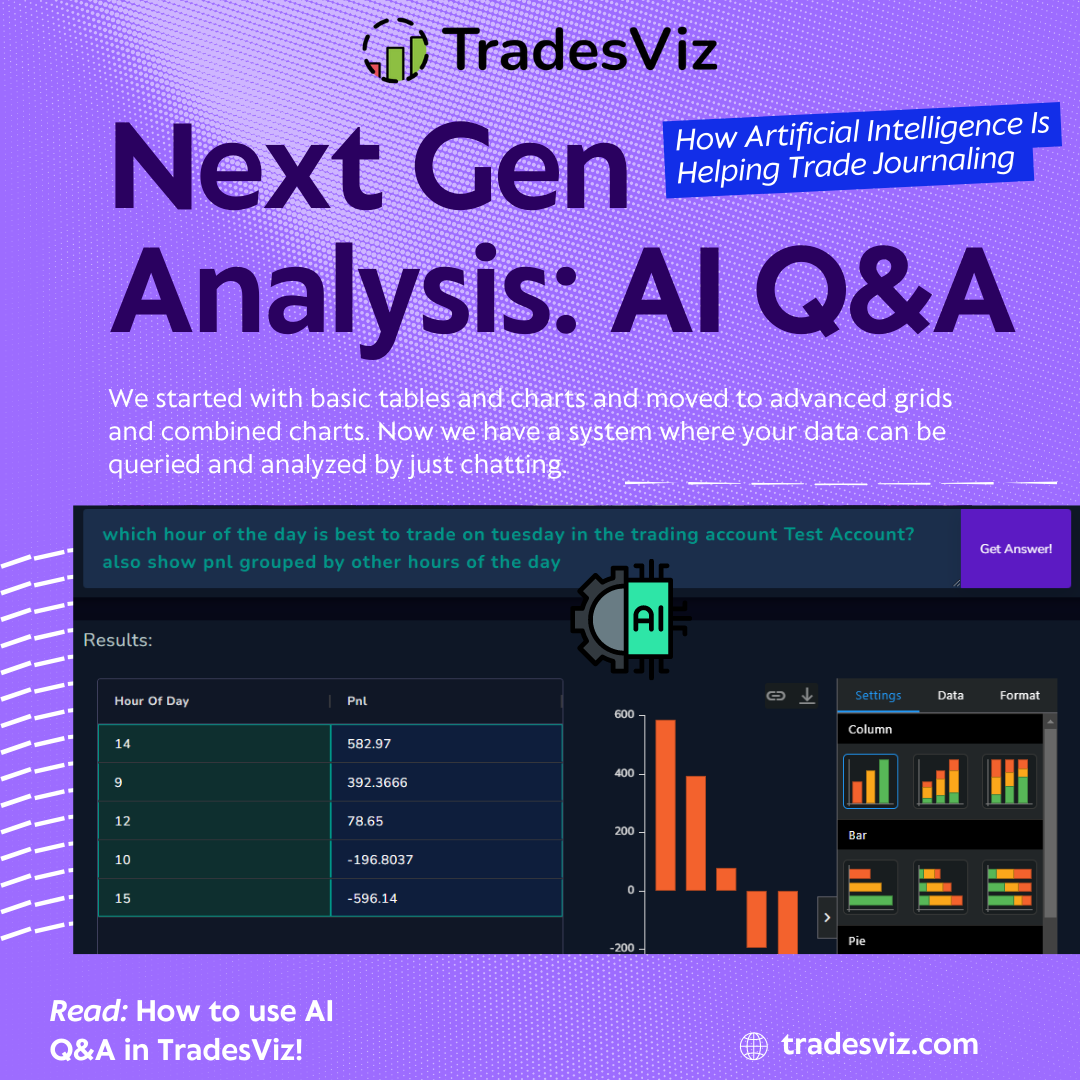
Artificial Intelligence Question & Answer Analysis: Ask and Visualize Anything on TradesViz Trading Journal
The next generation of trading analysis is here: Ask TradesViz anything and get results, charts, and more. Powered by AI, this is currently the most powerful way to analyze and quickly get answers and insights from your trading accounts.