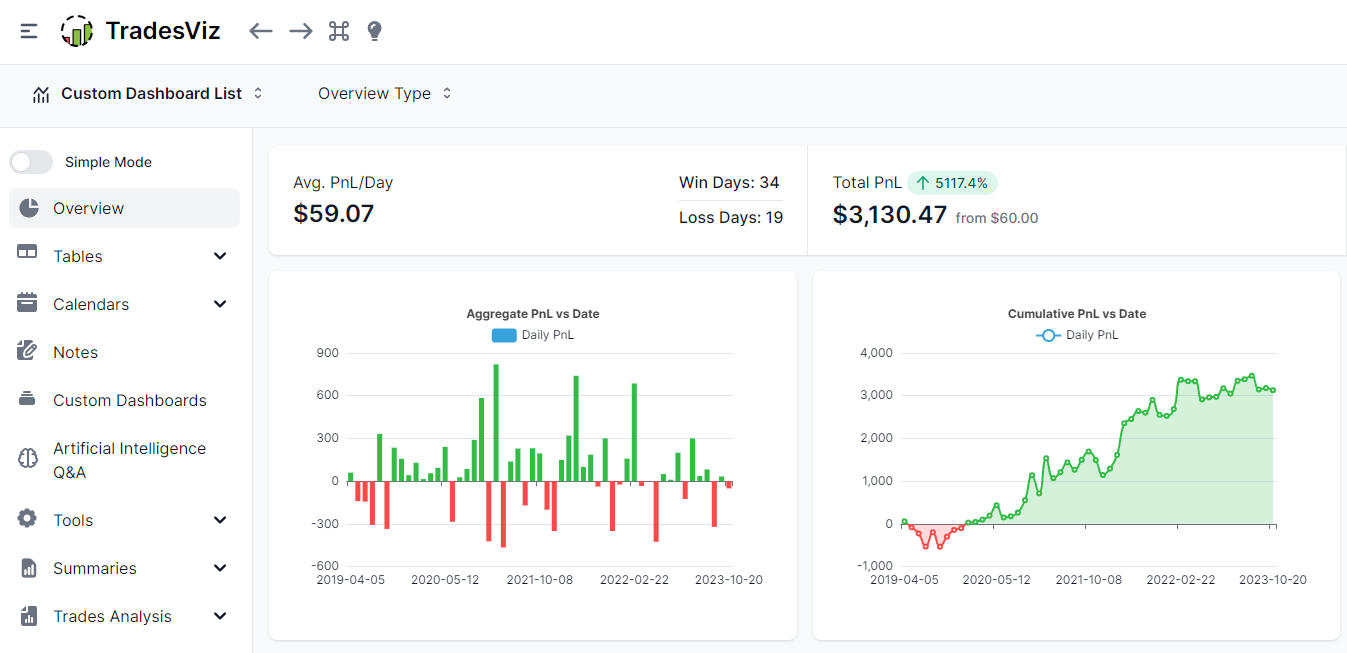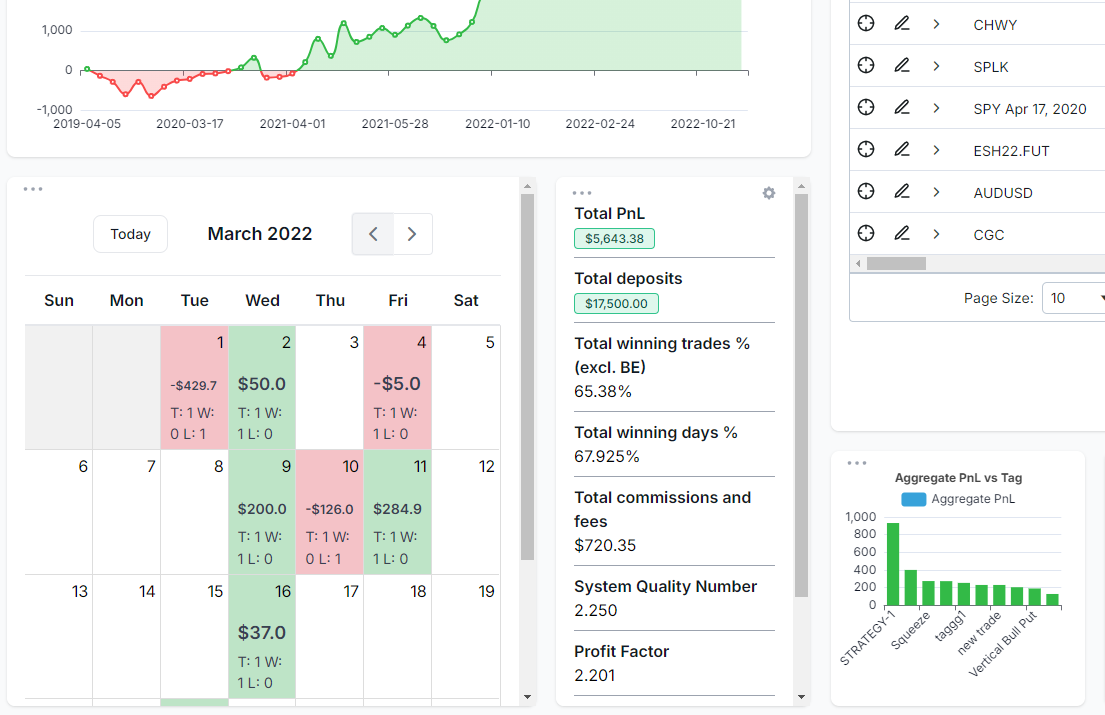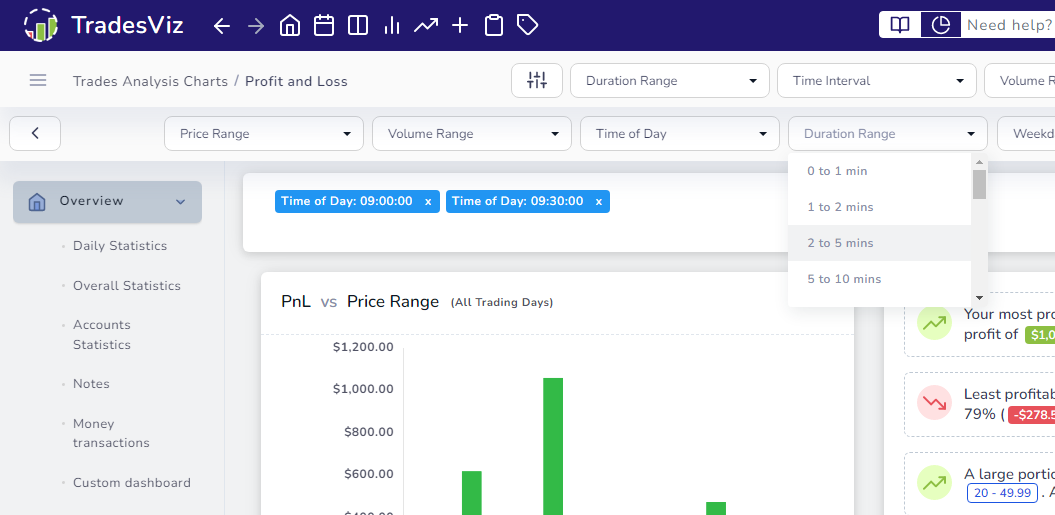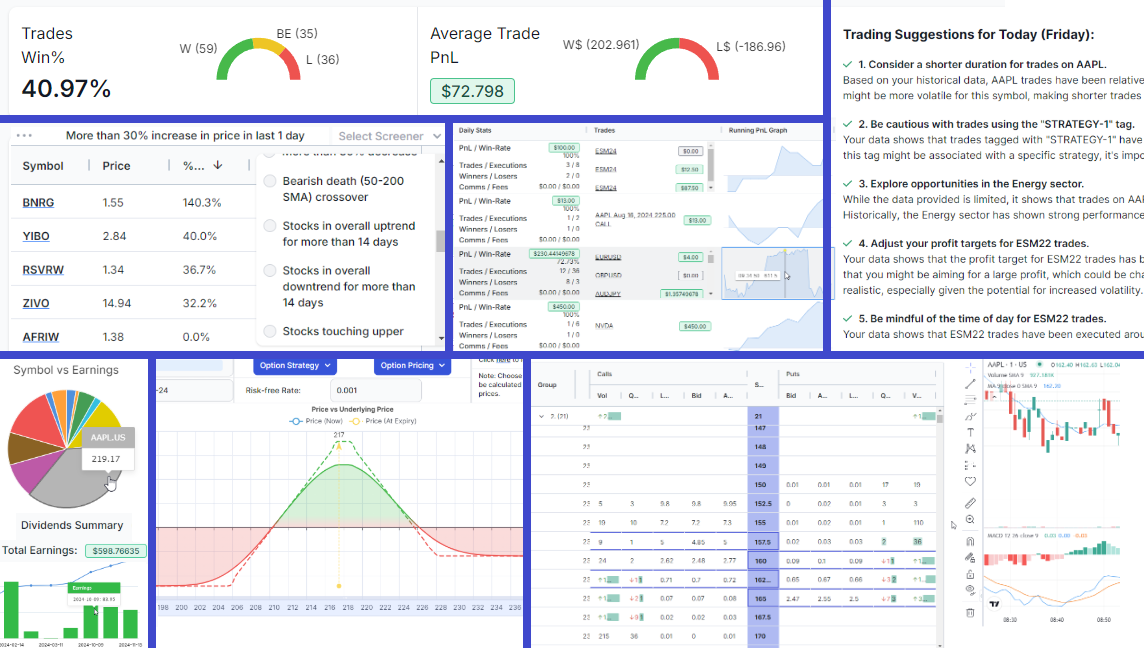
May 2024 to Nov 2024 Updates: Simulator improvements, new tabs, AI summary, dashboard customizations, dividend tracking and more!
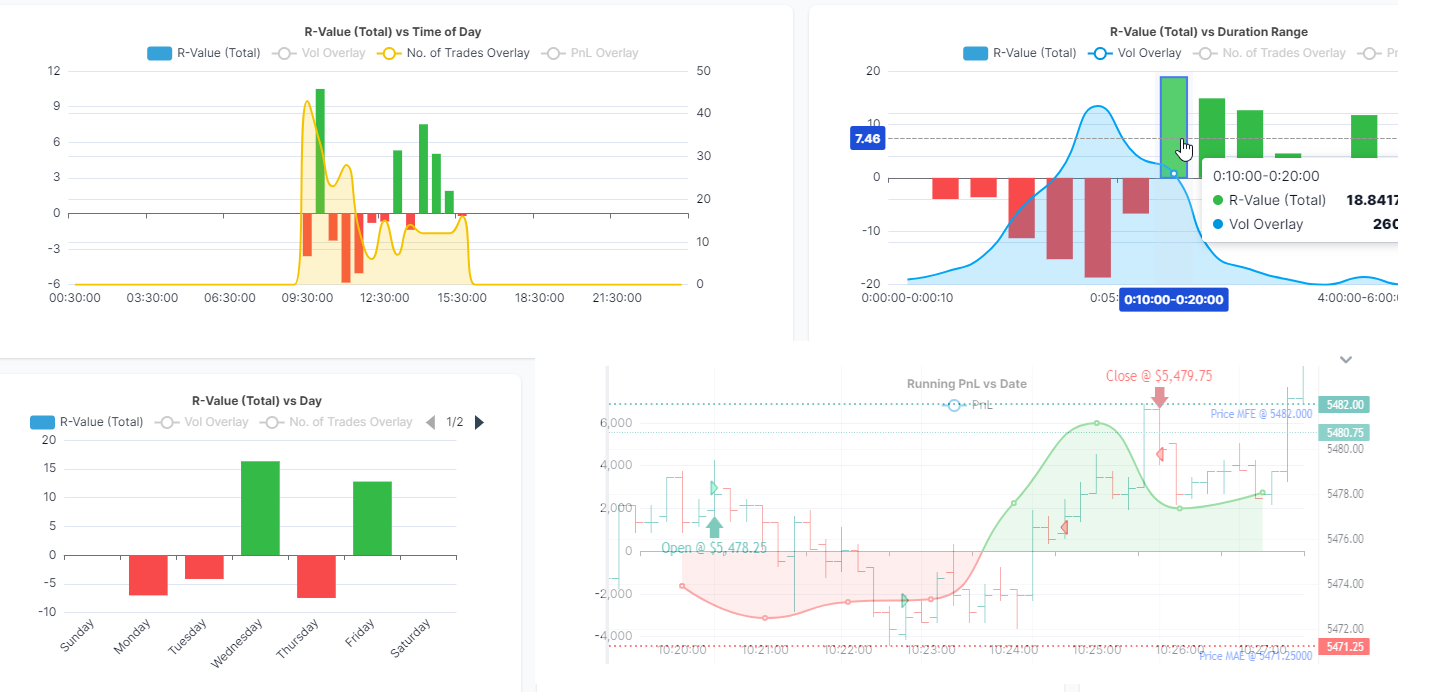
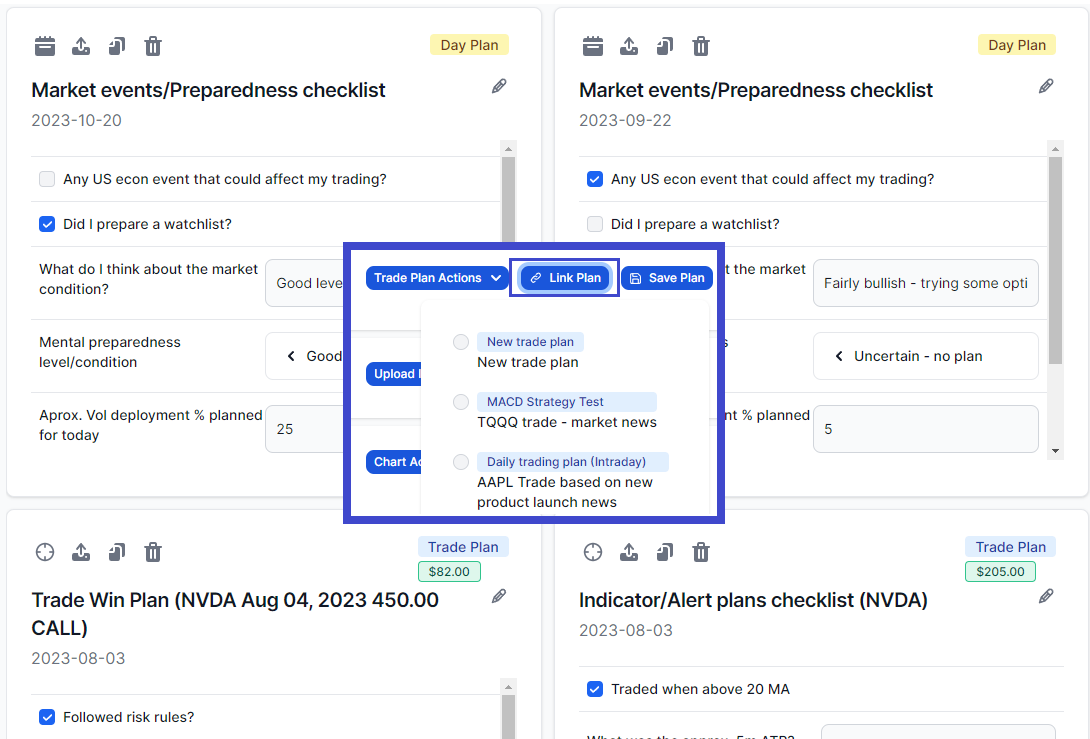
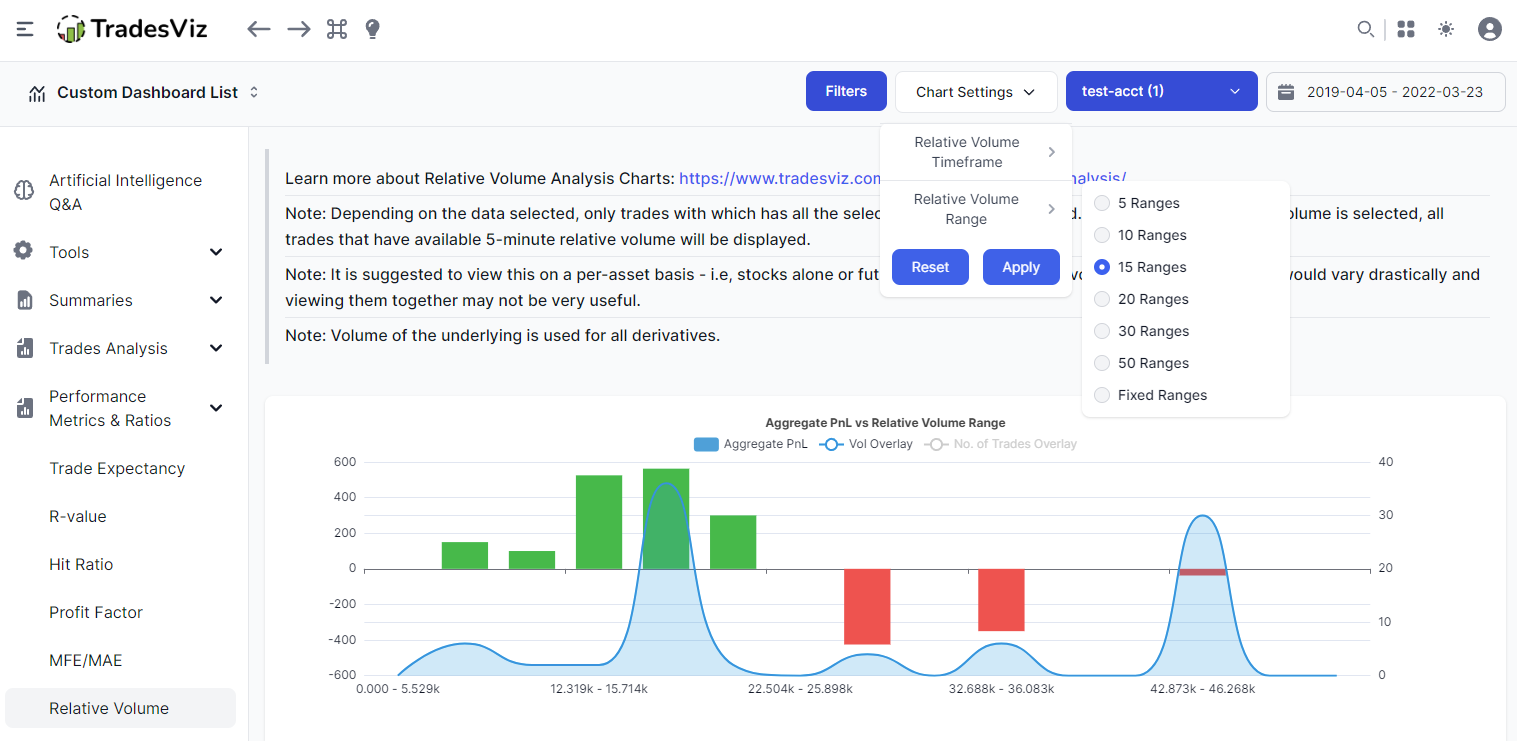
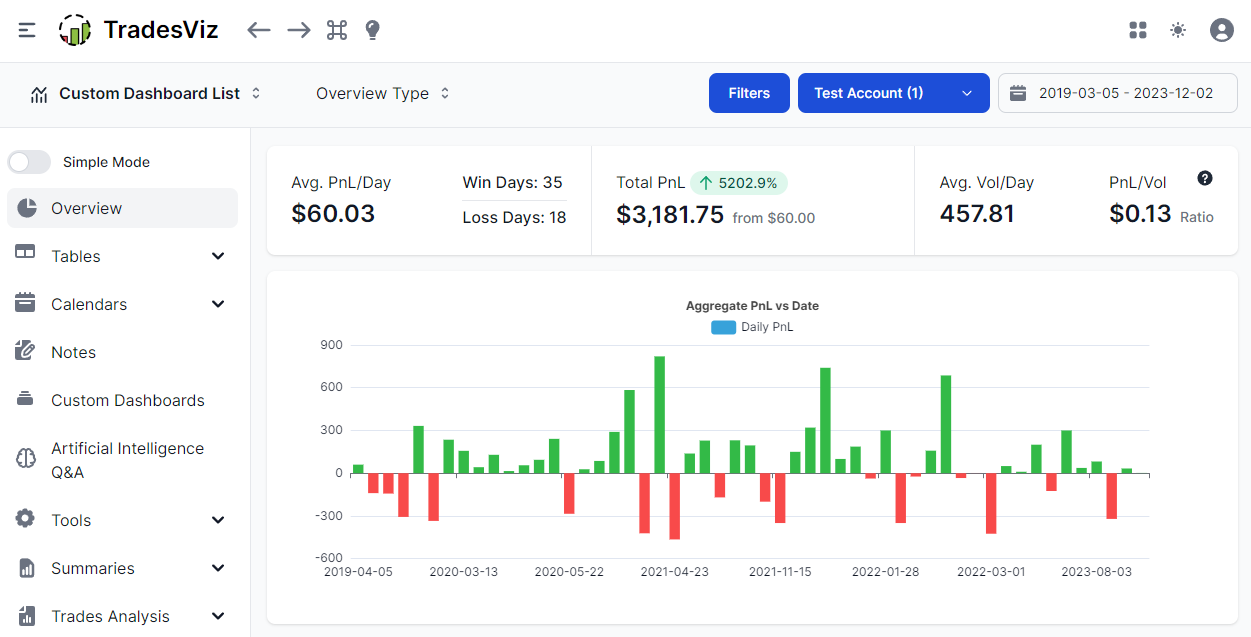
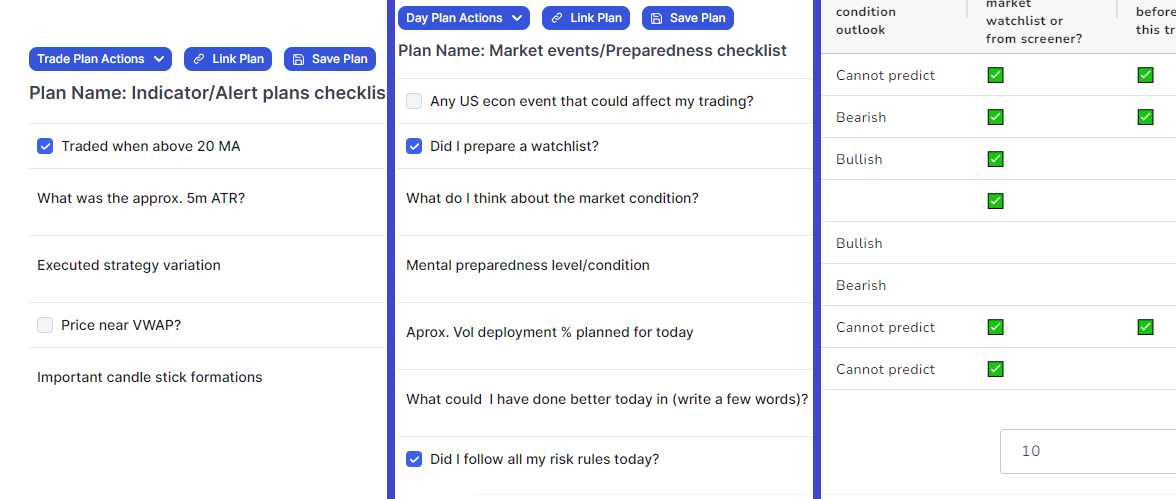
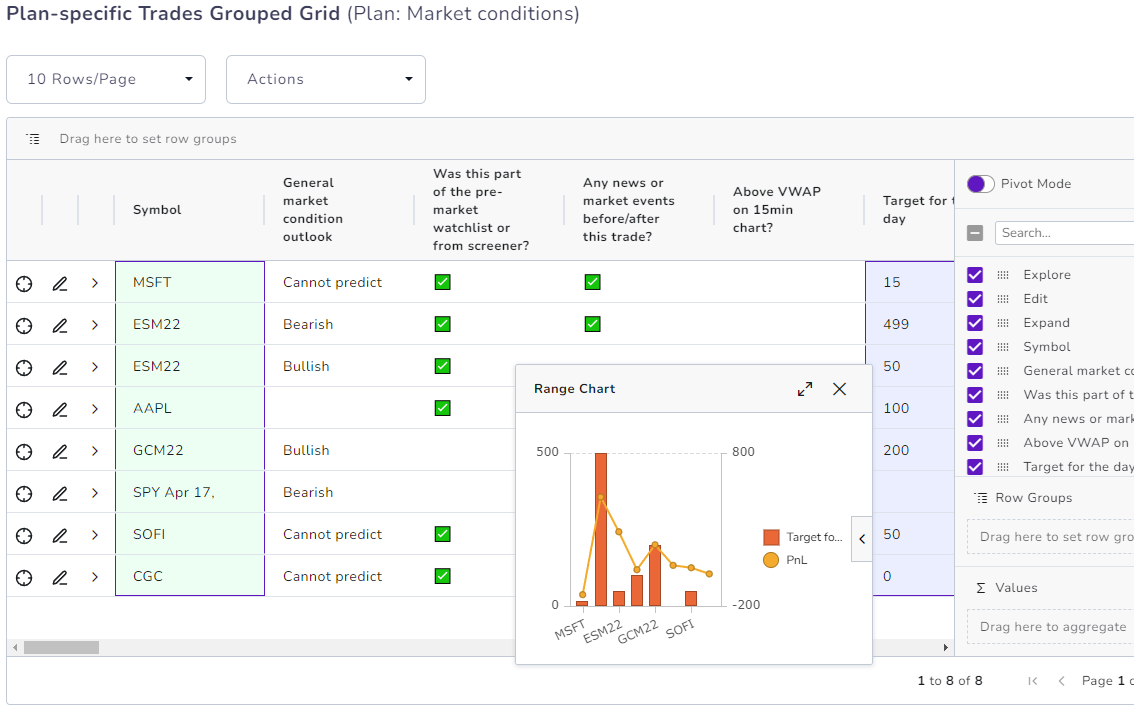
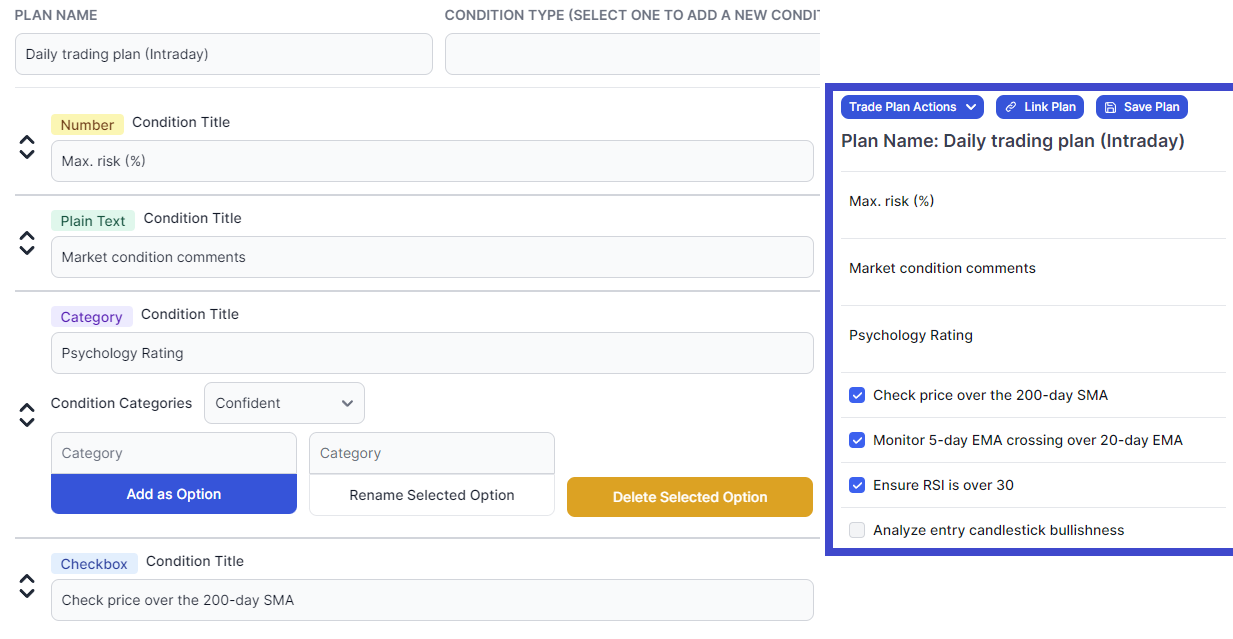
This is what 7 months of continuous improvements look at the world's fastest-growing and most versatile journal. Plans management tag, massive simulation improvements, new auto-sync features, new dashboard, new widgets, stocks screener, and more. Read on to find out what you're missing if you're not on TradesViz ;)