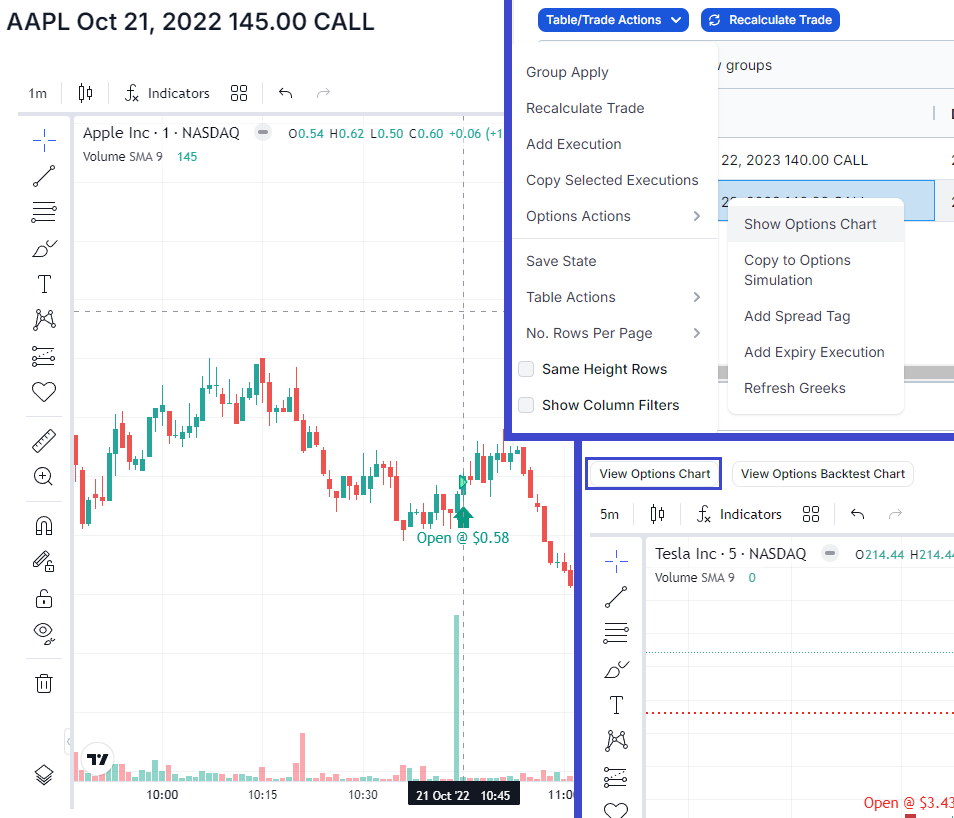
New feature: Options intraday charts
For the first time ever, you will be able to see your exact executions on an options price chart for ANY optionable symbol for any strike/expiry. Exclusive to TradesViz!
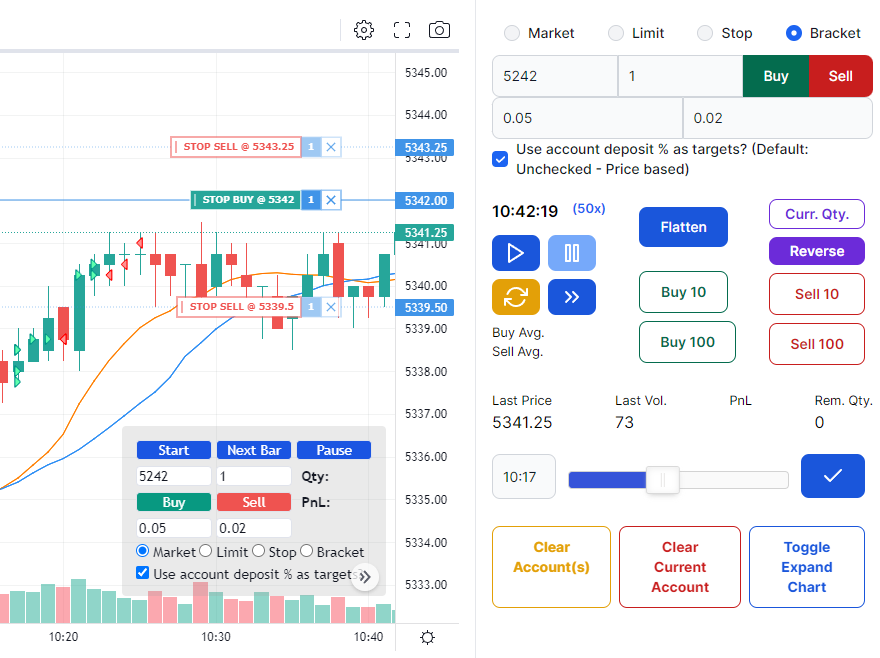
Stock, Futures and Forex Trading Simulator in TradesViz
The second big integration into the TradesViz journaling system is a full-fledged trading simulator for ALL 3 MAJOR ASSETS: stock, futures, and forex. Read on to explore more.
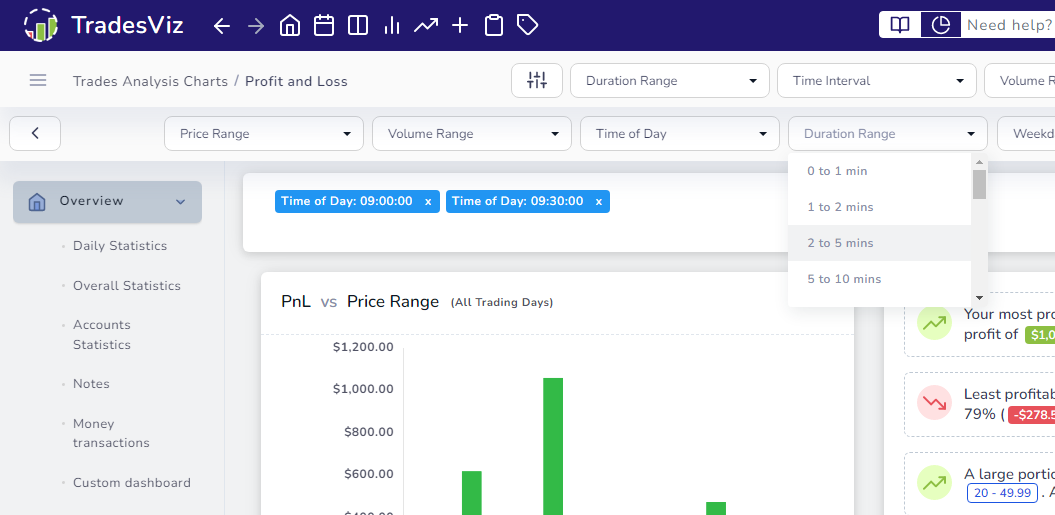
New feature: Quick filters
Over 20 unique filters are now accessible from your dashboard without any extra clicks! 10, 10k, or even 100k trades? Not a problem!
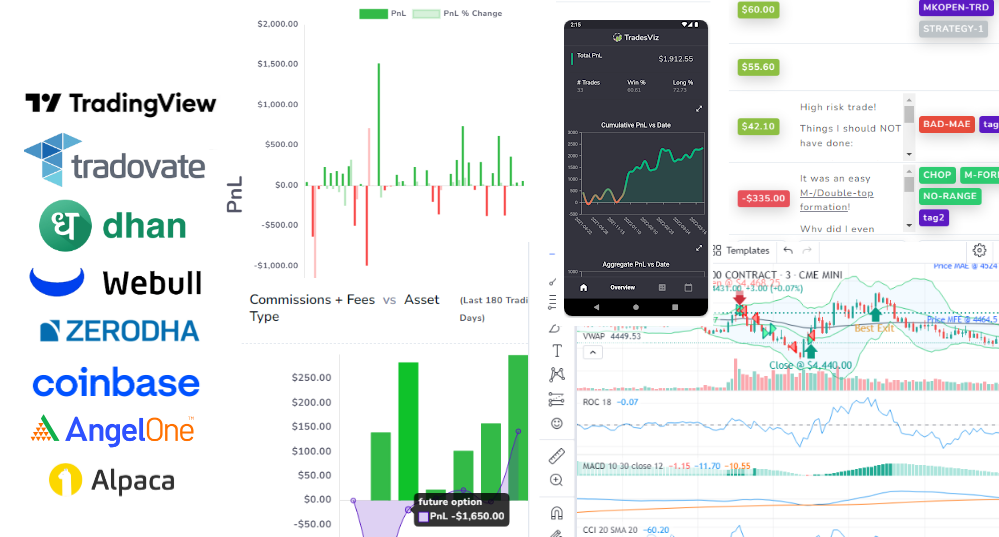
June 2022 to Sep 2022 Updates: More 100% auto-import, Charting improvements, Group tags & more!
A long-awaited changelog. It's been a few very busy months with lots of new features added with a focus on auto-sync and charting improvements!
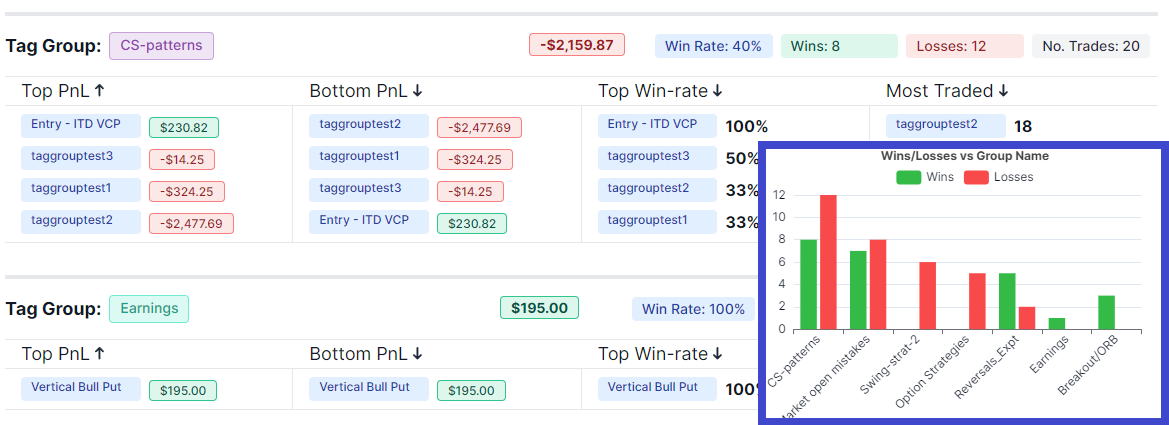
New Tabs: Tag groups analysis & Tag groups summary
We wouldn't just stop at tag groups. With the introduction of tag groups, the first 2 new tabs are about visualizing your tag groups statistics and finding which tags within each tag groups you should focus on.