The most versatile and advanced trading journal for stock traders
-
600+ Charts & Statistics
-
AI Q&A and Analysis
-
100% Custom Dashboards
-
Stock replay and trading simulator
-
Exit analysis (EOD/Best/Multi-Timeframe)
-
Trade plans and tag groups analysis

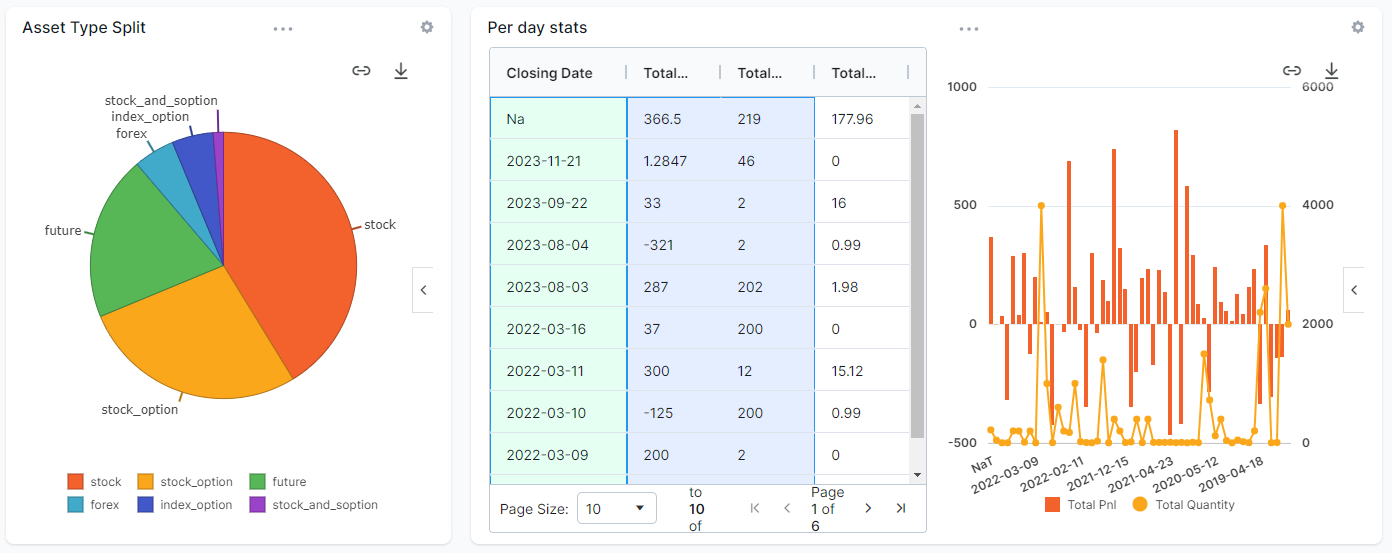
Since 2019, TradesViz has excelled in providing the world's best analytics for stock traders. We started with stocks as our primary asset type when we launched and then later added other asset types. This means A LOT of the features you see on TradesViz are applicable for stocks. From exit analysis, MFE, MAE, distribution charts, multi-timeframe analysis, trend analysis and more, there are over 600 unique stats and charts for you to analyze and find your trading edge from.
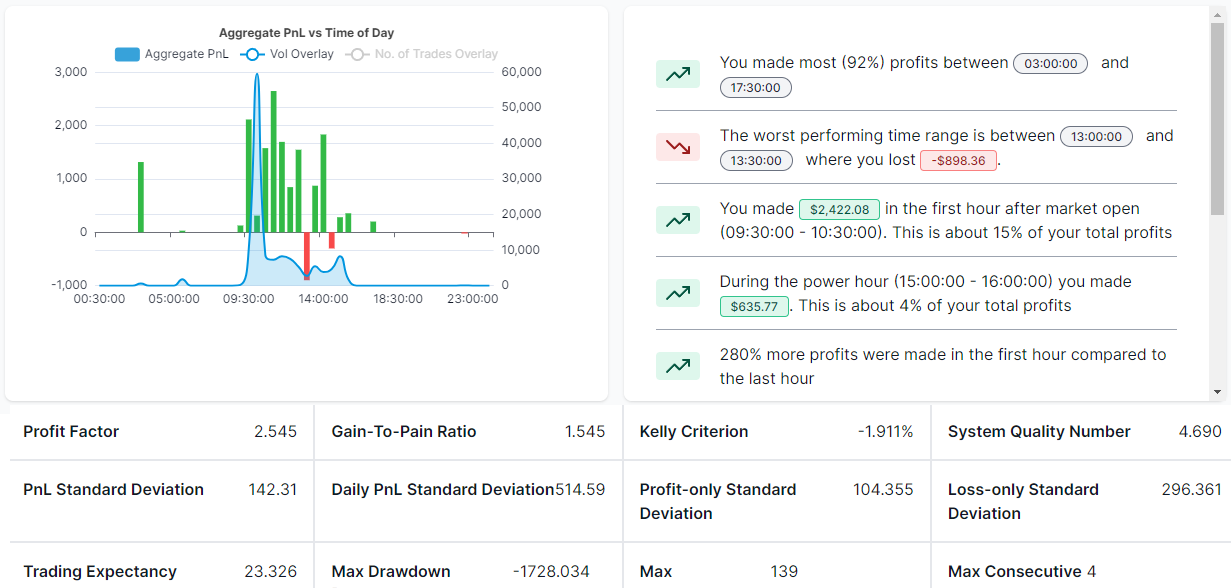
Automated insights for all basic stats
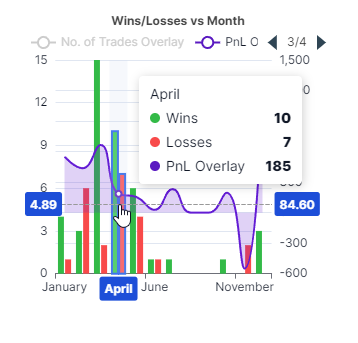
For all the important PnL and win-rate charts, TradesViz will generate automated insights by combining different levels of data from your trades. These quick insights allow you to get an idea of the trend of your performance.


Interactive trades chart for all trades
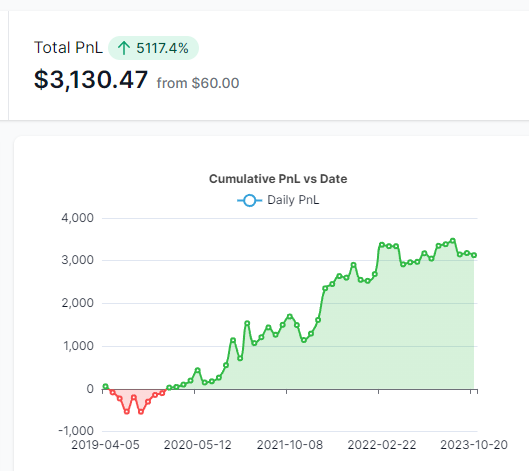
Have you ever wanted to view all your trades on a chart at once? have you wanted to see how your trading correlates with the market conditions from a bird's eye view? TradesViz's chart view is your solution!
Personalized Checklist Analysis
This is the next big thing in trade journaling - combining your personal trade data along with quantitative analysis to provide detailed analysis about your setups, strategies, mistakes and when you are best at trading what and under what conditions.


The most detailed trade view you've ever seen
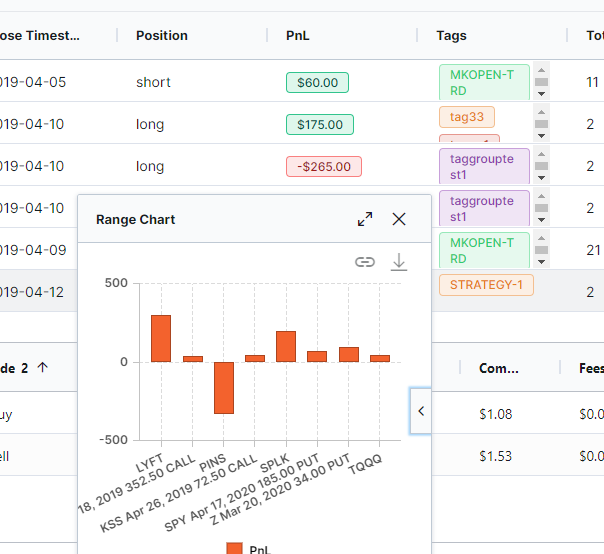
Our unique trade/day explore view is not only 100% customizable, but also filled with useful trading info you will never find on any other trading journals. From interactive charts that you can edit, to executions table, running pnl analysis, MFE/MAE, best exit, R-value, targets estimation, similar trades and alot more in just one tab.
100% Custom dashboard: Your journal, your rules.
One of TradesViz's unique features that every journal wishes it has. Think about this: A blank canvas on which you can add any stats/chart/widget you want - 100% tailored to your trading and not just one, but MANY such custom dashboards. Perhaps one for each strategy? The possibilities are endless!


Dedicated notes management tab
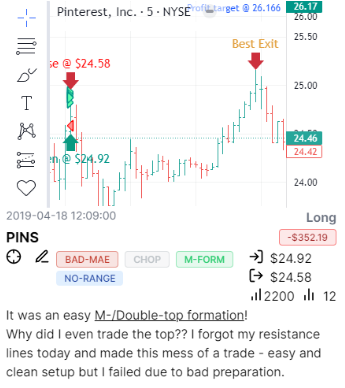
Journaling is not complete without notes - your own thoughts written down manually. No amount of automated analysis or advanced statistics can replace the thoughts that you have during your trade. This is one of the core pillars of journaling and has been for nearly a century. Yet, every other journal ignores note taking - except for TradesViz. We are the only journal to have dedicated features for note taking and management. You can search, tag and attach notes to trades and days and even write down weekly/monthly notes.
Most comprehensive exit analysis solution online for trading in all asset types
Often you might have heard "let your winners run and cut your losers" - that's possible if we had a crystal ball.. but don't.... The closest us traders have is exit analysis and running pnl analysis. If you have been trading for a while, you will know that exit matters more than entries. So we have dedicated a significant portion of our research into providing the most comprehensive set of charts to analyze every trade's best exit, EOD exit, multi timeframe exit and running pnl statistics.


The most advanced single page trading analytics tool available online
Yep. TradesViz's pivot grid has been a massive leap forward in how we think about integrated analysis. Think about this: 40+ categories, 80+ stats 6 visualizations and the full flexibility of an Excel sheet but without any of the learning curve. It's possible to do ANY type of analysis and visualization with this single tab. Click > Explore > Filter > Learn > Pivot > See stats > Repeat.
Tag groups analysis
We're sure you have heard of tags. Some journals even have "mistakes" etc., as categories. But TradesViz is a superset of all of that and more. Tag groups allow you to define your own category and analyze it. Yes, you read that right - no more mistakes or setups - throw that narrow mindset in the bin. Expand your thought process, ideas and possibilities of analysis with tag groups. Find correlations between tags and gain a whole new level of insight that are impossible to get on any other journal.


All asset type simulator
We saved one the best features for the last - TradesViz is the ONLY online platform to have simulator (second-level) for US stocks, futures, global forex and (minute-level) simulation for over 30,000 tickers from US, IN, CA, AU, global indices and also crypto currency using our universal simulator. This is just one part of our simulator features. TradesViz also features a multi-simulator and all simulators come with detailed order placing mechanisms (market, limit, stop, bracket in $/price/ticks/%) and every trade is stored in your trading journal. Along with this, you can also replay all replay all of your trades in your TradesViz trading journal.
All asset type backtester
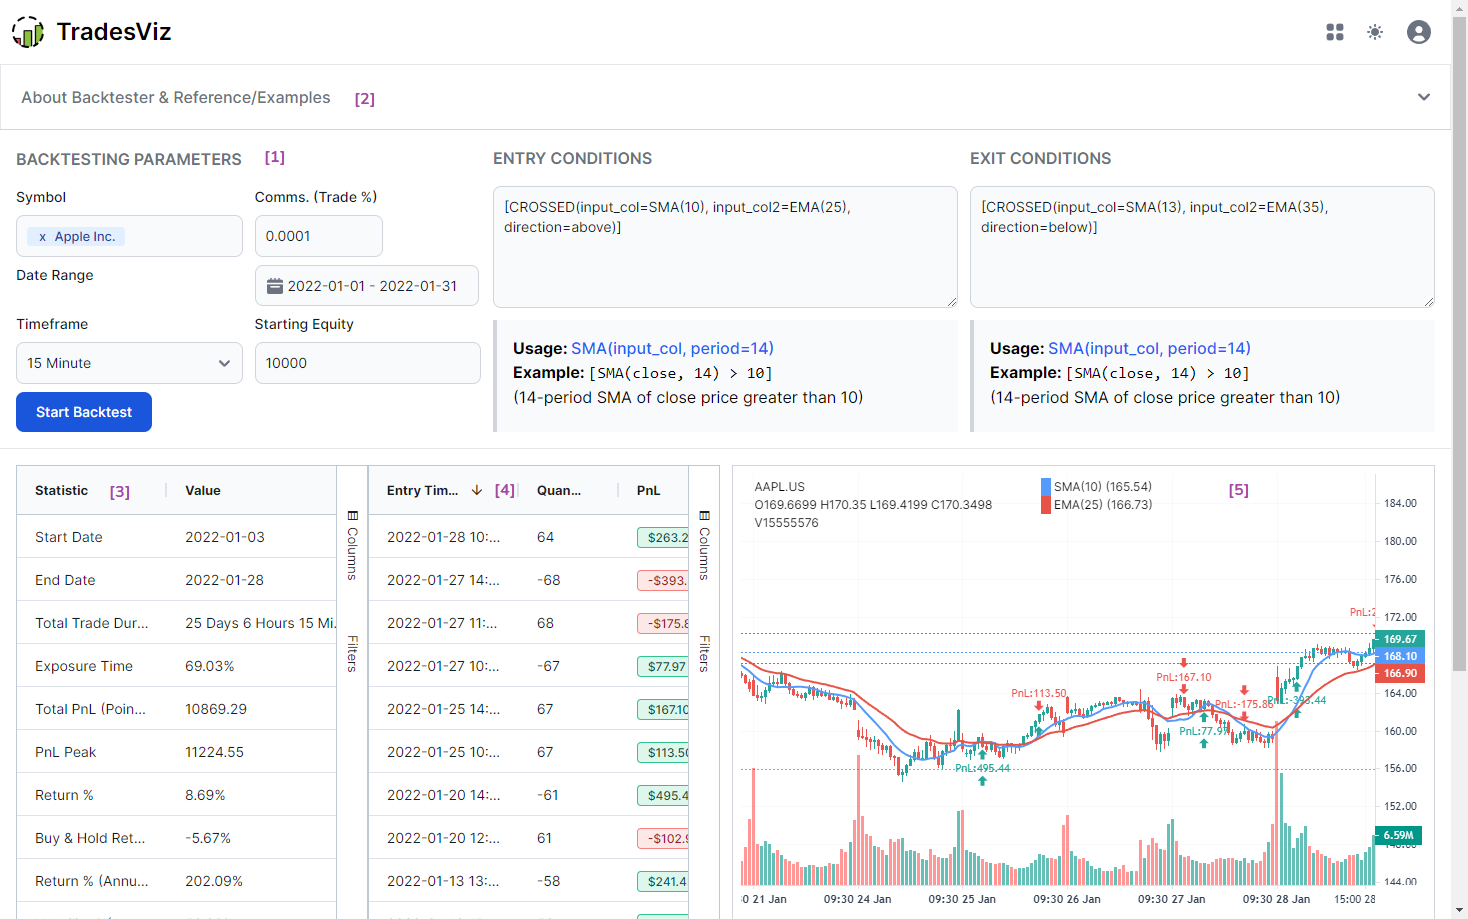
We didn't stop at just trading simulators. Simulation, Replay, Backtesting - different tools a trader can use to practice and learn to deploy the right strategies at the right time in the right markets. TradesViz features a full technical analysis based backtester for 30,000+ symbols on all timeframes. Backtest on Intraday, daily, weekly and more timeframes using 70+ unique indicators. All powered by EZstockscreener , our own advanced stock screening engine.

Automatically sync your trades from the best platforms in the world
With more brokers than ever providing API access, TradesViz still remains the most integrated platform in the world when it comes to broker/platform connectivity with nearly 40 auto-sync broker/platform integrations!
All-in-One Platform for All Traders
TradesViz is designed to be used by traders just starting out all the way to professional traders. The level of customizability and versatility is unmatched by any similar platform.
Replay, Simulate and Backtest Trades
You can simulate Stocks, forex, futures and even options on TradesViz. On top of this, you can even replay your trade second-by-second and backtest options using options executions simulator.
Trade Plans & Mistakes Analysis
Add trade plans to each trade and trading day to see what rules you break and how they affect your trading. Zoom in on your trading behaviour from a data-driven perspective.
Charting customizability
Add multiple static image charts, setup custom TradingView charts with your executions, MFE/MAE targets and more automatically plotted for all your imported trades!
Unlimited Reports and Analytics with AI
Gone are the days of fixed charts you cannot Customize. With AI Q&A, you can now ask any question about your data and get charts, tables and even add them as custom widgets to your dashboard!
Dedicated Note Taking + AI
Write notes, tag your notes, search your notes and even ask the AI to generate trade summaries as notes for your trades. TradesViz has a dedicated note tab for all notes management.
Advanced Statistics
MFE/MAE, R/R ratios, Best/EOD Exit, Multi-Timeframe exit, Market-TA-Comparison, Running PnL analytics, Options greeks analysis and more - all of these on top of existing PnL charts make ~600+ charts on TradesViz.
Not just another journal. We pushed the boundaries of journaling.
With a team of data scientists, researchers and veteran traders TradesViz is built with a singular focus of improving trading performance in a data-driven way.
160+ Blog Posts of In-depth Journaling Guides + Always-on Support
We didn't skip the most important part out: Education. We update and launch new educational blog posts every few weeks + Post plenty of tips, tricks, trading news/info and journaling knowledge on our Twitter/X feed!
 Dashboard Overview
 Trade Management
 Group Apply
 Trade Explore Tab
 Day Explore Tab
 Equity Curve & Account Balance
 Calendar Tab
 Custom Dashboard & AI Widgets
 Trades Table
 Filters & Toggles
 Trade/Day Plans & Analysis
 Artificial Intelligence Q&A and Custom Widgets
 How to setup Interactive Brokers (IBKR) Flex Query for Auto-sync
Not just a trading journal -
A Trading Partner for all markets!
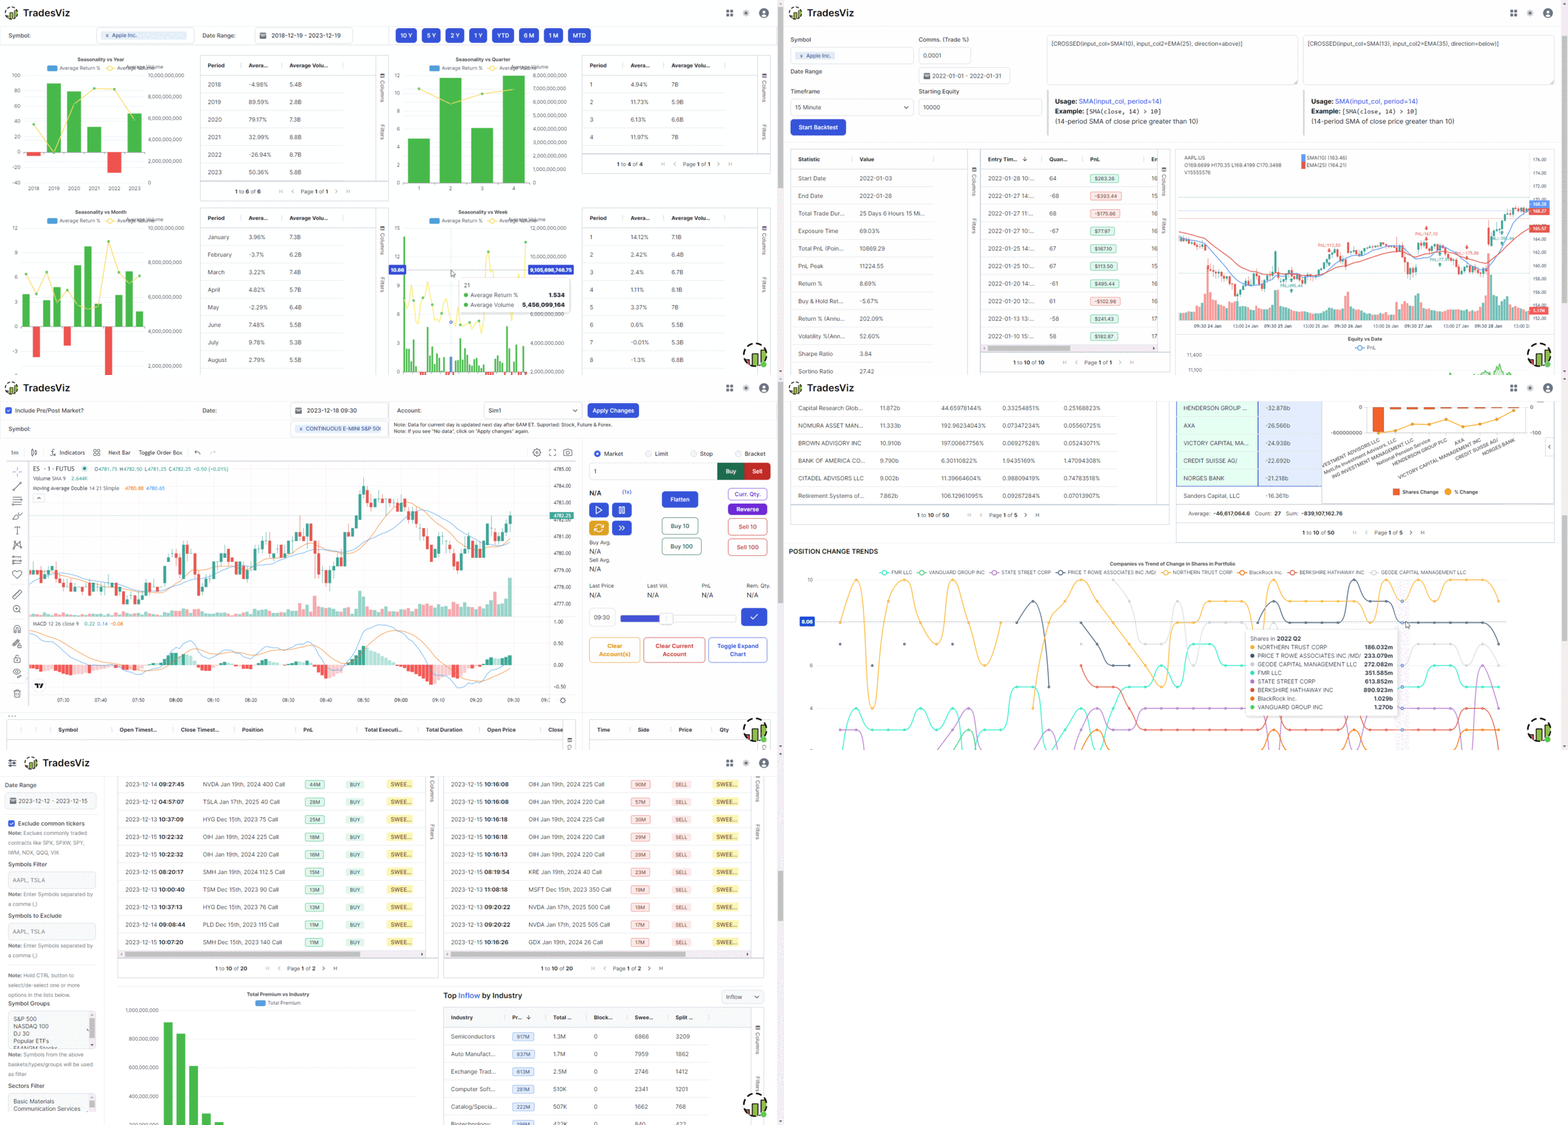
TradesViz is a unified trading analysis platform that offers not just the world's best trade journaling capabilities, but also other tools that are tightly integrated to provide a 360 degree support (via tools) to traders looking forward to mastering the market.
- Trading Simulator & Multi-Chart Simulator
- Options Flow & Screener
- Technical Analysis Backtester
- Fundamental Analysis/SEC13F Visualization
- Seasonality Analysis
- Side-by-Side Strategy Comparison
Value worth of $300+ per month is available to all traders of TradesViz at less than 1/10th the cost.
Highest value per dollar on the market
At TradesViz we focus on value and utility provided to traders. That's why we're still #1 when it comes to the value and features offered on an online trading journal.
Our guarantee: You will not find a better, more versatile, constantly up-to-date trading journal even at 2x or 3x our price. View Full Pricing.
Basic
For beginner traders to get started with journaling.
- Import 3000 executions/ month
- 50+ Performance Visualizations
- Basic auto-generated charts
- All basic trade management features and trade charts
Pro
All asset type import + 100s of charts & powerful grid features.
- Unlimited imports + All asset type support
- 400+ Performance Visualizations
- Multiple auto-generated + Interactive stock charts
- Multiple trading accounts
- Artificial Intelligence Question & Answer
- Artificial Intelligence Trade Summary
Platinum
All-in-one journaling, simulation and advanced analysis platform.
- Every feature in Pro
- Unlimited Custom Dashboards
- Advanced Options flow analysis + Options flow scanner + Options Payoff Charts
- Multi-Timeframe/EOD/Best Exit Analysis charts
- Trading Simulator (Stock + Options + Futures + Forex)
- Pivot/Grid Charting (Most powerful analytics feature online)
- Trade/Day Plans & Checklist analysis
- Backtesting (70+ Indicators/Any Symbol)
- Dividend Tracker
What Trading Experts Say
TradesViz is the only trading journal in the world to be recognized internationallyby the popular Benzinga FinTech Awards Competition as a
Finalist in Best Data Analysis tool and Best Portfolio Tracker categories!


TradesViz is the most useful trading journal on the market for finding and quantifying your edge. An all in one trading journal tool for traders.

Trader, Author, and founder of NewTraderU.com
PK and the whole team at TradesViz.com have put together an outstanding product with exceptional features. PK provides the most excellent support in the chat help. And if something really isn't working quite right or as expected, they get busy to make it better. I originally signed up for TradesViz to have the simulator function which also gave me the statistical analysis I could use to improve my trading. I had been using a simulator which had almost no analysis. When TradesViz added the simulator function I gave it a try. At first I had a hard time making it work, but with patient explanation from PK and with some tweaking on functionality from the coders on the backend, they have delivered a super trading simulator. The trade analysis part of TradesViz is second to none. I've gained the insight into my trading weaknesses and strengths to be able to trade much better in my live account. This is the service you need!

I definitely recommend Tradesviz especially for new traders the way it tracks your stats is no short of amazing especially for me personally by best exit and and of the stats that tell you how long you usually are in drawdown and you are usually in profit. If you want to build confidence in your strategy and edge this journal is the way to go for sure!

TradesViz has made a huge difference in my trading and has positively impacted my trading for the better in psychology and profit.
I use it DAILY and have noticed the vast improvements being made, not only in profit but also in my mental approach to trading.
This is a must-have tool and is more important than any indicator you could ever use.

I've subscribed, at different times, to various reporting programs, and trialed several others.
Yours is night and day over them all. I particularly appreciate the degree of available customization and your quick, ever-patient response to support requests.
I have a small trading account. Thank you for offering such a sophisticated program at an affordable price.

TradesViz is a true leader in Trade Journaling Software. They offer extensive statistical data at an amazing price that almost seems too good to be true. You have access to an amazing support team that seems to be active at all hours of the day. My support agent helped me through a complex import issue and had it solved within 24 hours. I can't tell you how blown away I am with their software and their service. I'm more than happy with my experience and so excited to see what new features they bring to the table as they continue to grow their business. If you're on the fence, I encourage you to jump right over and take it for a spin with their risk-free trial. Thanks to all the TradesViz team members who continue to make my Trade Journaling efficient and effective.

Day Trader
GREAT PRODUCT AND EVEN BETTER CUSTOMER SUPPORT!
I have been using TradesViz for a few months and it is a fantastic tool. Prior to subscribing, I was spending hours on xls trying different tables and layouts and only getting frustrated (or overcomplicating things!). Now I have everything in one place (I have multiple trading accounts), and I have probably only explored 10% of the tools and data analytics!
BUT, what has really impressed me is the support: I have NEVER in the last 10 years had such instant, professional support from a company at (almost) anytime of the day or night!
Clearly this is a team that is passionate about their product and that will always translates into innovation and better experience & value to the customer.
Well done to the team!!

After only a short time of using TradesViz, I can confirm that this platform is exactly what I have been looking for. It takes the chore out of journaling – the number of stats, data, and information available on my trades is a complete game-changer. The importing process via MT4 file is extremely easy and the automated charts with entries are amazing. The whole process is extremely easy and helps to keep me accountable for my trading by having a professional system to manage my business. The platform is very comprehensive and takes a bit of time to get used to, but they have many videos on their YouTube to help with this as well as their support team.
Their support is exemplary and gets back to all my queries in well under 30 minutes with comprehensive answers and solutions to my questions.
This platform is absolutely essential for any trader and I would highly recommend it to any of my trader friends looking for a journal. If you don’t have this platform, you are seriously missing a trick here…

Thanks, PK from TradesViz for being extremely helpful and patient in resolving my syncing issue. Certainly one of the best online support I have ever experienced. Even though it took a while for me to get my settings right, I never felt rushed...I appreciate that. Hope to stay with you guys for a long time. Certainly would like to learn how to utilize most of the features on TradeViz.

In my opinion, the TradesViz platform is truly the Ferrari of journaling software available today. Once you are under the hood, you begin to realize that in fact what sets it so far apart is all the advanced analysis at your fingertips. Such as the ability to combine multiple portfolios, live charting, and much more. Their support is world-class, in my case personally, I needed integration with Trend Spider’s backtesting engine. What I imagined might take weeks was literally accomplished overnight. Factor in rock bottom prices and you have all you need for whatever you're searching for. Newer traders will find that one of the most basic recipes for success is meticulous record keeping, simply observing your account profit and loss go up, or just down as the case may be, is the first step on the road to ruin if your serious about trading.

Trader
I'm writing this testimonial as appreciation for this surprisingly pleasant
conversation.
Upon my initial support request, TradesViz's support was impressively swift. A response appeared every single time as soon as I closed my email tab. Not only did I receive incredibly helpful information about features I wasn't aware of, but the team was also genuinely enthusiastic about discussing my feature requests and ideas about the industry. Truly awesome people!

In terms of raw analytics, comparison, and filtering capabilities, there is no match for TradesViz. I also don't know of any other trading journals that offer so much for the price, their free version has pretty much everything you would need if you trade stocks and offer so many of the paid features that are on other websites for free. They have templates for almost every broker and if it's not there, their support team is only 1 email or message away and will work with you to include your broker on their platform. By far the best support I have gotten from any trading journal as they are open to feedback and feature requests and are very active on their chat for any questions. A trading journal built by traders, for traders.

Professional Futures Day Trader
I wish I had TradesViz when I started to trade ten years ago. I had to learn the hard way. It provides everything you need to maximize your wins and minimize your losses.
There’s a learning curve but once you get past that your trading will surely be taken to the next level.

Founder of ChartLearning.com
As a full-time trader, the first pivot point in my trading results came after I started to learn from Mark Minervini - this is when I stopped losing $$$. The second pivot point came after I started to analyze my results - this is when I started to be consistently profitable $$$.
I love that TradesViz works for Options, Stocks, Crypto! It has automated and manual uploads. It has all the important metrics and analysis that you will need and it is fully customizable.
I have tried pretty much most of the products out there, and TradesViz wins by a mile - highly recommend it! Thanks to PK and the team!

Thanks, @MightySoldiers for turning me on to @tradesviz. I'm loving the customized dashboard. The level of detail and ability to really dig deep on metrics is unparalleled. This tool has helped me so much in defining my trading strategy and where my edge is.

Trader
I was looking for a solution to journal my trades on multiple platforms to keep track of my PNL. I stumbled upon TradesViz and I have nothing but positive to say about their service. Not only does their product make it so easy to see how you are doing on your trades with the various graphs and filtering options, getting your account synced is super intuitive. Best of all their customer service is top-notch. Every time I have asked a question, they have responded within a few hours with a solution, and sometimes that involved programming custom solutions for me to make my life easier. It's a no-brainer for me to pay for the yearly service. Do it, you won't regret it.

E-commerce Analyst and Trader


