
Trades import issues: Common mistakes and how to fix them
If you are having any import issues, chances are that this blog has answers to fix them. All common import issues and fixes are explained here.
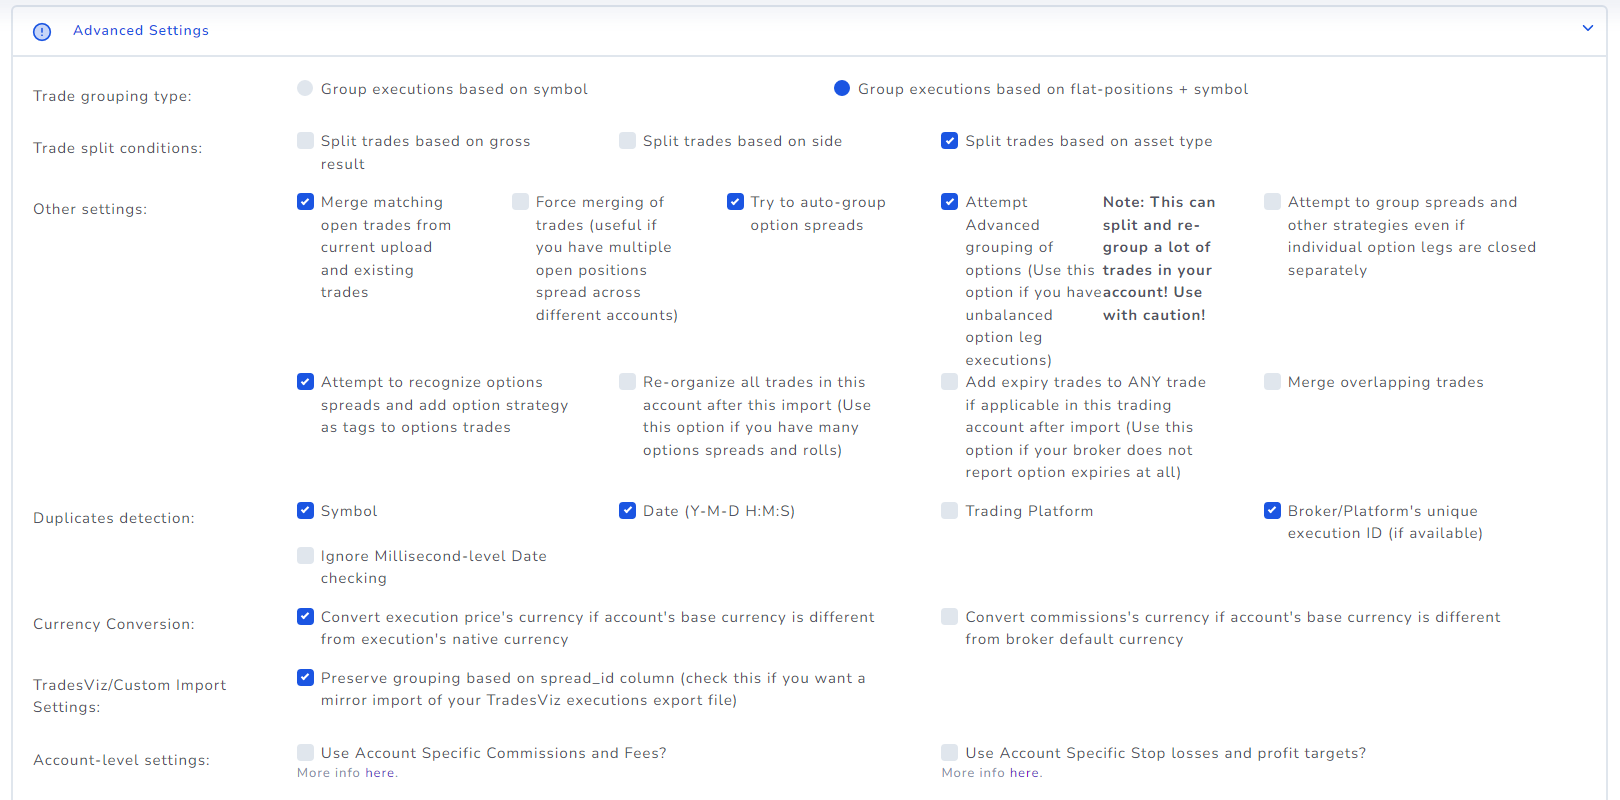
Complete guide to import settings in TradesViz
Wondering what import settings to use? Are you not satisfied with your trades grouping? Read this blog to know more on how to get the perfect grouping on every single import!
How to effectively use a trading journal
Are you wondering if you need a journal? or are you having trouble with using one? This post is for you. All you need to spend is just 10 mins per day on your journal and you will be on your way to becoming a better trader!
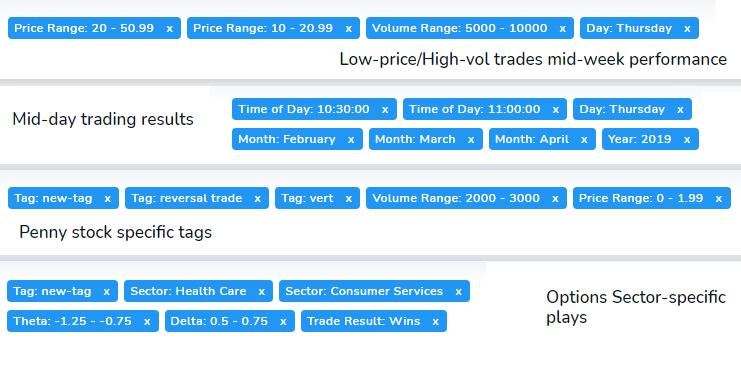
Build your own custom trade reports
Build a trade report using conditions ranging from price, volume, ATR, win/loss, etc., and save it to access and view statistics of trades filtered by those conditions any time!
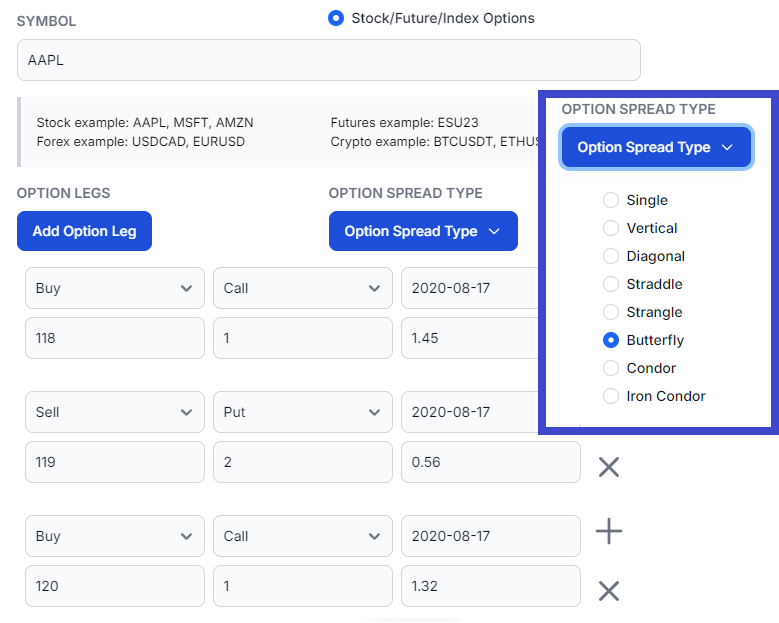
New feature: Option spread/multi-leg input
Learn how to input multi-leg option spreads - iron condors, butterfly - no more inputting manual executions! Add any no. of legs to your trade and easily edit them!