New feature: Dividend tracking and analysis
Another huge addition for traders of TradesViz! You can now easily add and/or build import dividends and track them seamlessly on TradesViz journaling itself!
Guides, changelogs, deep dives and everything trade journaling.
Another huge addition for traders of TradesViz! You can now easily add and/or build import dividends and track them seamlessly on TradesViz journaling itself!
A new overview after a long time! Explore to learn about the design decisions!
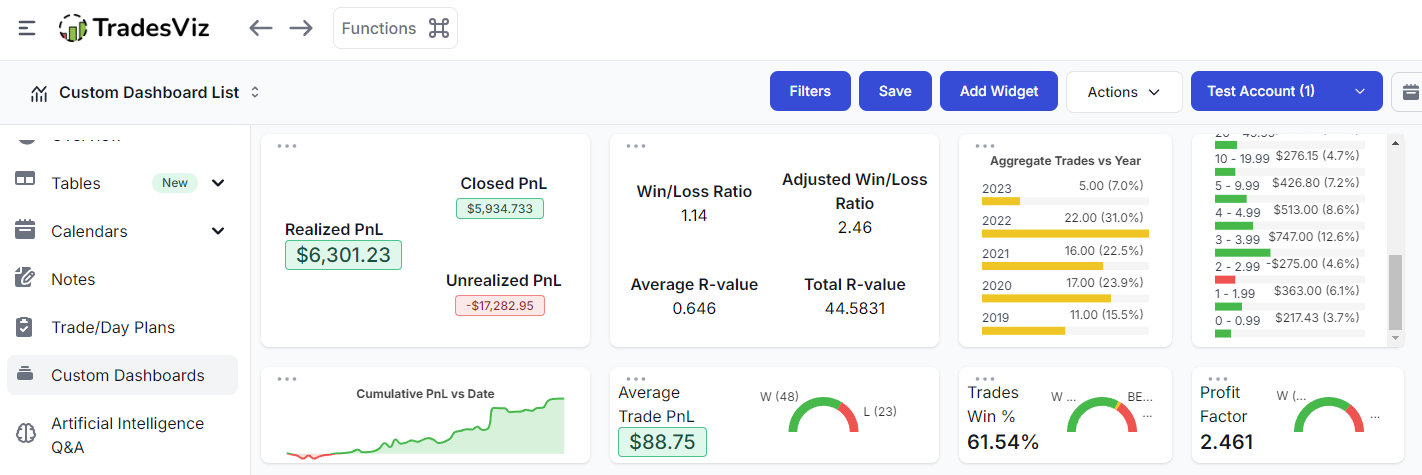
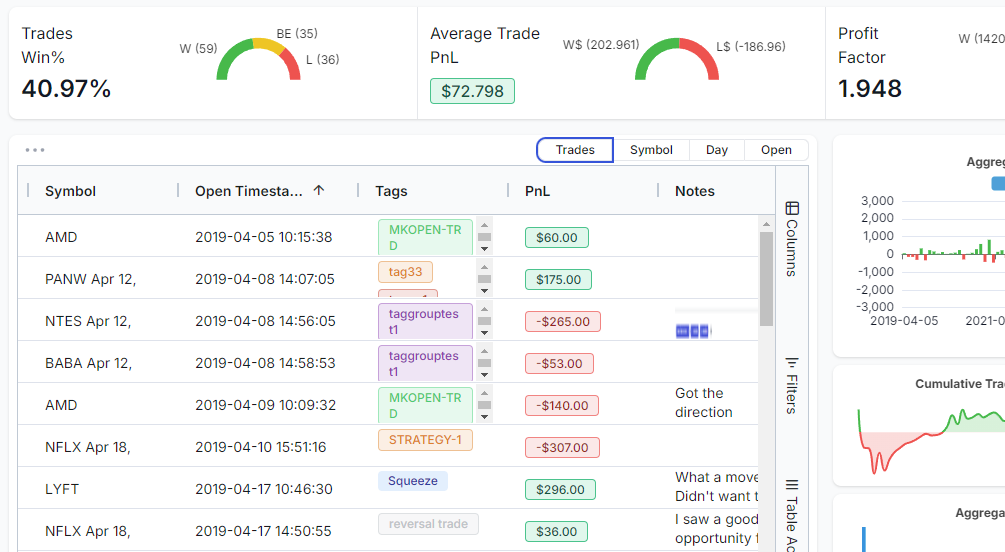
One of the most used features of TradesViz - the 100% custom dashboard gets 10+ new widgets and variants for ALL bar and line charts! With this, you can create compact dashboards that show you exactly the metrics you want visualized the way you want!
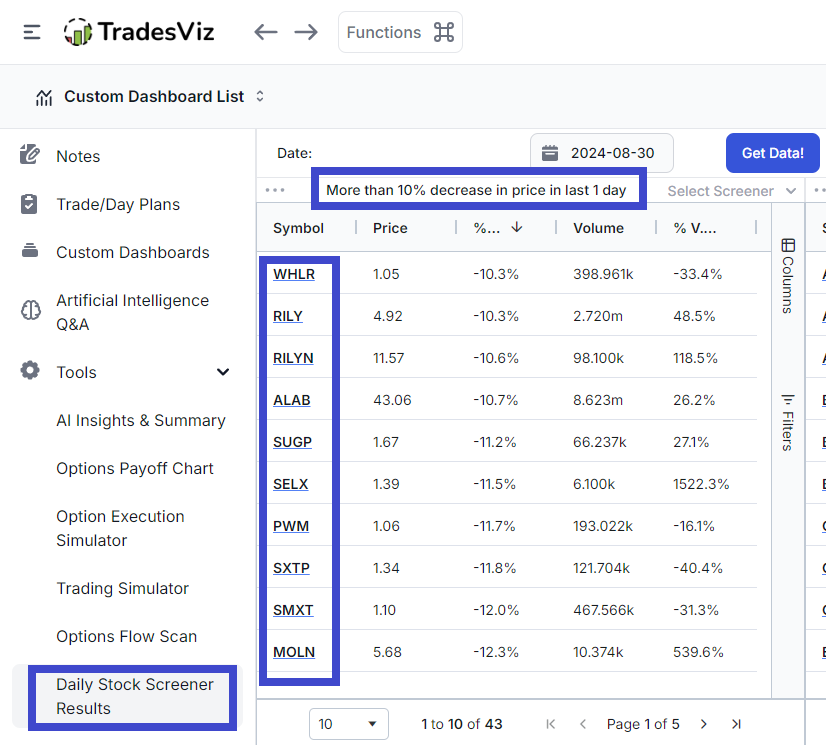
An appropriate feature for an all-in-one trading journal: A built-in screener results for the US, IN, CA & AU every day from 30 unique screeners powered by our very own EZstockscreener! You can now look for ideas, prepare, and journal all in the same dashboard!
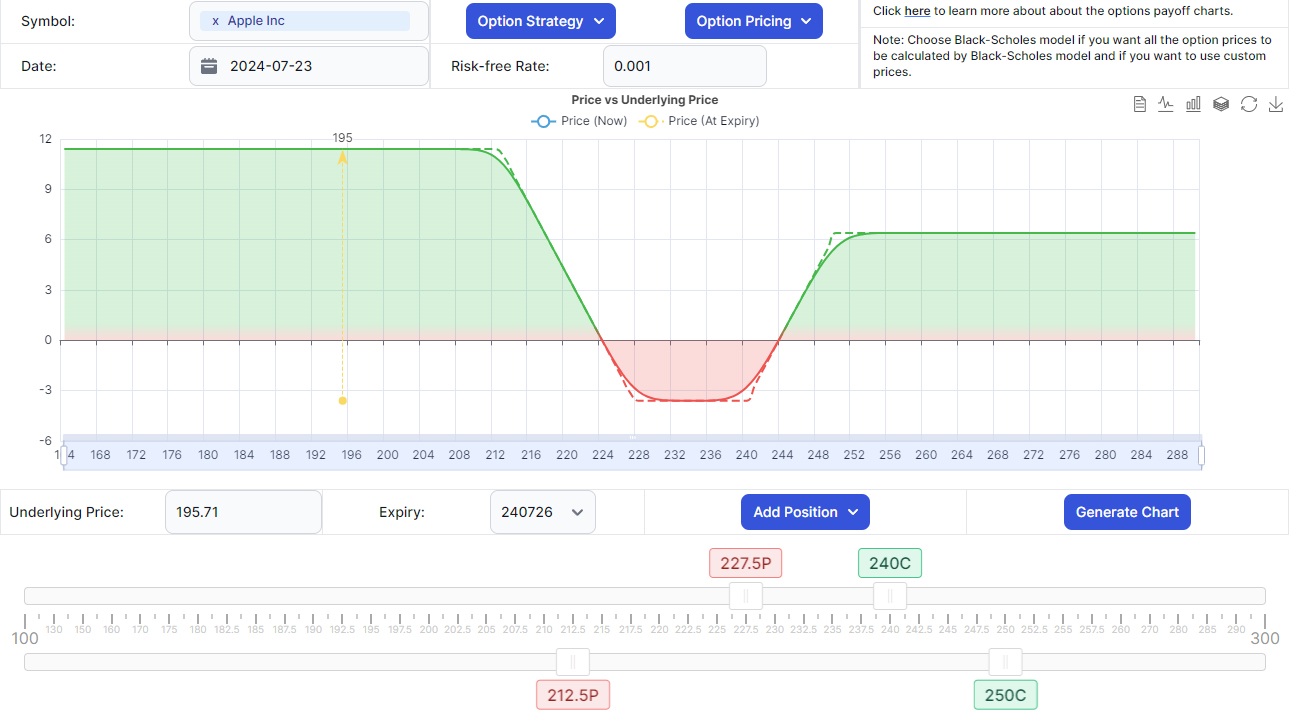
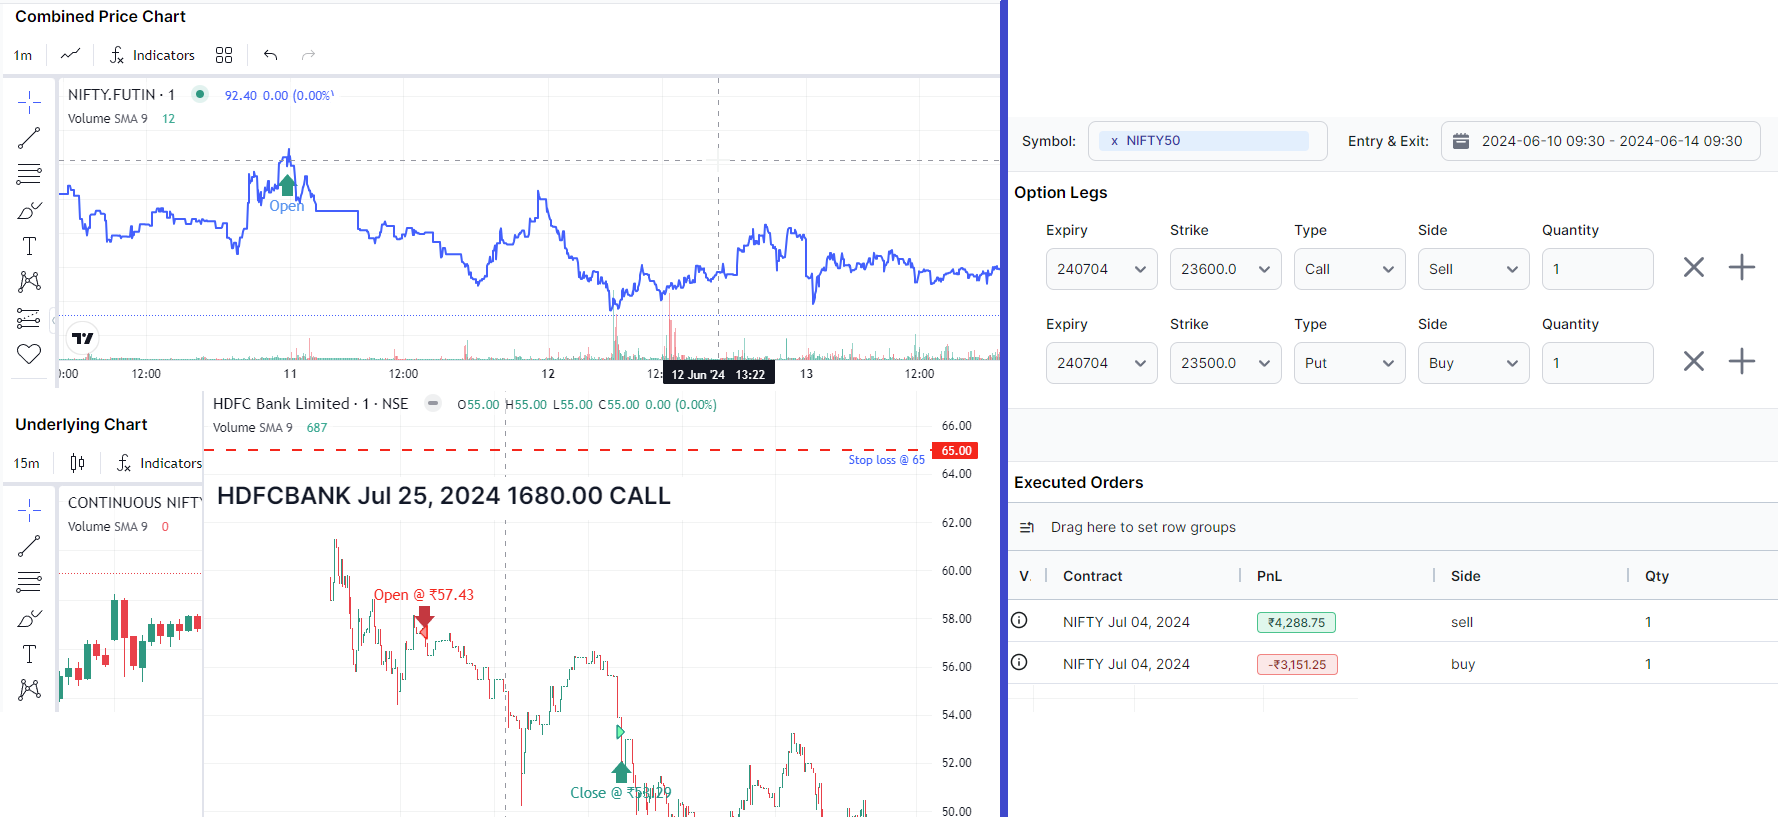
For the first time ever, a full-fledged options payoff chart with pricing support for US & IN options is available in a trading journal. Add any leg and simulate pricing based on the Black-Scholes model.
![[Updated] New feature: Chart Trades View in TradesViz v2.0](/media/blog/chart_trades/chart_trades.png)
View all your trades for a symbol in one single chart - just like in your trading platform! Learn how to set the chart to your liking, add indicators, and more! Update Aug 2024: Now with the ability to save your drawings!
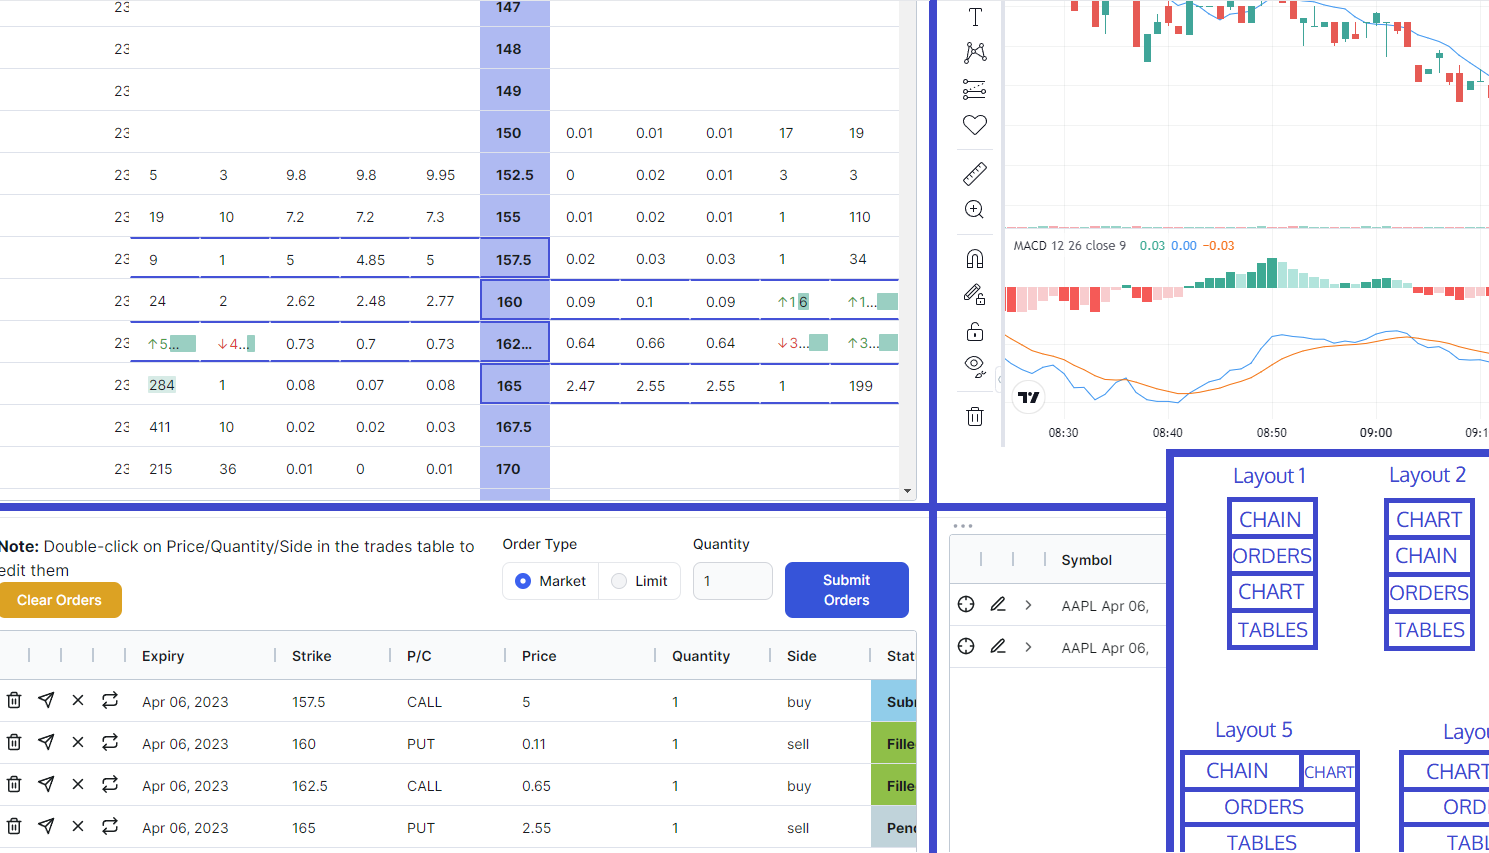
As the need for ways to practice options rises, we're stepping up the simulation usability for our one-of-a-kind options simulator with 8 unique chart/table/chain layouts!
![[Updated] Everything you need to know about tags, managing and organizing tags in TradesViz trading journal v2.0](/media/blog/tags_complete_guide/tags_complete_guide.png)
The complete guide to tags in TradesViz trading journal. You will learn how to manage tags, organize them and analyze with tags in your trading journal with this guide. Now updated with TradesViz v2.0 features and a summary of more features that use tags!
For the first time ever, you can view in-depth options data/OHLC bars for every NSE (India) F&O option execution you do on TradesViz. Every single F&O symbol's data can now be viewed on TradesViz!
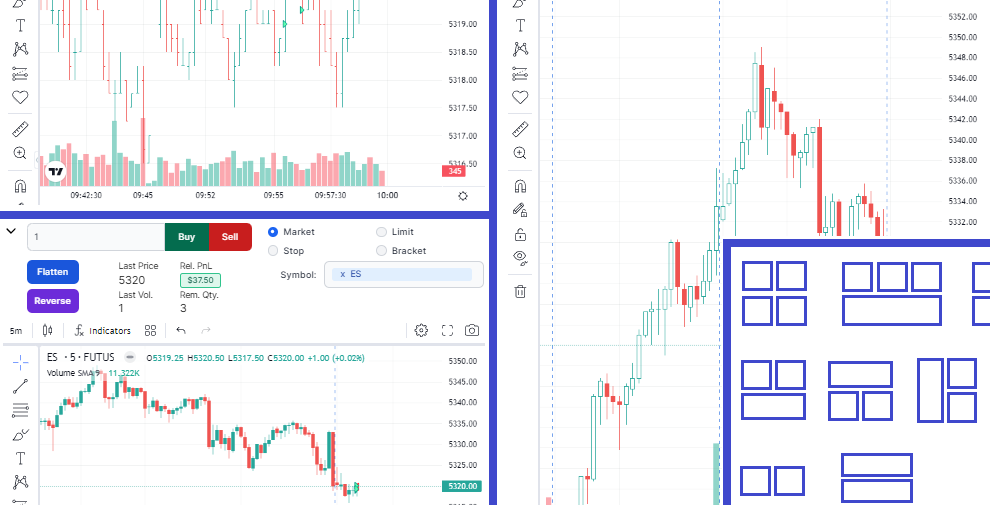
The simulators on TradesViz are crafted to be as close to the real trading platforms most traders use. With this update, we're introducing not 2 to 3, but 13 different chart layouts for the multi-trading simulator!
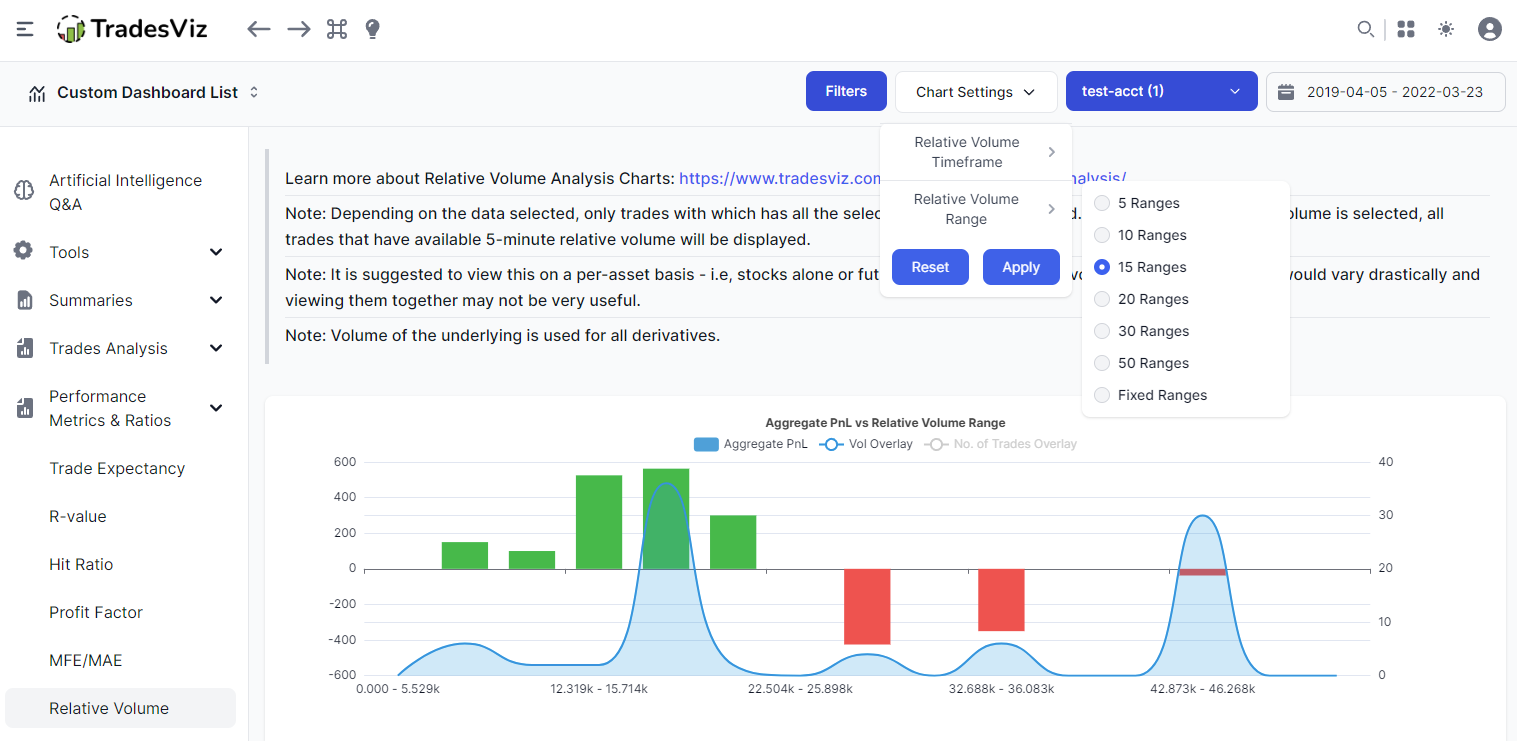
Do you trade well when there's a certain amount of volume/volatility? Time, date, time, etc., are not the only way to analyze. Learn more about how you can use the relative volume to optimize your trading.
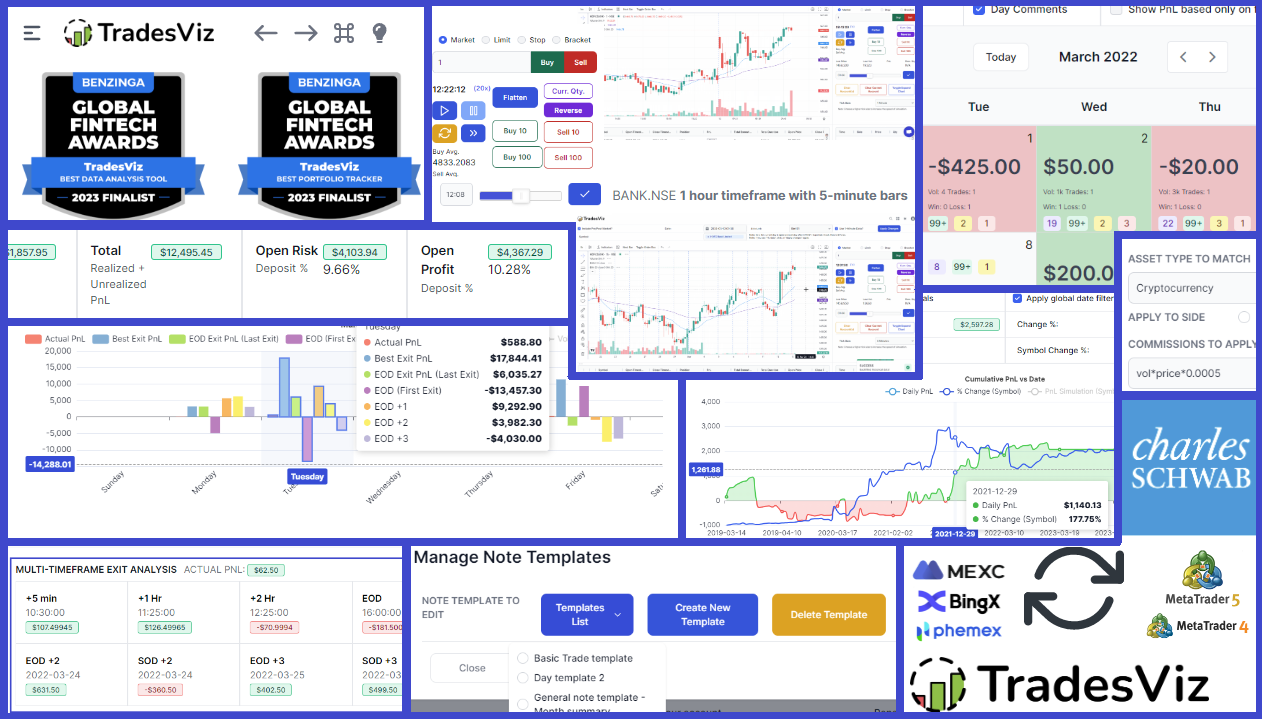
TradesViz's biggest changelog to date! If you want to catch up on the biggest updates and improvements in the trading journaling and analytics world, this is it. Simulators, AI, v2.0 dashboard, Multi-timeframe exit, SO MUCH new features, and PLENTY of under-the-hood improvements!