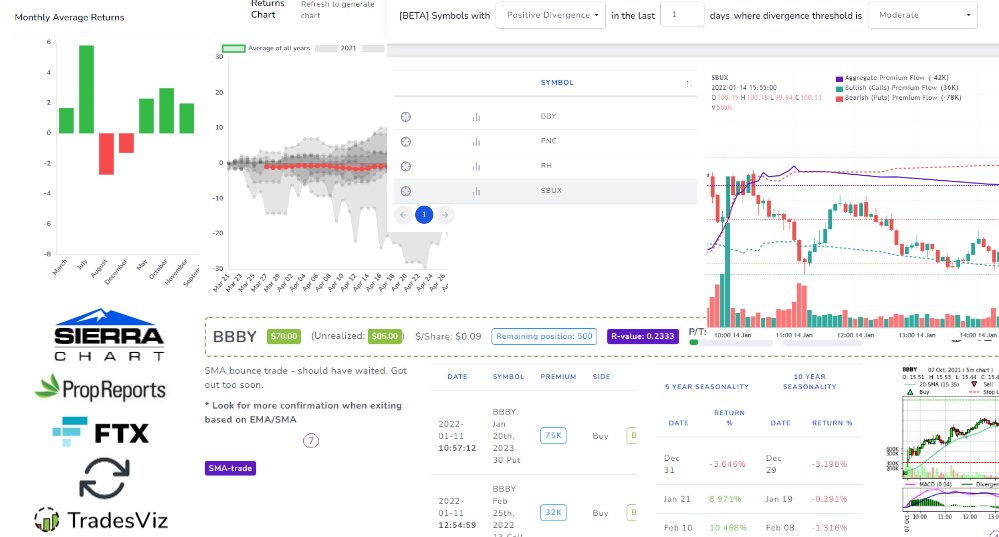
March 2022 to May 2022 Updates: Seasonality, Public dashboard, Auto-notes sync and more!
More analysis-based updates to TradesViz. Seasonality analysis, unified view, options scanner, new auto-import platform, and more!
Share your trading performance: Public Dashboard!
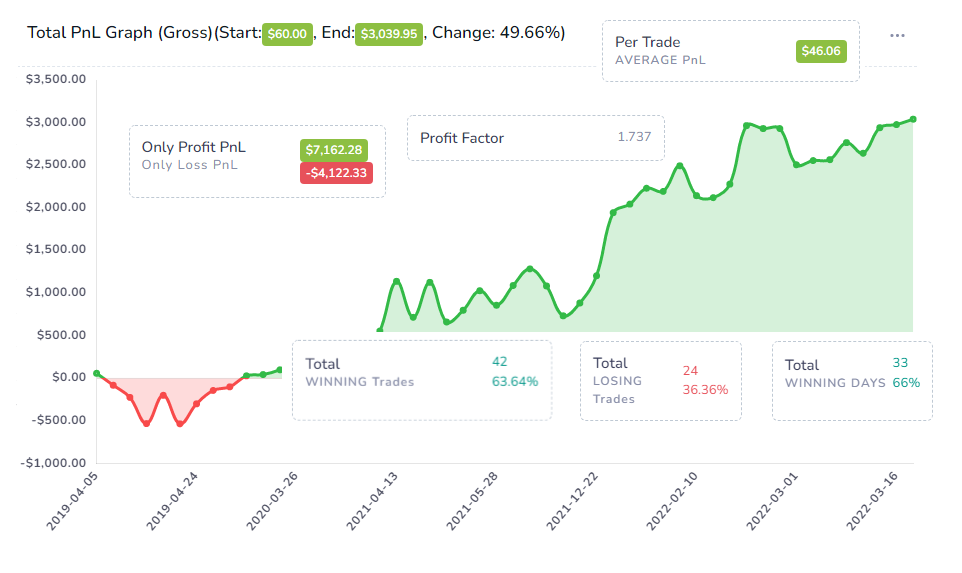
You can now share the entire trading performance of your trading account(s) via a simple public dashboard - choose exactly what data you want to share. It's your data - you have complete control over what you want to share with your fellow traders!
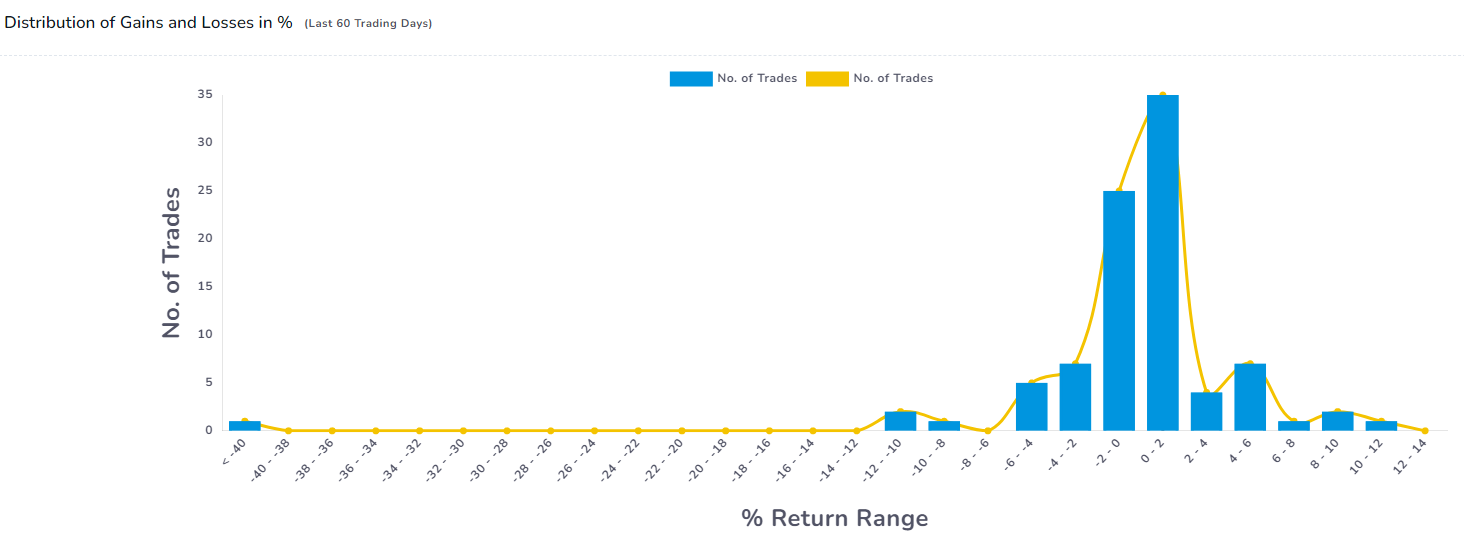
New charts: Distribution curves
We have a few sets of charts that can help provide more value to your analysis and pinpoint the set of trades that you need to improve - Distribution curves and also DRMA curve.
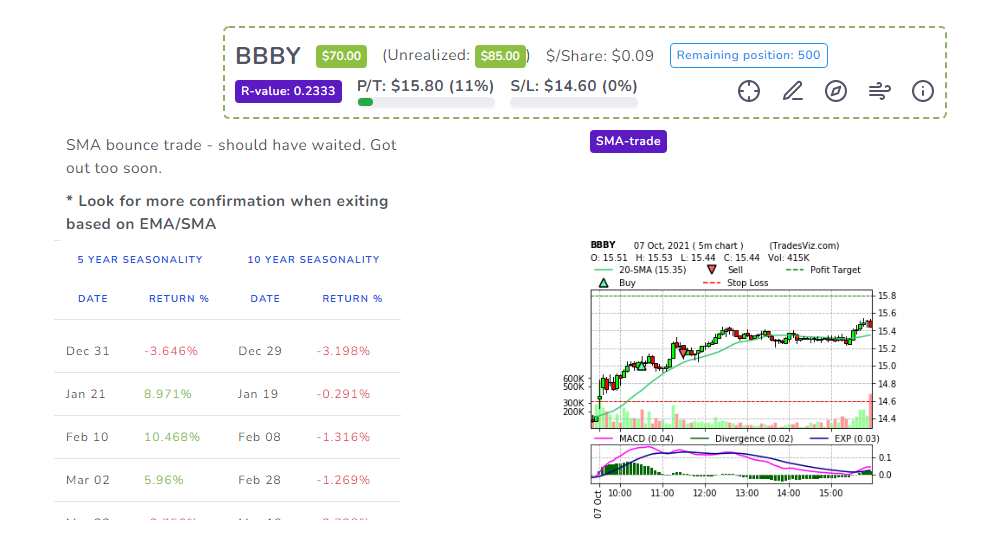
Ultimate context combination: The Unified View
PnL, Unrealized PnL, Risk info, Comments/Tags, Recent options flow, Upcoming seasonality prediction, and more... View all of this in a single tab for all your trades. Use every piece of market info to hone your trading edge and make trading simpler.
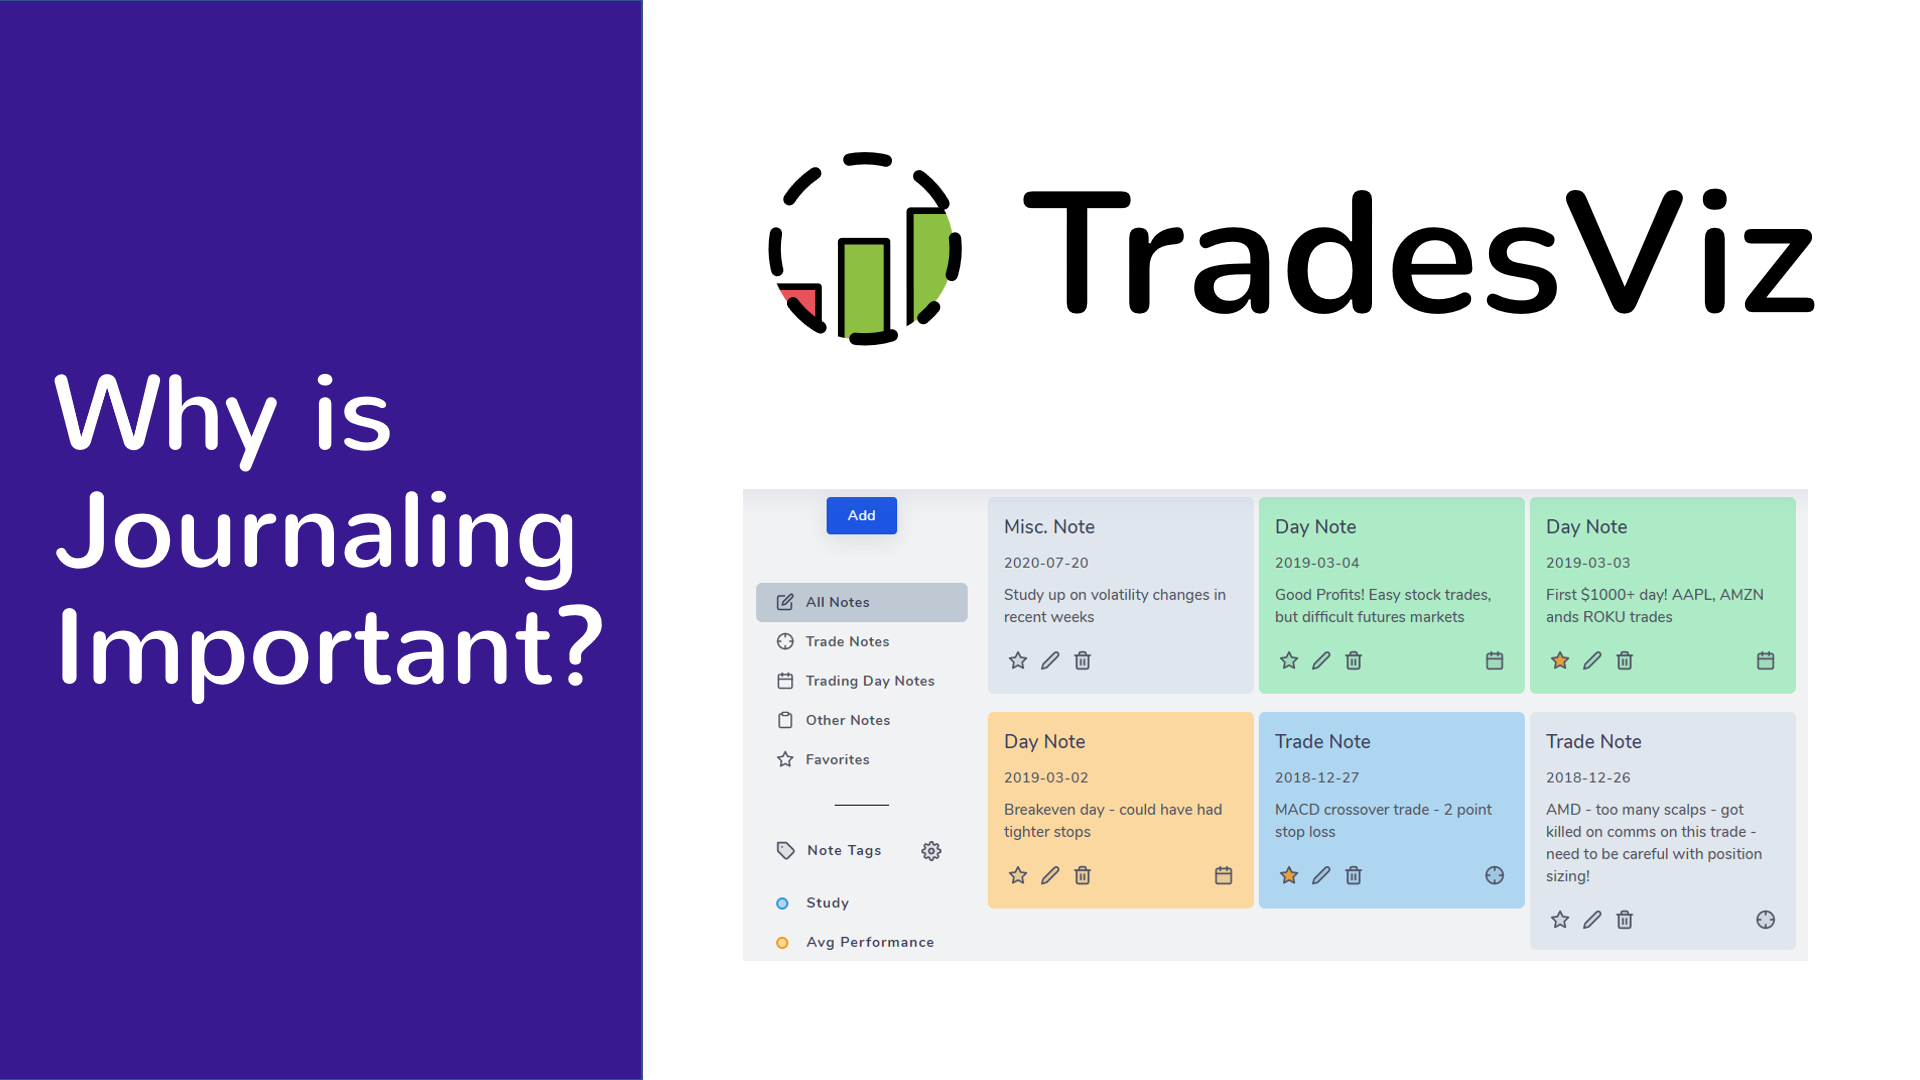
Why is journaling important?
Why even journal your trades? Why should you analyze your trades? How does it help you? All your journaling questions are answered here!
