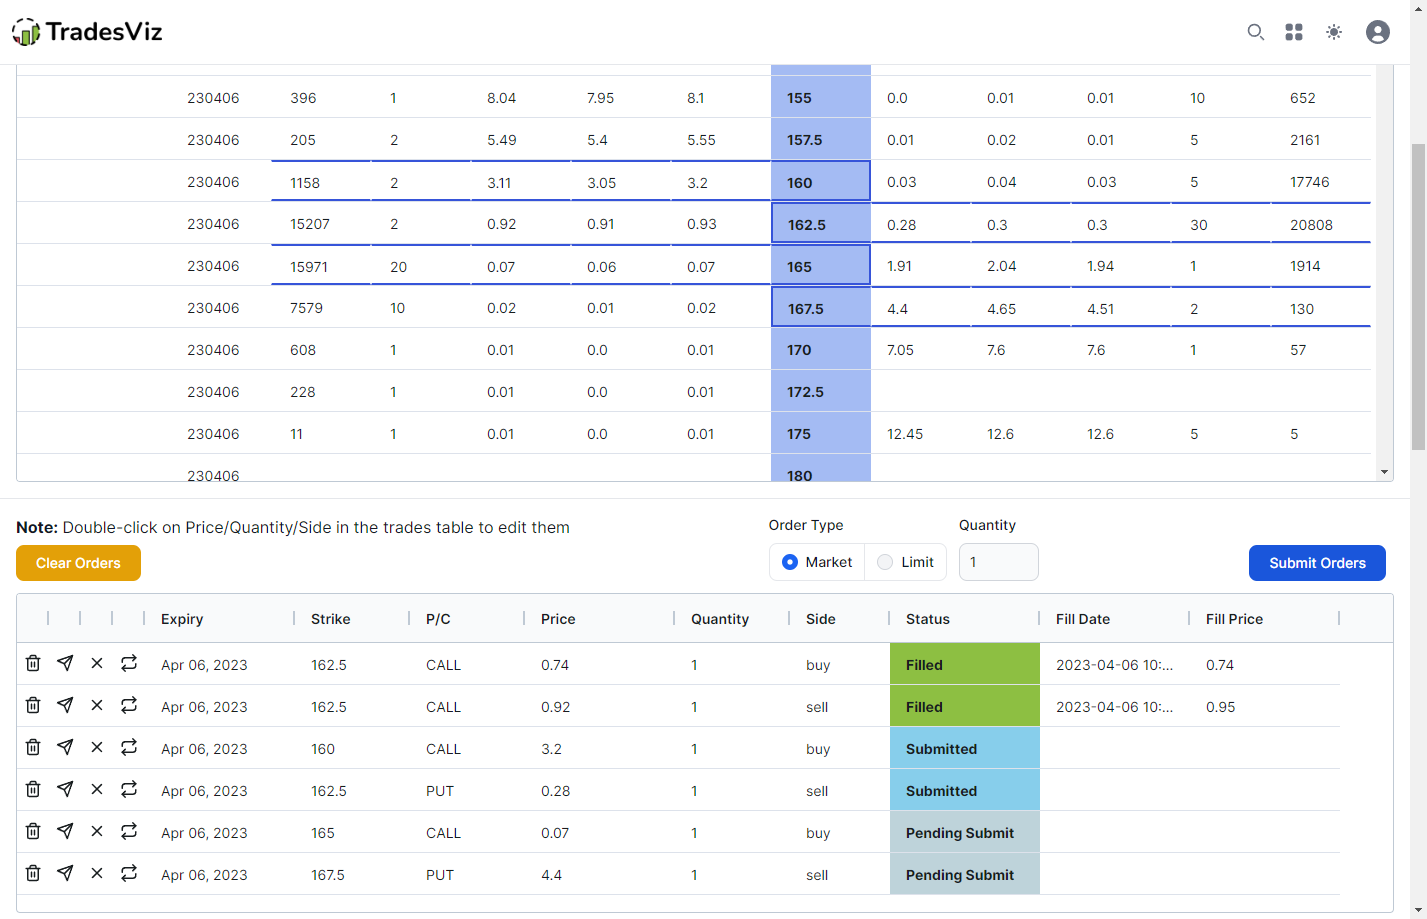
Full-fledged Options Chain Simulator in TradesViz
A full options simulator with the capability to execute and simulate any options spread/strategy! For the first time in the trade journaling world, TradesViz now has the complete simulation package: stock, forex, futures, AND options. Looking to practice your options trading? There's no better tool than the TradesViz options simulator!
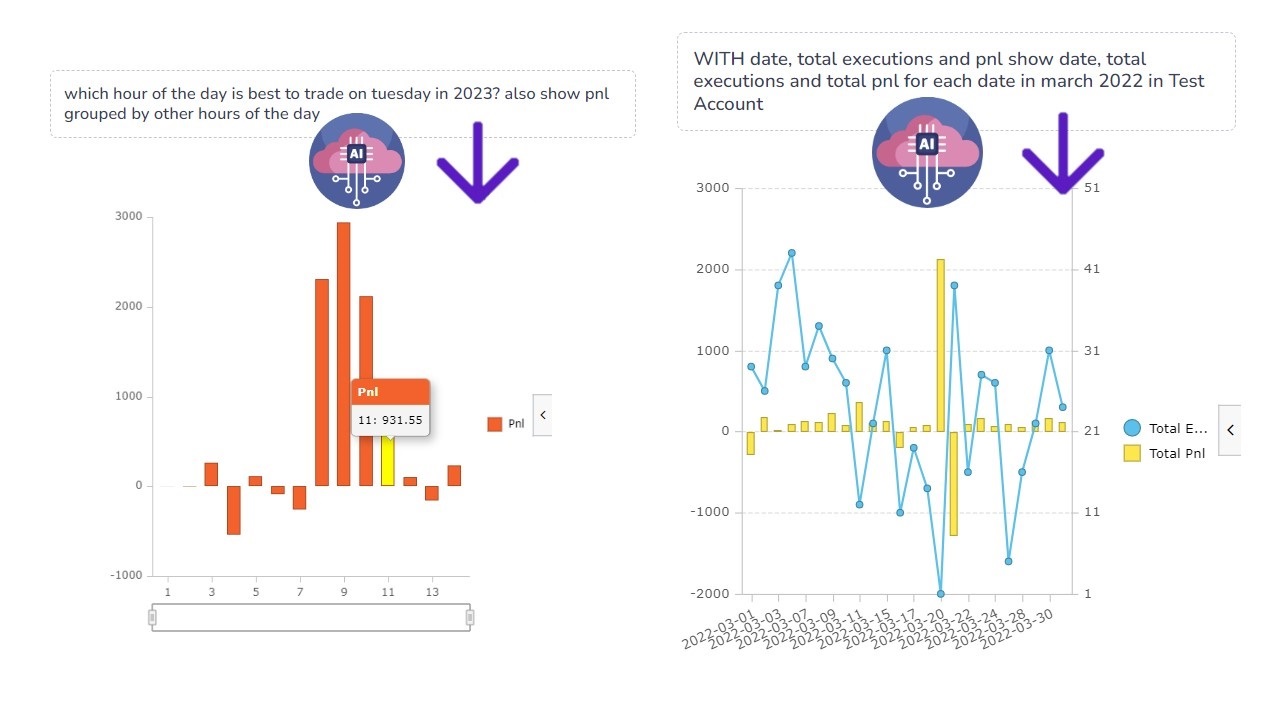
Artificial Intelligence Question & Answer Analysis: Ask and Visualize Anything on TradesViz Trading Journal
The next generation of trading analysis is here: Ask TradesViz anything and get results, charts, and more. Powered by AI, this is currently the most powerful way to analyze and quickly get answers and insights from your trading accounts.
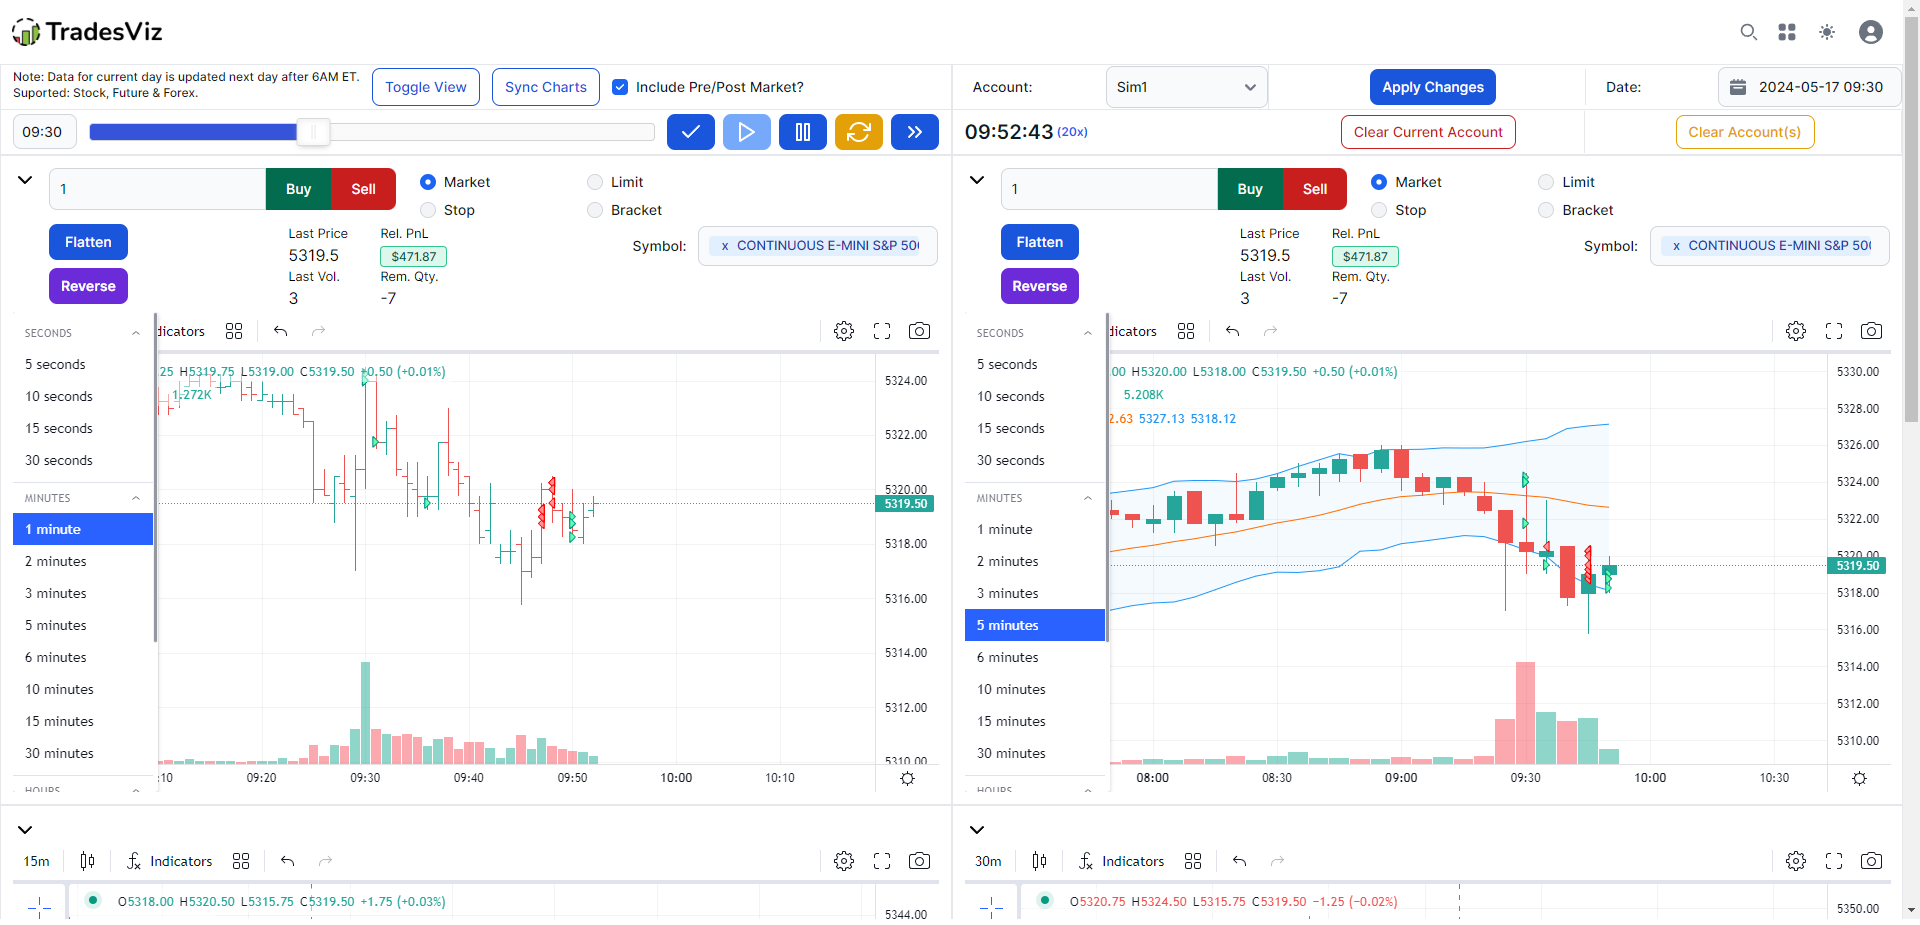
Multi chart trading simulator: Trade any symbols in multiple timeframes in a single screen
A first in ANY trading journal/simulation platform online: multi-chart, multi-timeframe trading simulator dashboard. Trade multiple symbols on multiple timeframes - all synced in the same page!
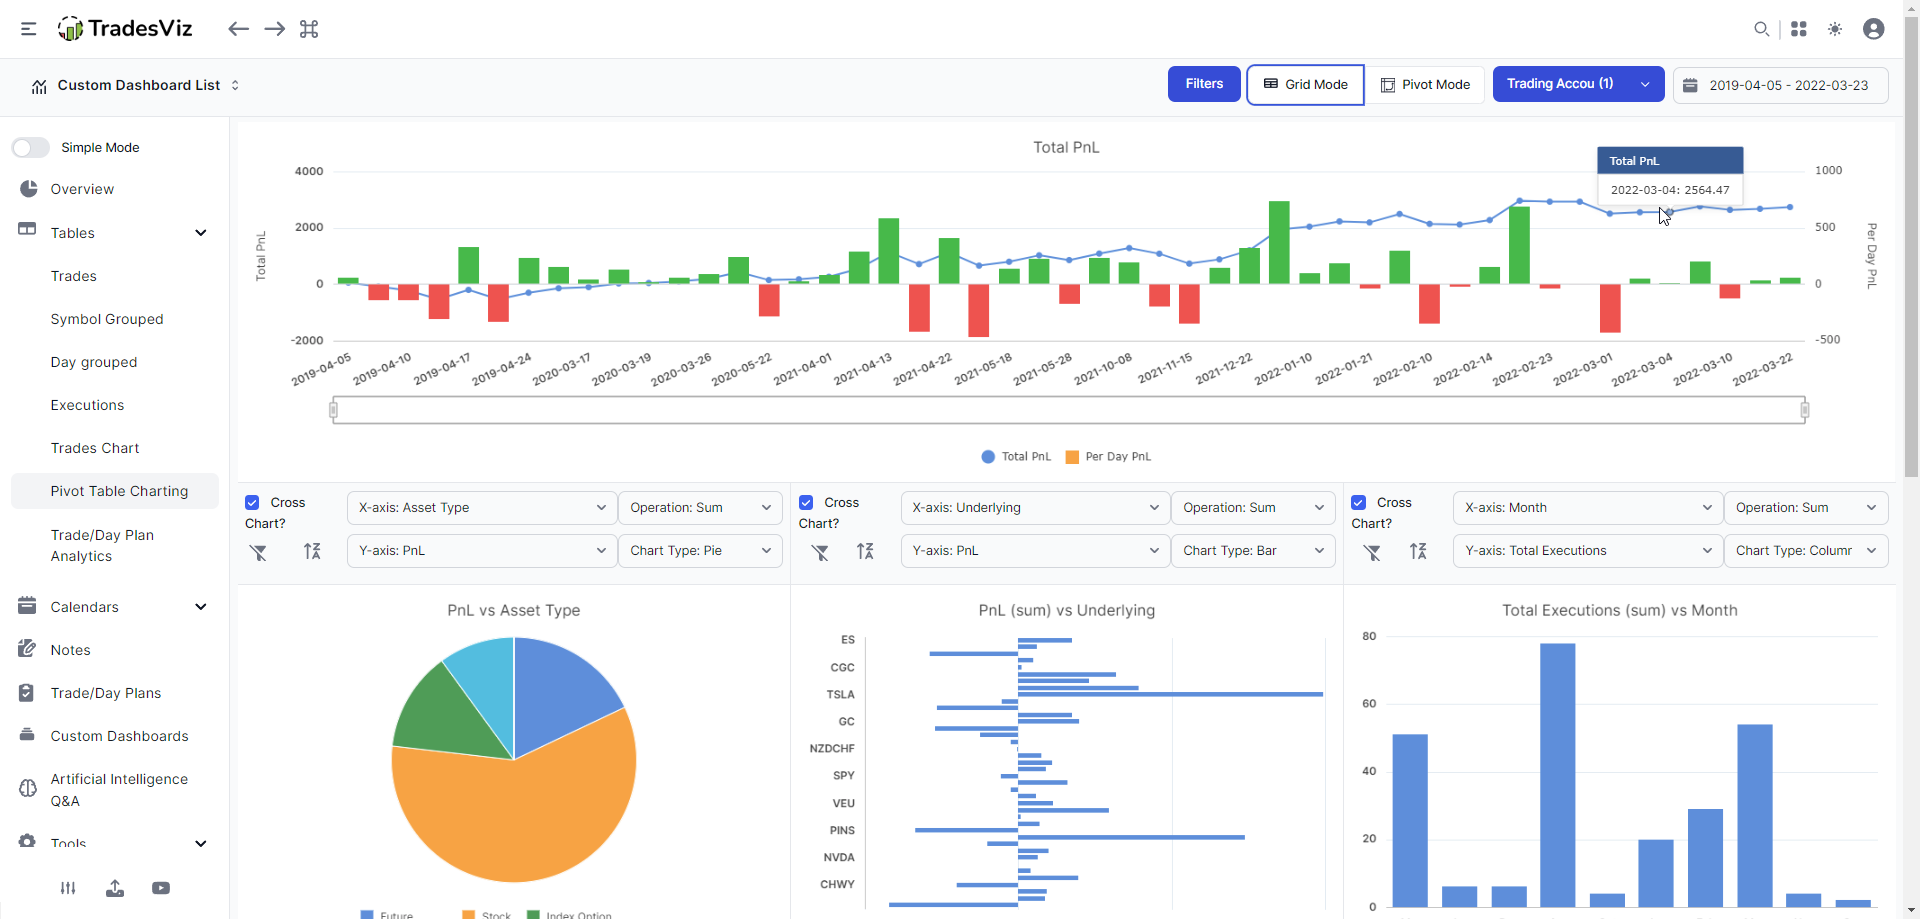
Pivot Grid + Charting: Visualize and analyze ANY statistic and metric on TradesViz
The next big thing on TradesViz journal: An all-in-one grid + pivot table where any column or data can be visualized and explored intuitively. Potential combinations of metrics: 600+ This is by far the most powerful singular trading performance analytics feature available online. Try it out!
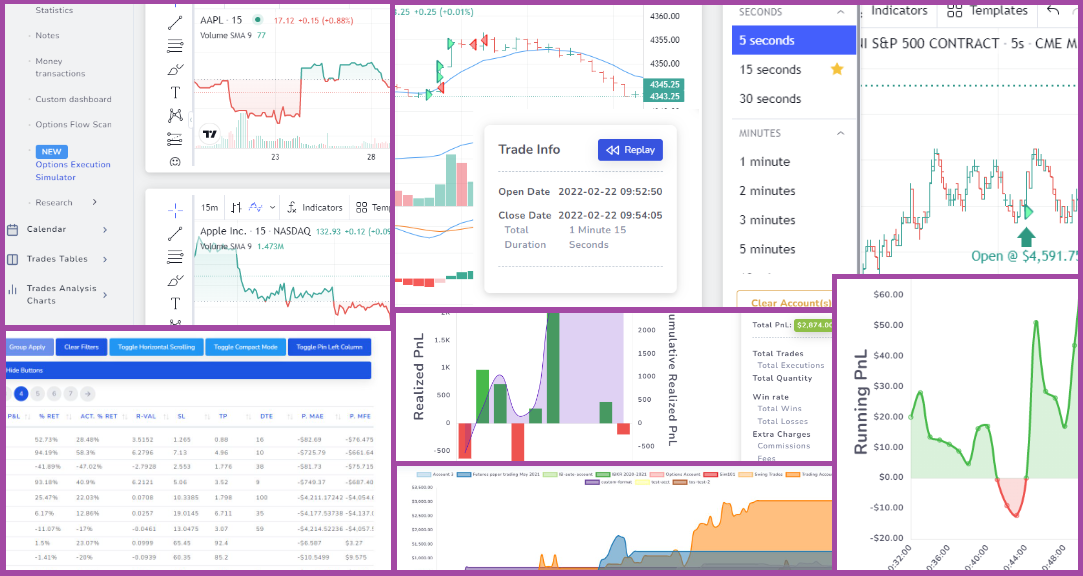
Sep 2022 to Jan 2023 Updates: Simulator, Options spread PnL, EOD Exit + more features!
A LONG list of new features to TradesViz - a lot of it, being the first time ever on any online trading journal. This is a must-read change log - showing how much we are committed to improving TradesViz every single day!