New feature: Dividend tracking and analysis
Another huge addition for traders of TradesViz! You can now easily add and/or build import dividends and track them seamlessly on TradesViz journaling itself!
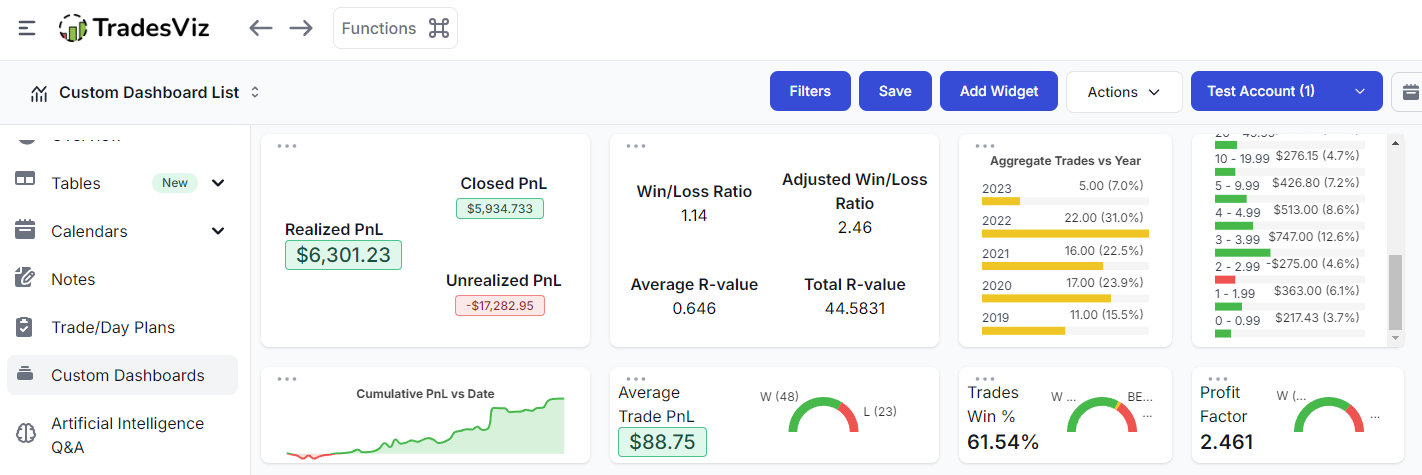
New custom dashboard widgets: Pie charts, combined statistics and compact charts!
One of the most used features of TradesViz - the 100% custom dashboard gets 10+ new widgets and variants for ALL bar and line charts! With this, you can create compact dashboards that show you exactly the metrics you want visualized the way you want!
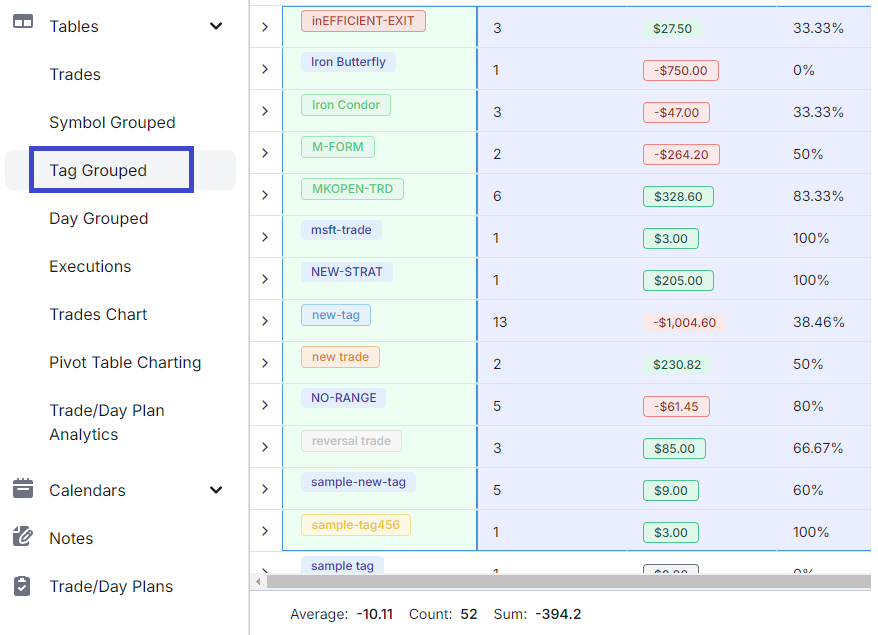
New tab: Tag grouped table
The 5th main table in TradesViz: Tags table! You can now quickly view summaries based on tags and generate charts/export data and more with the tags table.
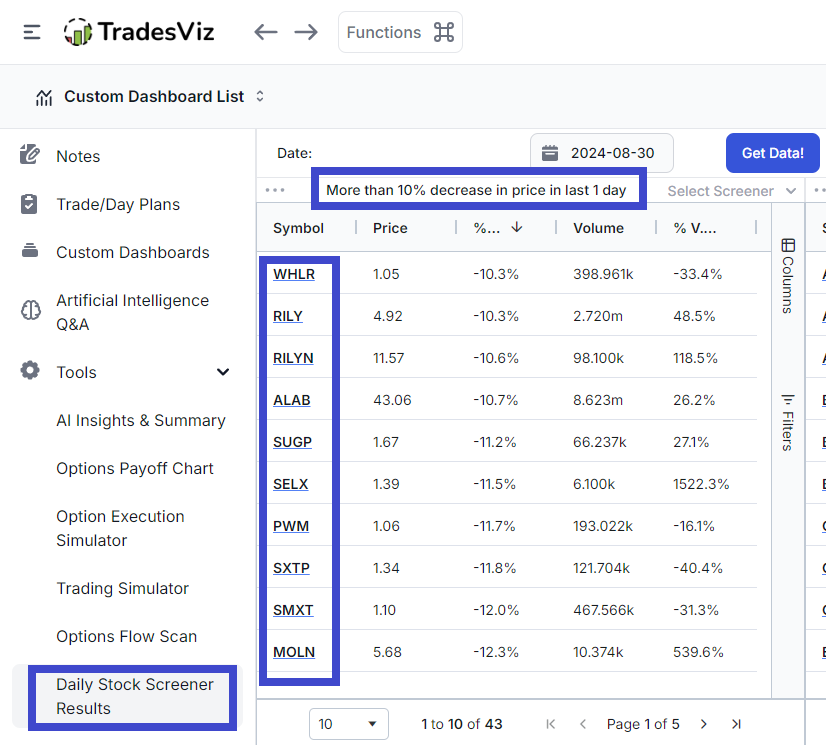
New feature: Daily screener results in your TradesViz dashboard (30+ screeners)
An appropriate feature for an all-in-one trading journal: A built-in screener results for the US, IN, CA & AU every day from 30 unique screeners powered by our very own EZstockscreener! You can now look for ideas, prepare, and journal all in the same dashboard!
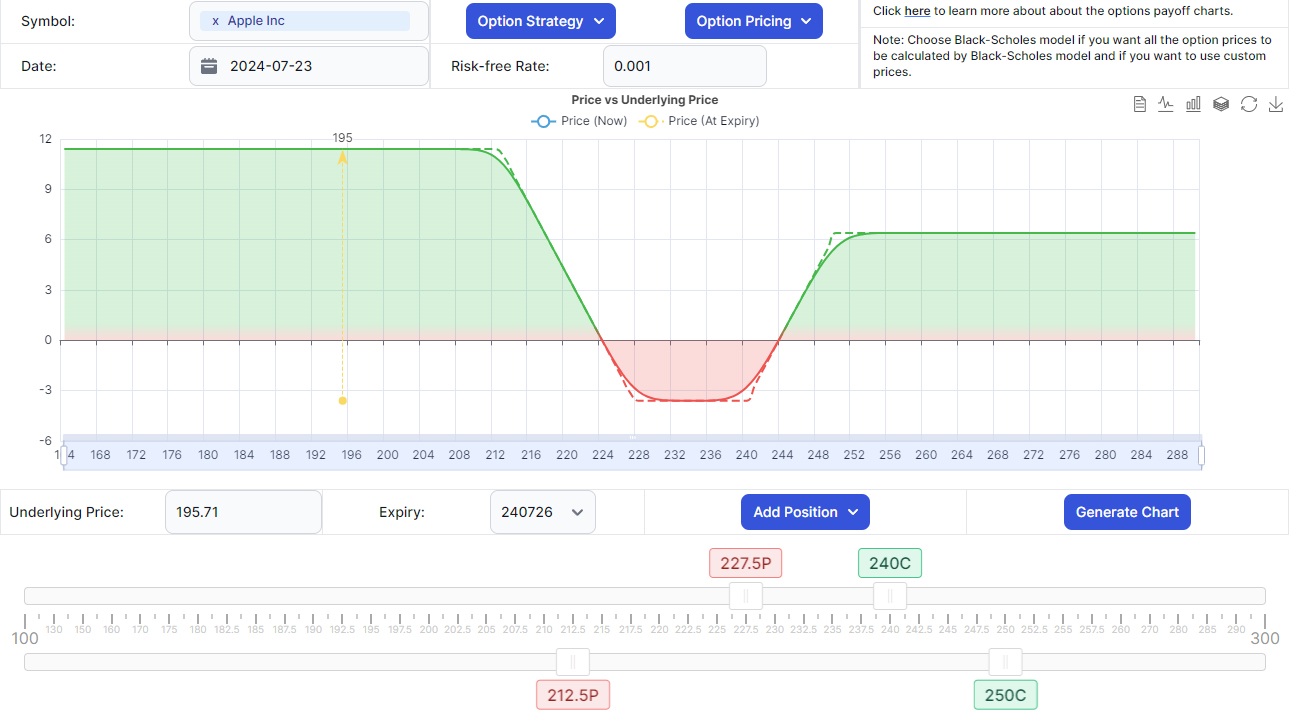
New feature: Options payoff/risk chart and simulation
For the first time ever, a full-fledged options payoff chart with pricing support for US & IN options is available in a trading journal. Add any leg and simulate pricing based on the Black-Scholes model.