Unusual Options Activity
Unusual options activity is activity that stands out relative to a symbol's own recent history. A large premium alone does not make a session unusual or reveal the trader's intent.
More Details
What is unusual options activity?
Unusual options activity means a symbol traded out of character relative to its own recent history. It is a comparison with a baseline, rather than a universal premium threshold. A heavily traded index can print a huge dollar amount on a quiet day.
Explore the product: Options Flow Features | How to Read Options Flow
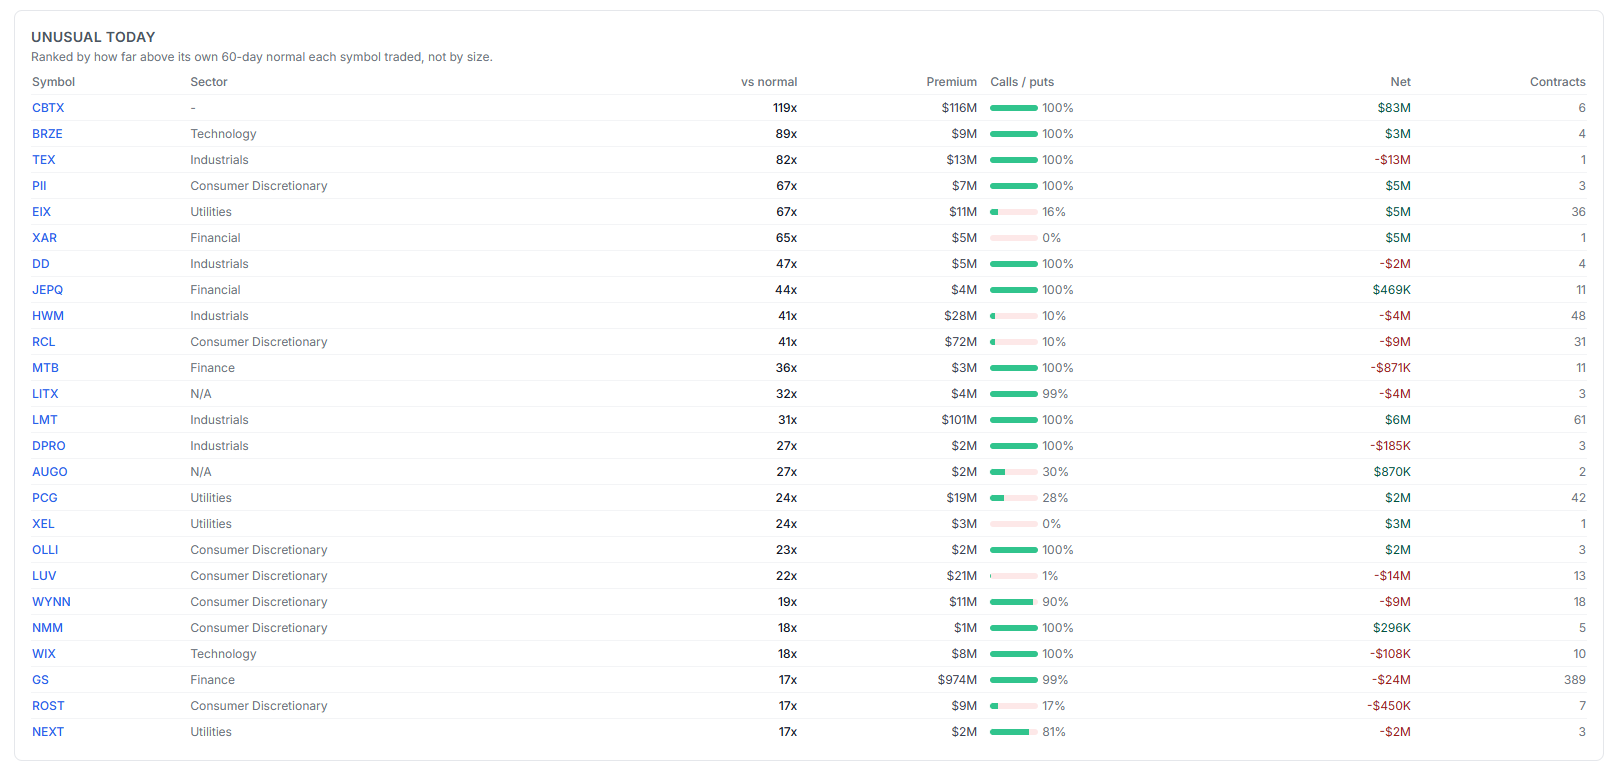
Unusual Today versus Largest Books
The TradesViz Market tab separates two questions:
- Unusual Today: how far above its own 60-day normal did each symbol trade?
- Largest Books: which symbols had the most raw premium?
In the guide's historical example, CBTX recorded $116M at 119× its normal across six contracts. GS recorded $974M at 17× normal across 389 contracts, with a signed net of -$24M. Raw size, relative activity and concentration describe different aspects of those sessions.
How to investigate an unusual symbol
- Read the session's market breadth and execution mix.
- Compare the symbol's gross and net premium with its baseline.
- Group multi-leg orders and open the underlying contracts.
- Use strike/expiry maps to understand the distribution.
- Check signal history, underlying price and available open-interest evidence.
Find patterns across sessions with Footprint
Footprint groups names by observed behavior: rotation toward nearer or later expiries, concentration, rolls, and volume with or without open-interest support. Contract ladders show the sessions in which each contract appeared. A lumpy tag helps distinguish concentrated events from persistent activity.
Open-interest verdicts are available only at supported nightly-analysis window lengths. An empty preset at another window is not evidence that no such behavior occurred.
What about the Options Flow Screener?
The separate screener is being rebuilt and is not presented as part of the current guide. Market and Footprint provide the discovery workflow covered here. Record your reasoning in a trade plan and use tags to review any resulting trades.
Where to find it in TradesViz
Example
CBTX: $116M gross, 119× its normal, six contracts. GS: $974M gross, 17× its normal, 389 contracts. Historical examples from the guide, not current trade ideas.