Flow Divergence
Flow divergence is a mismatch between options flow measures and the underlying price over a comparable period. It is a research observation that needs contract and order context, rather than proof of a reversal.
More Details
What is options flow divergence?
Flow divergence describes a mismatch between a selected flow measure and the underlying price over a comparable period. Premium may rise while price stays flat, or net flow may lean one way while price moves another.
The observation does not identify who traded, establish their purpose, or predict a reversal.
Explore the product: Options Flow Features | How to Read Options Flow
Read premium against price
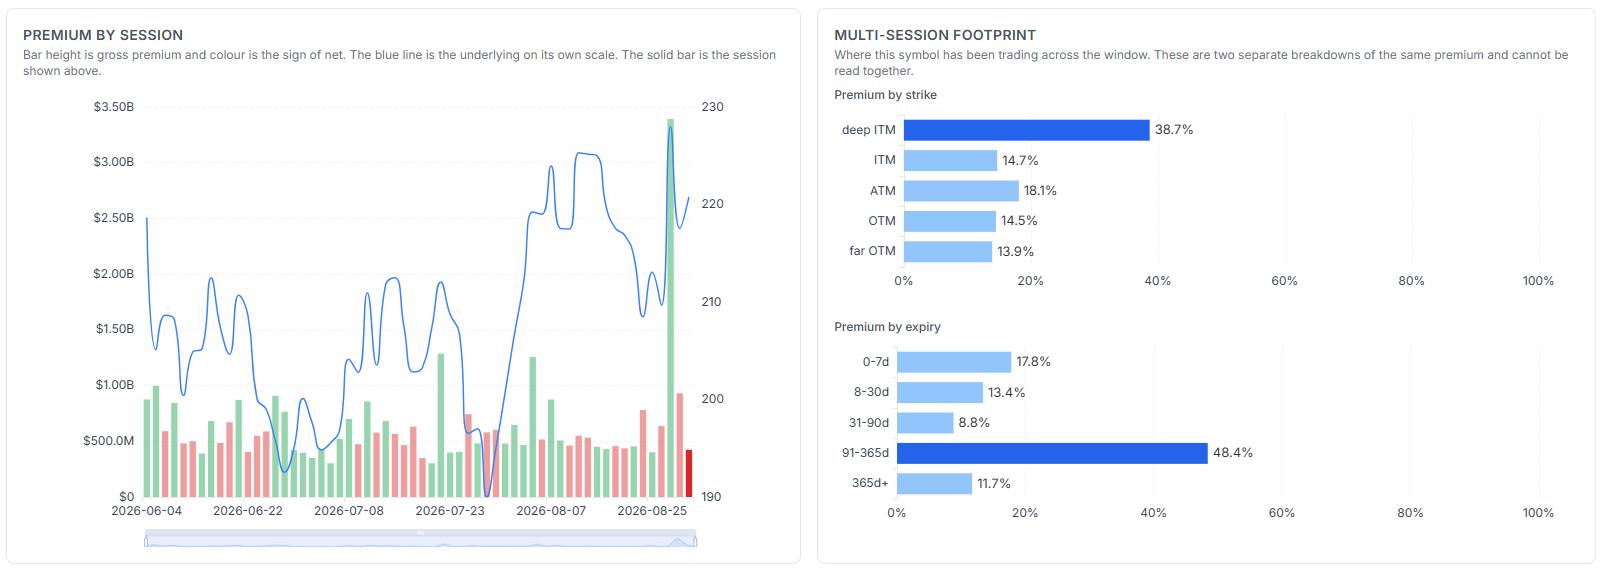
In Symbol Summary, the premium-by-session chart displays gross premium as bar height, net premium sign as color and the underlying price on its own scale. Compare the same sessions and read those scales separately.
Investigate the contracts behind the mismatch
- Check gross versus net. A large gross figure with a small net amount can reflect heavily offsetting activity.
- Group the legs. A spread or roll can make a single contract look directional when its package is more complex.
- Map strikes and expiries. Contract maps and tables show which series contributed the premium.
- Check open interest and price. Later evidence may support or weaken your hypothesis; the original print alone cannot settle it.
Turn an observation into a reviewable hypothesis
Write down the interpretation, timeframe and invalidation condition in a trade plan. Tag any resulting trades and review the outcomes in your journal. Signal history also carries confirmation caveats to keep a detected pattern distinct from a confirmed price move.
The separate Options Flow Screener is being rebuilt. The current guide demonstrates this research through Symbol Summary, Market and Footprint.
Where to find it in TradesViz
Example
Premium rises over several sessions while the underlying remains flat. Check whether the activity came from offsetting legs, a roll or concentrated contracts before forming a directional hypothesis.