Cumulative Flow
Cumulative flow tracks a running sum of options premium during a selected period. It shows when turnover arrived; it does not prove a position was accumulated or remains open.
Formula
More Details
What is cumulative options flow?
Cumulative flow sums selected options premium through time. Depending on the chart and selected series, you can inspect total premium, buy/sell components or classified bullish/bearish flow. Check the series label before interpreting its direction.
Explore the product: Options Flow Features | How to Read Options Flow
Turnover is not a position
A participant can open and close the same contracts repeatedly. Each transaction adds turnover even if nothing remains open at the end. A steadily rising cumulative premium line therefore does not prove accumulation.
A next-day increase in open interest is evidence that net new contracts remained open in that series. It does not identify the holder, or prove that a particular print opened a position. One participant can open while another closes without changing total open interest.
Read cumulative premium with price
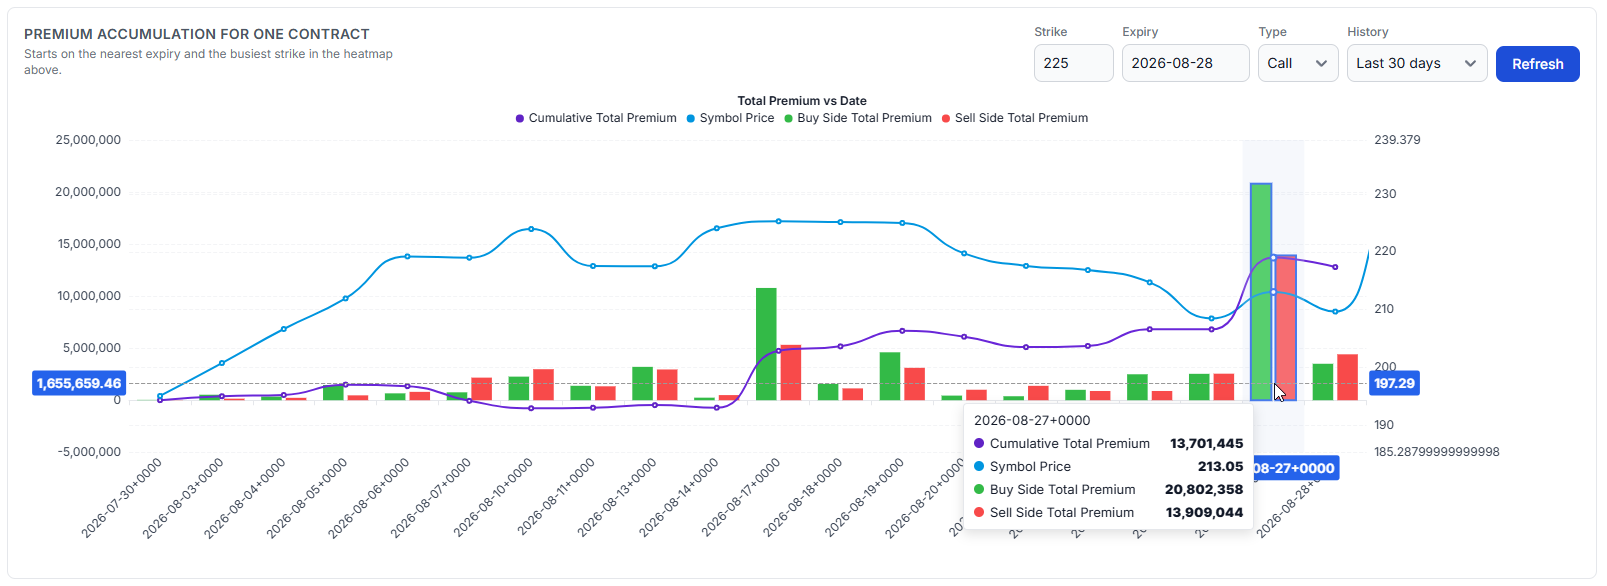
TradesViz shows cumulative premium alongside the underlying price and lets you inspect component series. Use the chart to locate when activity arrived, then examine the contracts and grouped order structure responsible for it.
In the guide's single-contract example, one day recorded $20.8M bought and $13.9M sold. Both sides contributed substantial turnover. A single rising line would hide that distinction.
Add multi-session context
Footprint exposes the contracts carrying a multi-session window and how often each appeared. Its open-interest presets depend on the window lengths processed by nightly analysis. Combine that context with your hypothesis and journal review.
Where to find it in TradesViz
Example
A contract records $20.8M bought and $13.9M sold in one session. Both amounts contribute turnover; neither alone reveals how much exposure remained open.