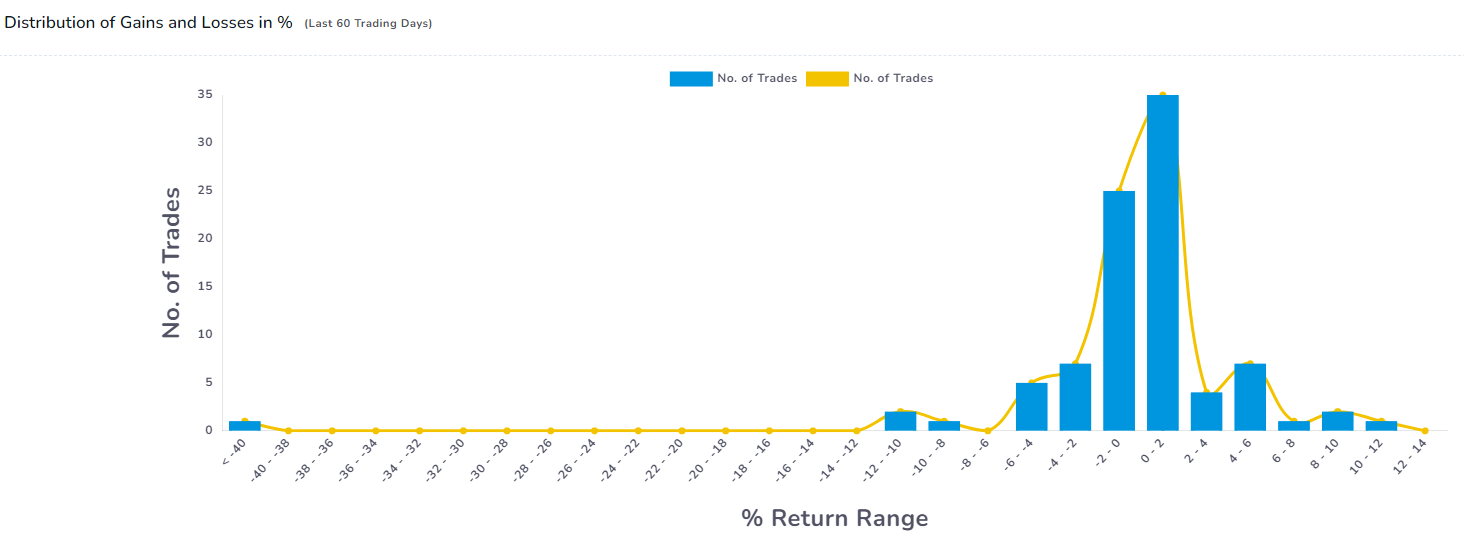
New charts: Distribution curves
We have a few sets of charts that can help provide more value to your analysis and pinpoint the set of trades that you need to improve - Distribution curves and also DRMA curve.
Guides, changelogs, deep dives and everything trade journaling.
We have a few sets of charts that can help provide more value to your analysis and pinpoint the set of trades that you need to improve - Distribution curves and also DRMA curve.
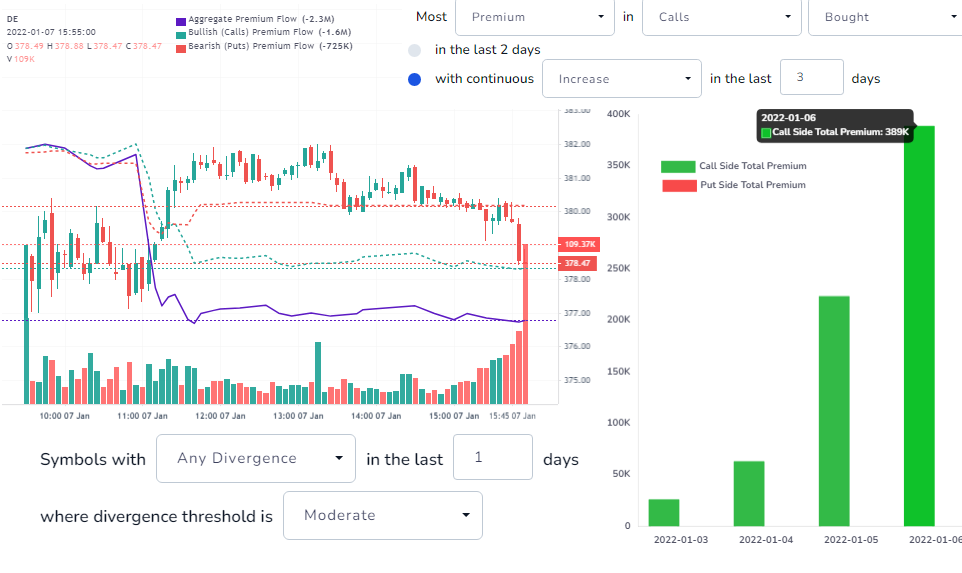
Learn how to use the new options flow scanner to find the stocks with the biggest premium moves in recent history, largest divergences, and more!
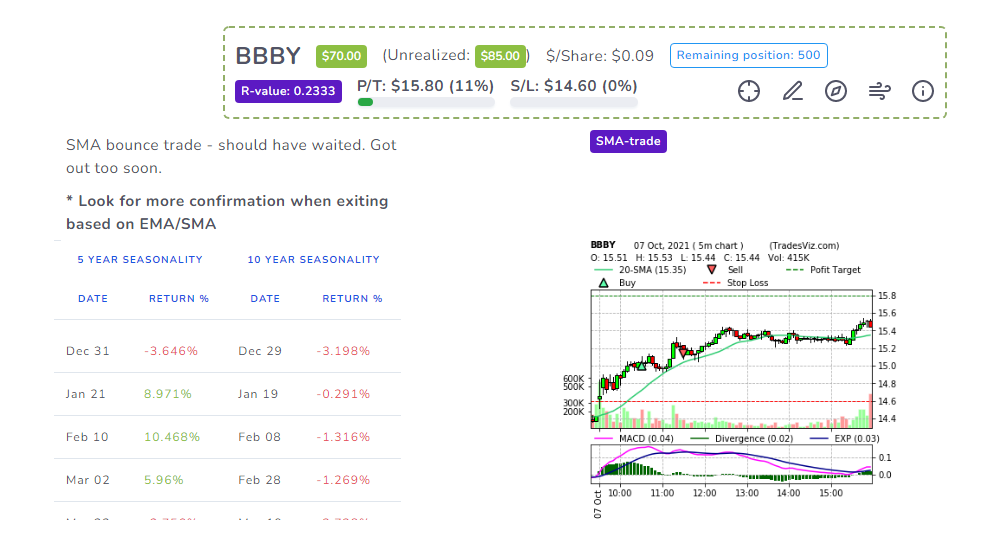
PnL, Unrealized PnL, Risk info, Comments/Tags, Recent options flow, Upcoming seasonality prediction, and more... View all of this in a single tab for all your trades. Use every piece of market info to hone your trading edge and make trading simpler.
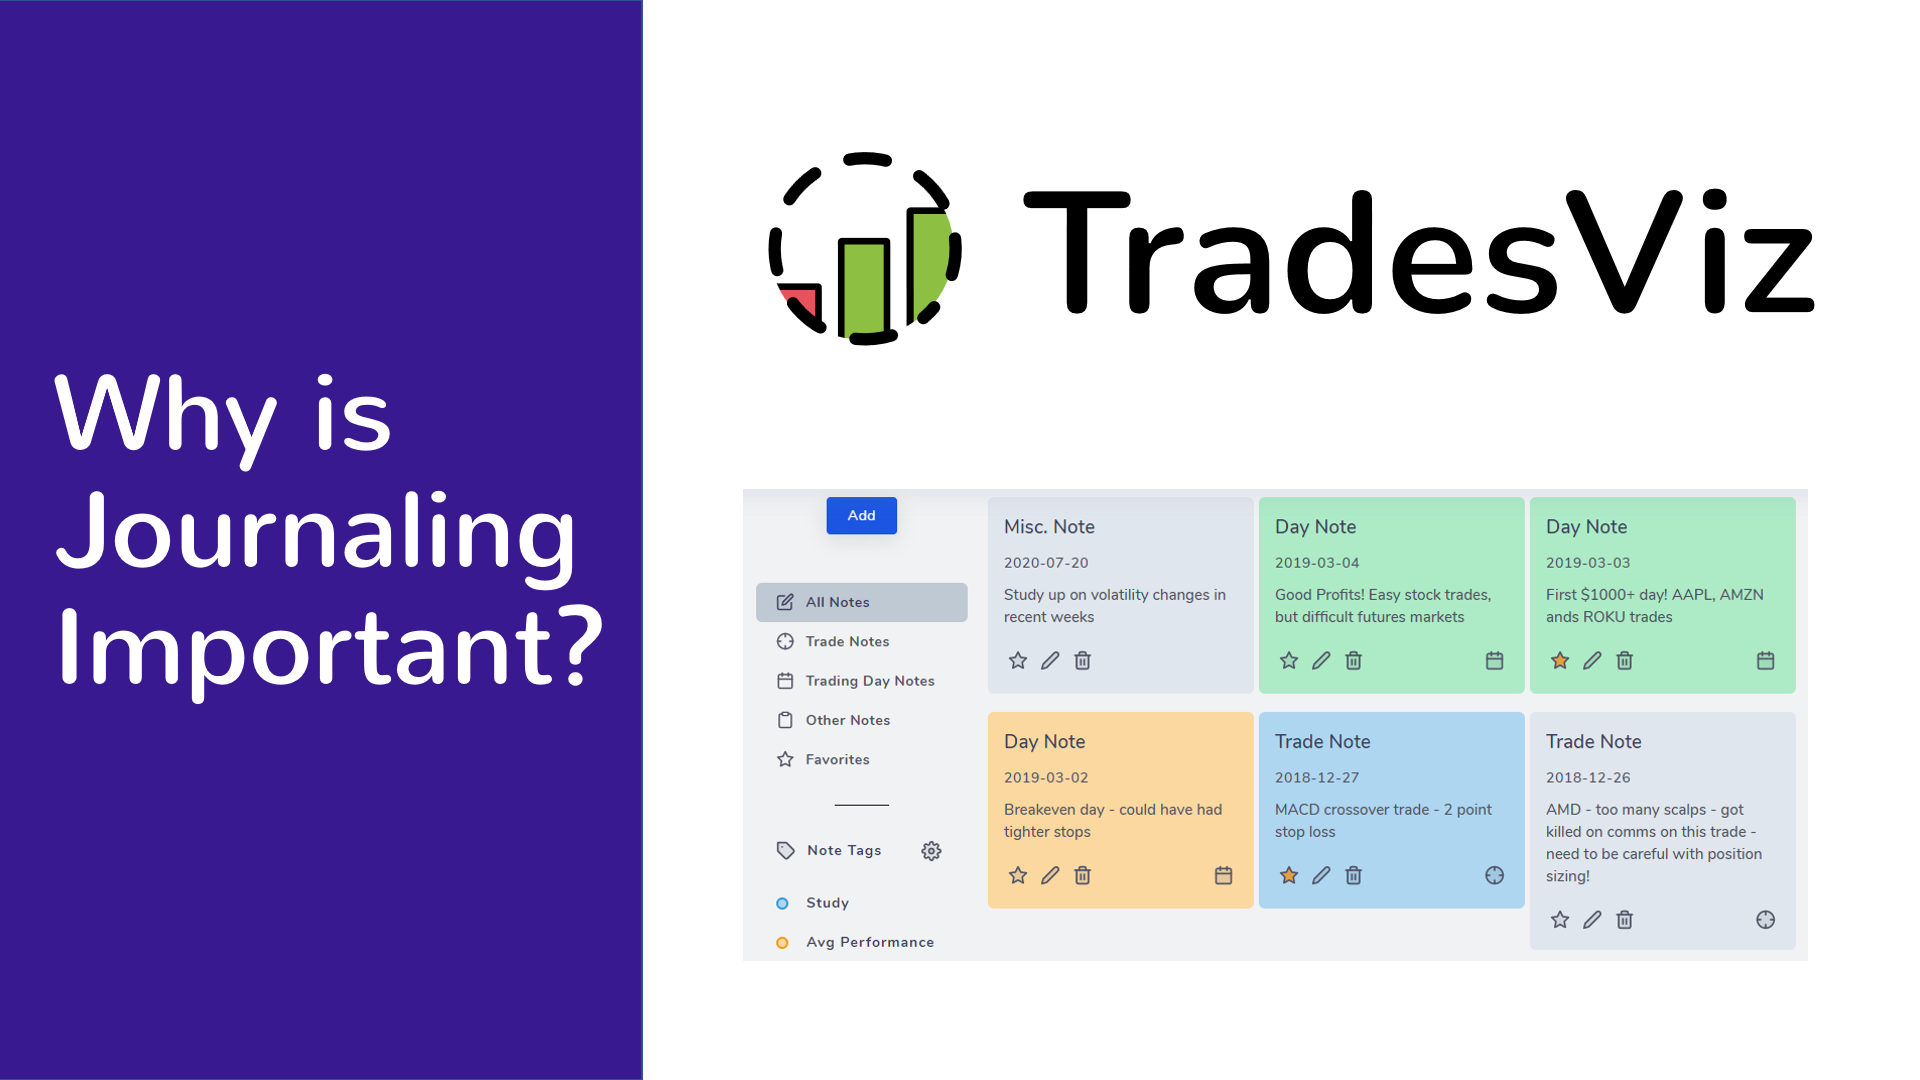
Why even journal your trades? Why should you analyze your trades? How does it help you? All your journaling questions are answered here!
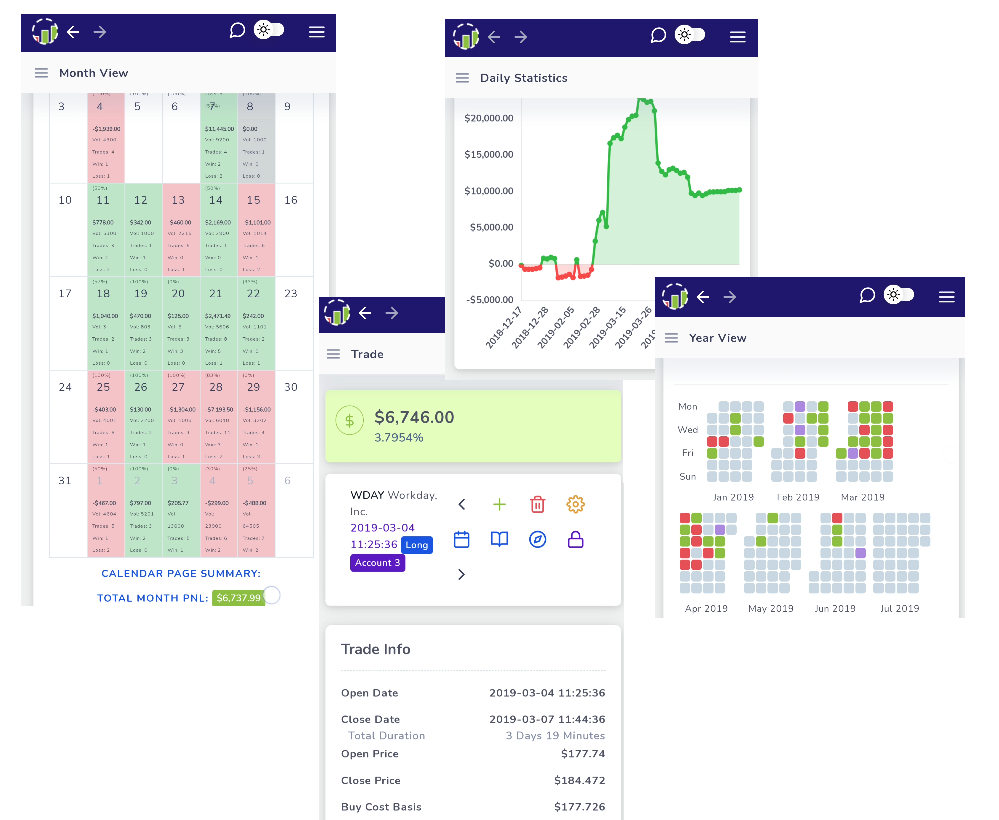
Want to use TradesViz on your mobile without your browser? Learn how here!
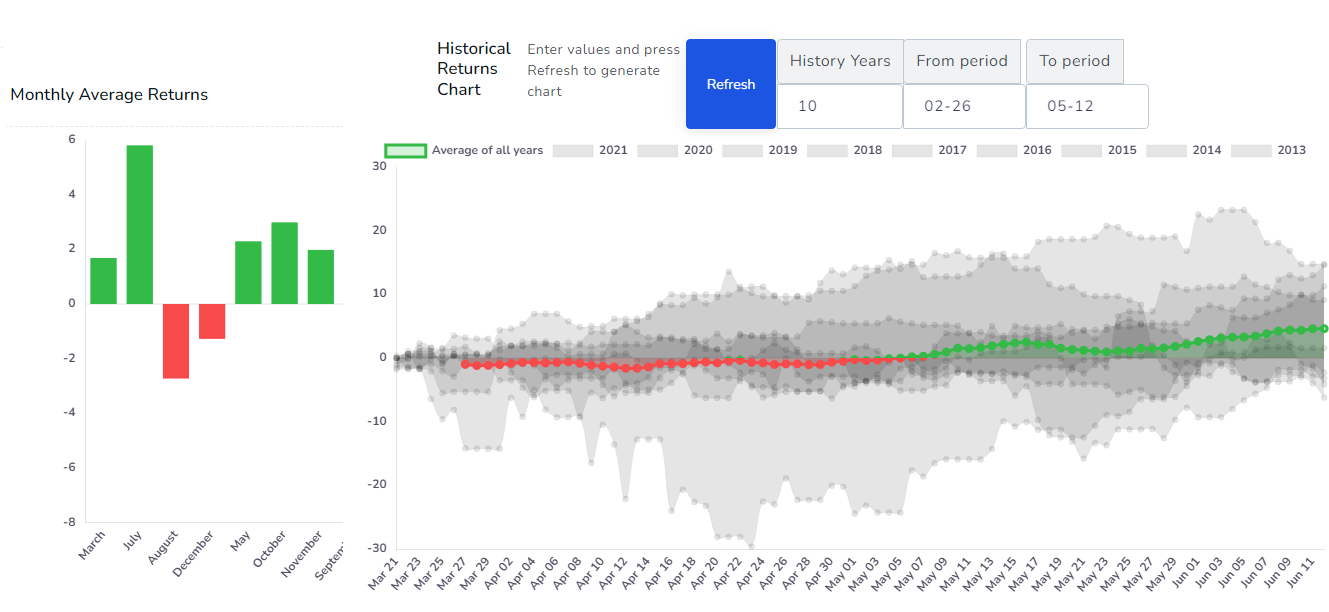
In trading, it is said that history always repeats itself... So, why not use it to our advantage? You can now view seasonality charts for ANY symbol from US, Canada & Indian exchanges on TradesViz to see how the ticker's performance changed historically for any given period. Update: Use the Returns tab to analyse an exact seasonal window, drag entry and exit dates, interpret yearly paths, and compare or export annual outcomes.

A massive new feature: Options flow added to TradesViz along with auto-import support for Robinhood, custom dashboards, and lots of minor QoL features. Read on to know more!
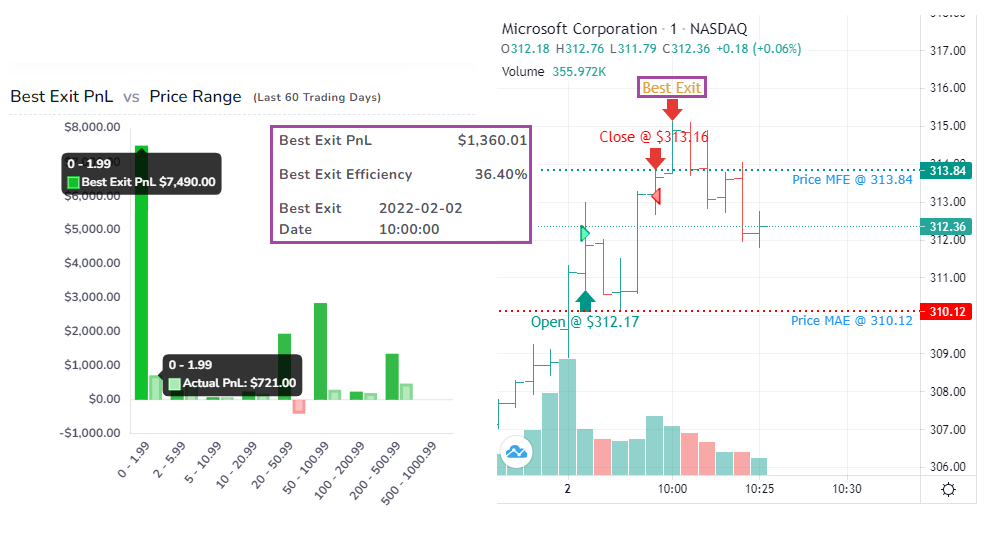
Ever wonder how much money you could have made if you held on to that trade for just a little longer? No need to daydream about it anymore. You can visualize and analyze every single trade's exit efficiency and best exit time to tweak your strategy to maximize your profits.
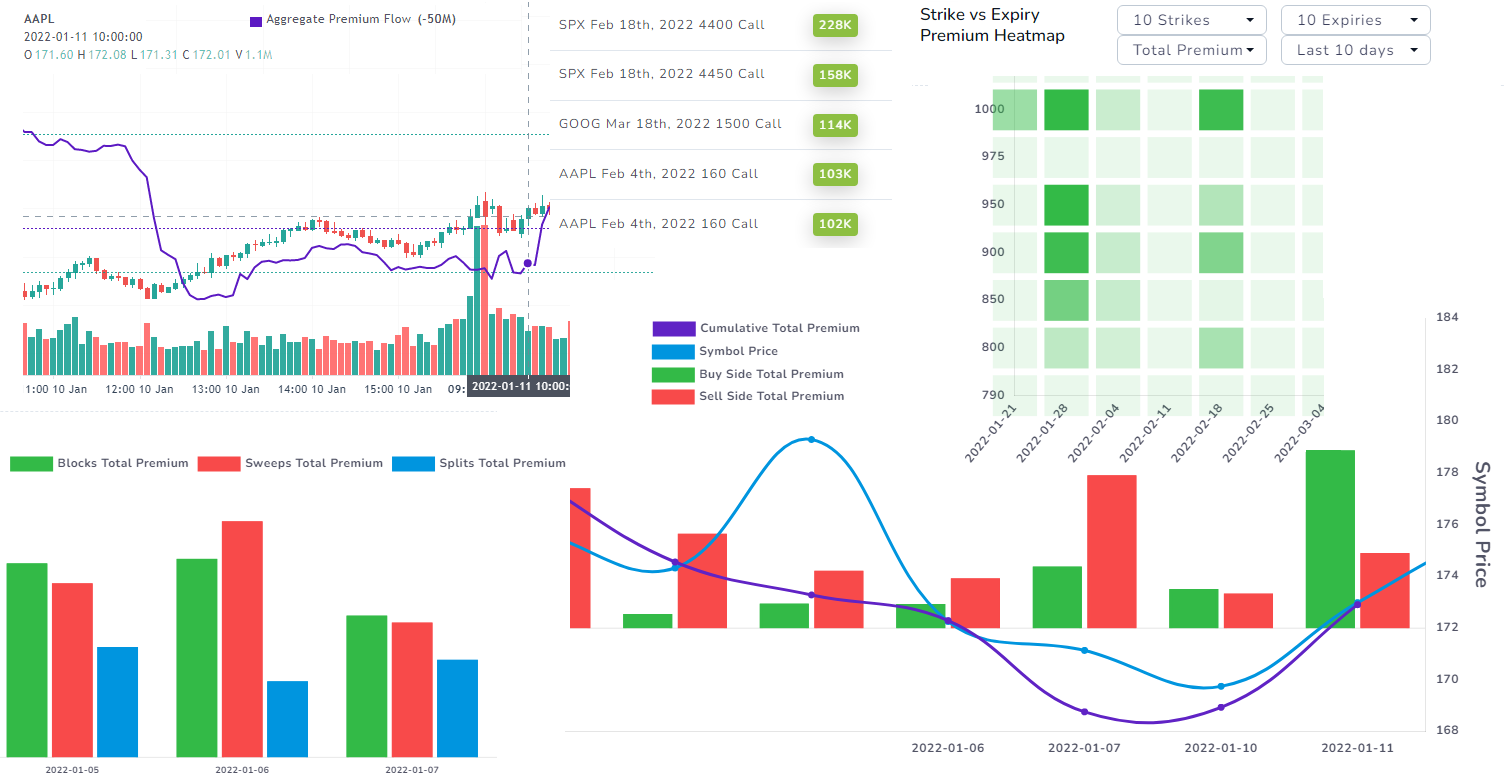
It's finally here: The best options flow dashboard with TRUE market data and all the right visualizations to help you plan your trades and learn more about the market conditions! Use flow analysis in combination with your journaling to get a COMPLETE picture of the market and how you performed.
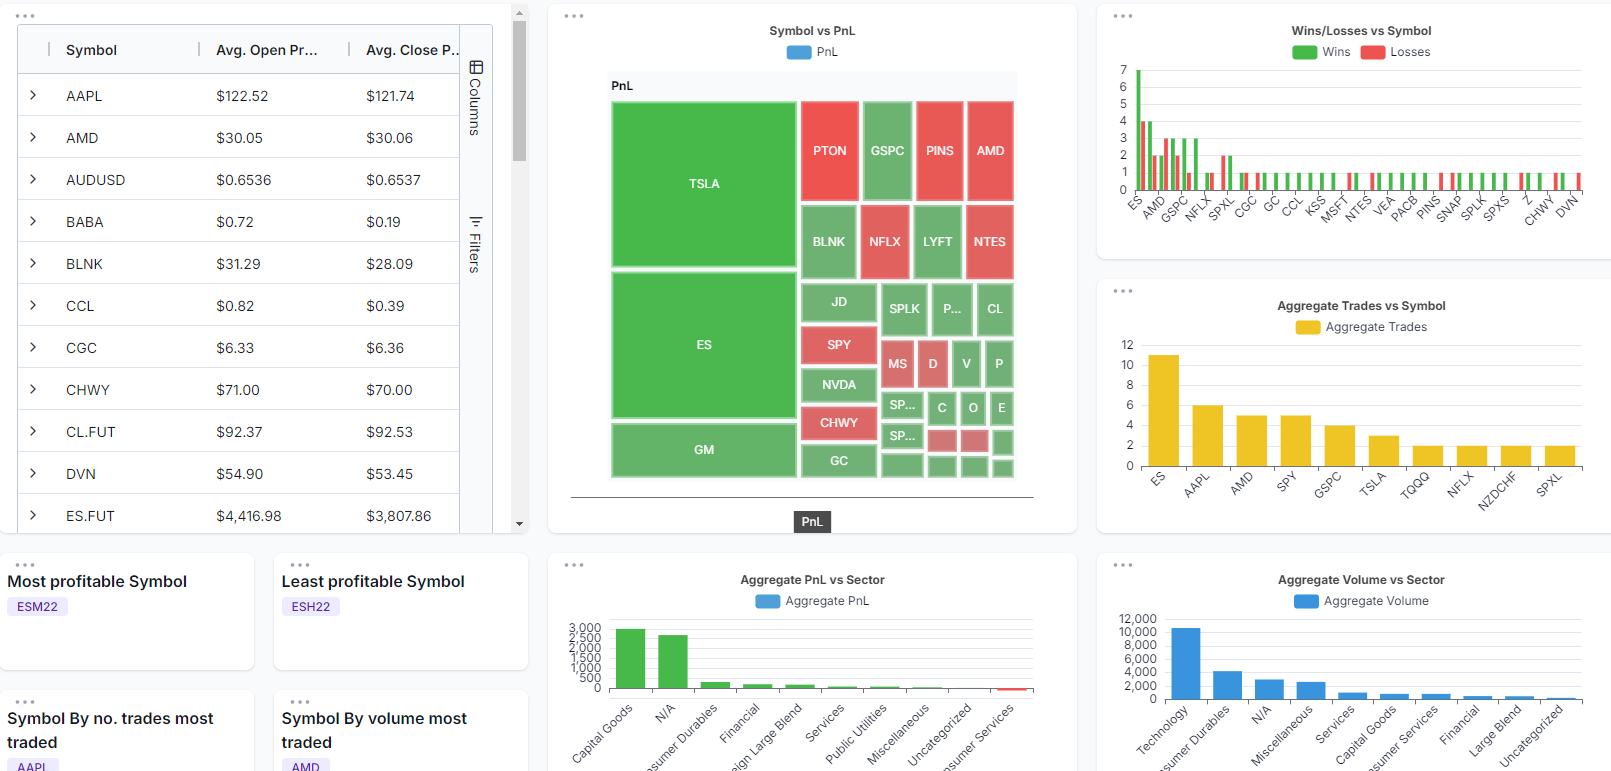
Learn how to create a custom dashboard with any charts and statistics you want! We really mean it when we say TradesViz is THE MOST FLEXIBLE trading journal available!

If you are having any import issues, chances are that this blog has answers to fix them. All common import issues and fixes are explained here.
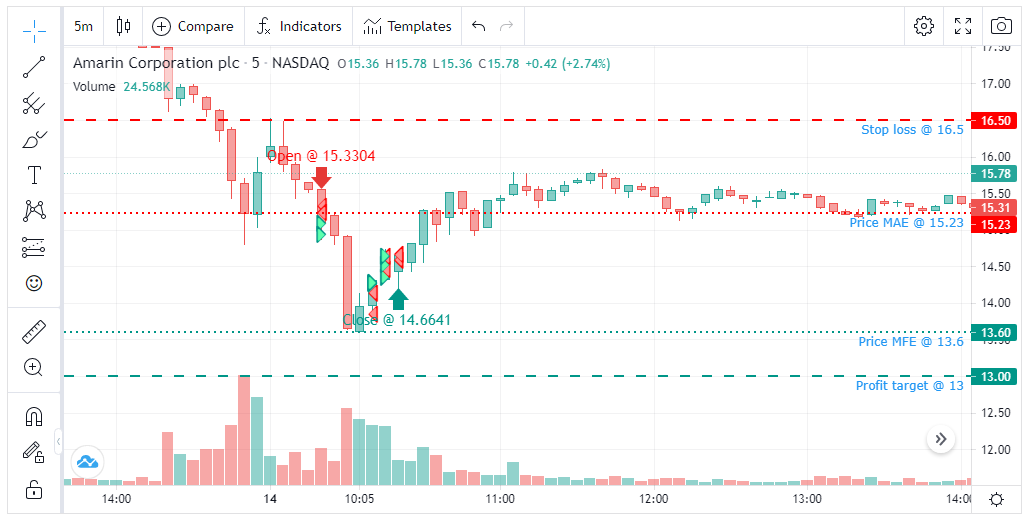
TradingView charts are now available for ALL your trades! 70+ Indicators, draw your technical analysis and save them on any chart, load and save custom indicator templates to use on any chart! Static charts, Custom interactive chats, and now we have the popular TradingView charts for your trades!
We have 66 detailed guides for connecting your broker and importing trades.
View all integrations & import guides