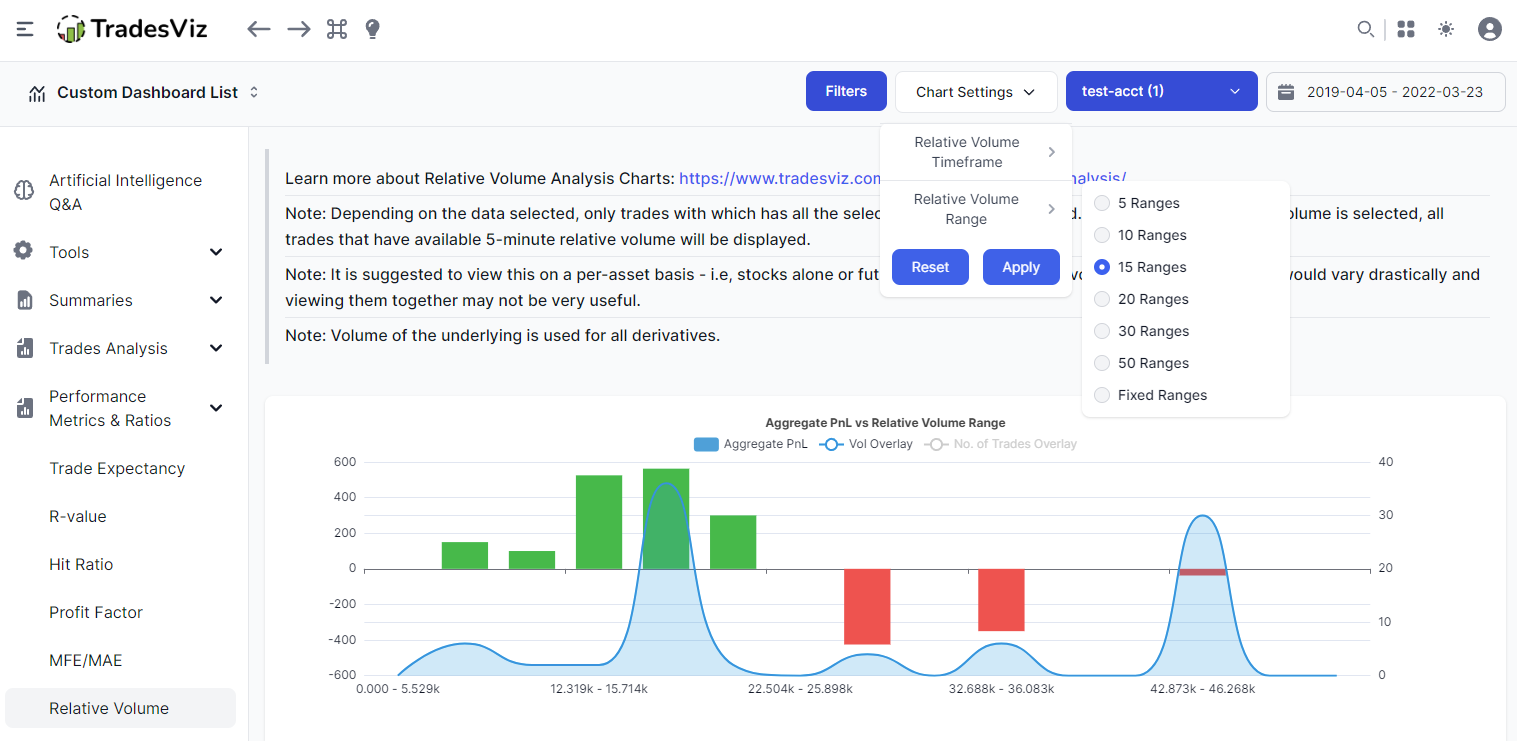
New charts: Relative Volume Statistics
Do you trade well when there's a certain amount of volume/volatility? Time, date, time, etc., are not the only way to analyze. Learn more about how you can use the relative volume to optimize your trading.
Guides, changelogs, deep dives and everything trade journaling.
Do you trade well when there's a certain amount of volume/volatility? Time, date, time, etc., are not the only way to analyze. Learn more about how you can use the relative volume to optimize your trading.
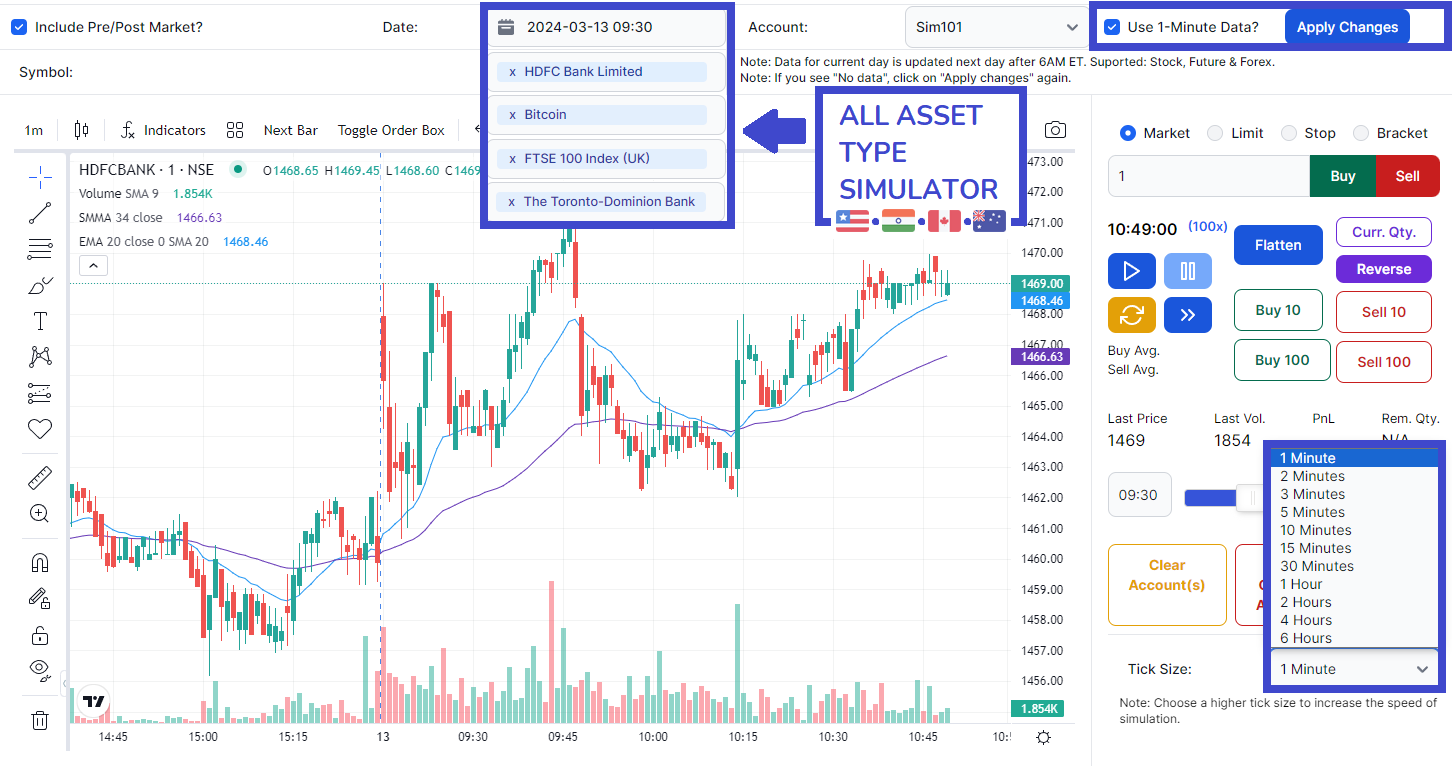
We've introduced the most advanced and versatile online reading simulator for US stocks, ETFs, futures, and all forex pairs. But what about the other symbols and exchanges? Well, you can now. NSE/BSE, AU, IN, Cryptocurrency - everything can be simulated. All-in-one stock, futures, forex, cryptocurrency, and index trading simulator for all supported exchanges: Exclusive only on TradesViz.
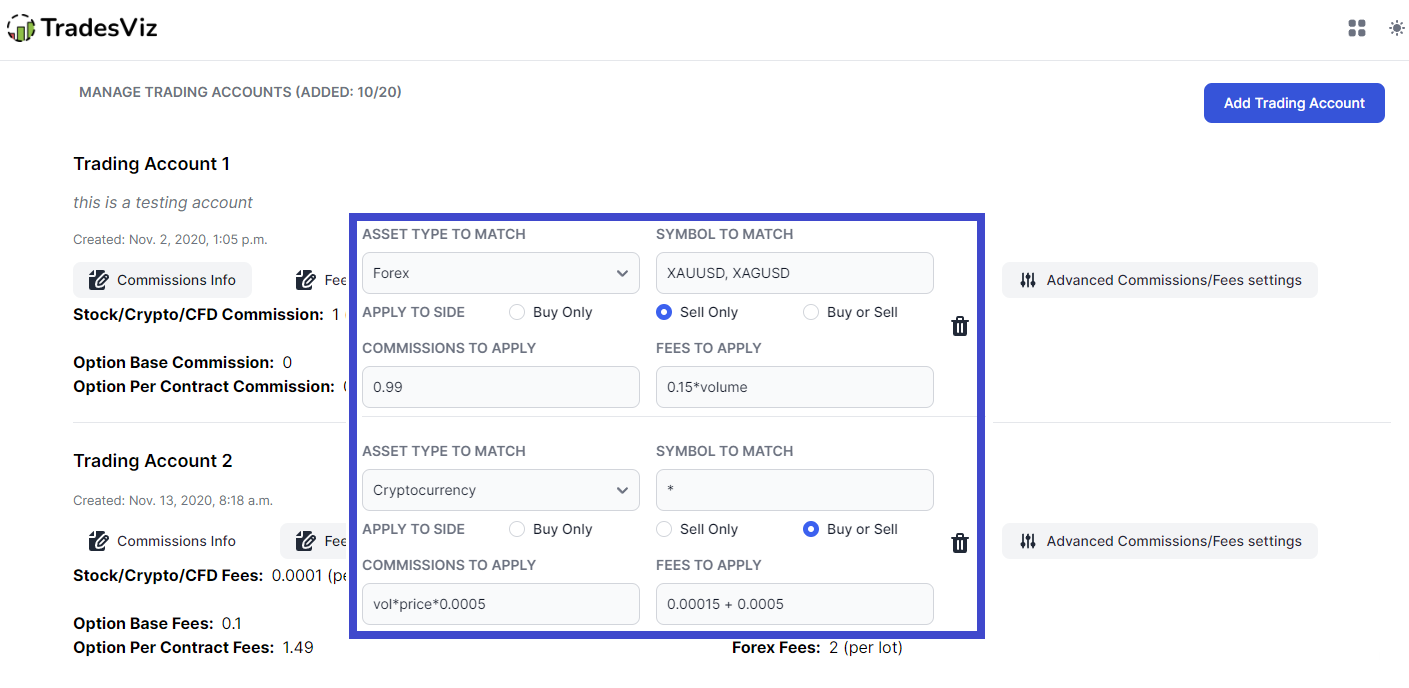
Does your broker not report any commissions/fees? Are you tired of entering stops/profits, commissions/fees to your trades? Fret not! TradesViz's advanced account settings can automate all of this for you!
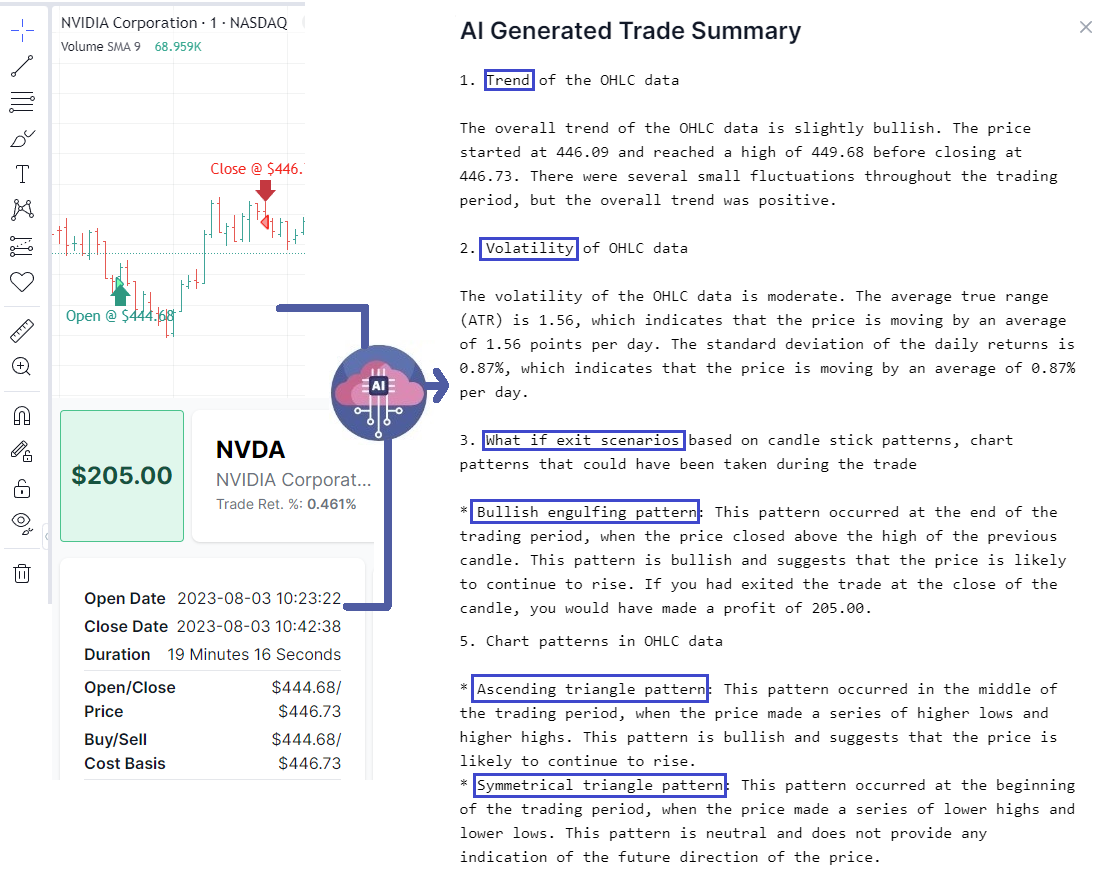
We've automated a lot of parts of journaling - one part we've yet to explore is note-taking. We're solving that with this AI feature on TradesViz.
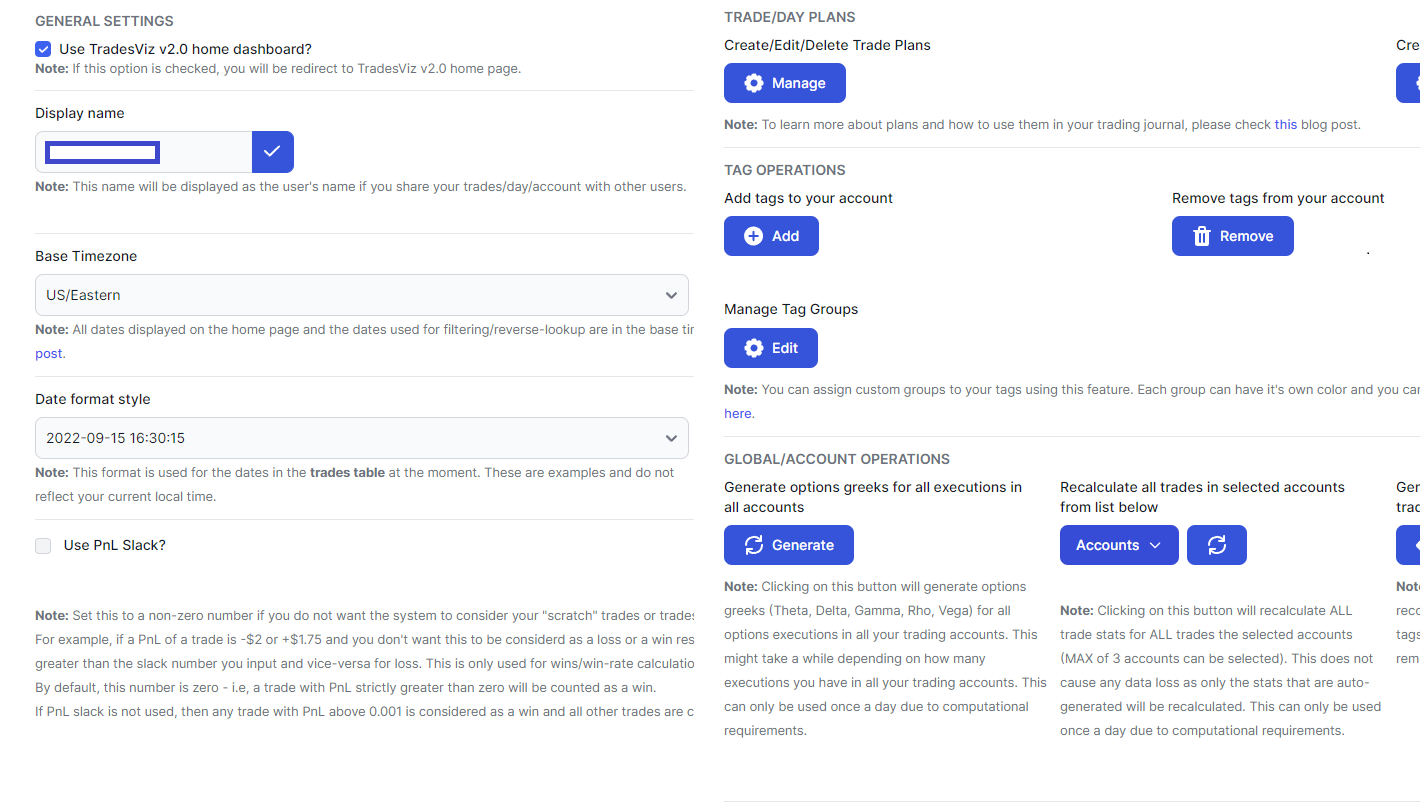
Adding trading accounts, setting base currency, and more settings and options that affect what you see in your dashboard. [NEW] Updated with 2024 features and tips based on TradesViz v2.0 UI!
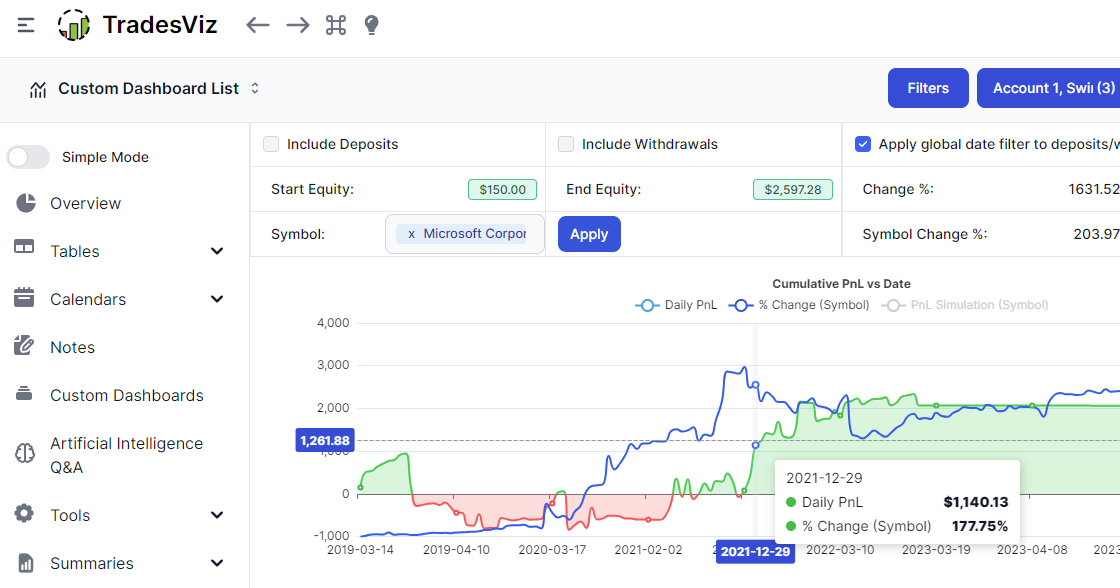
A perfect year-end feature! Compare your overall trading equity curve to ANY symbol - including indices, ETFs, etc., How did you fare against the market? This helps you understand and answer that question!
Another big addition to the TradesViz platform: A full-fledged backtester for any asset type on any timeframe with almost any indicator combination. Powered by the infinitely flexible EZstockscreener, you can now do quick and easy backtesting on TradesViz itself.
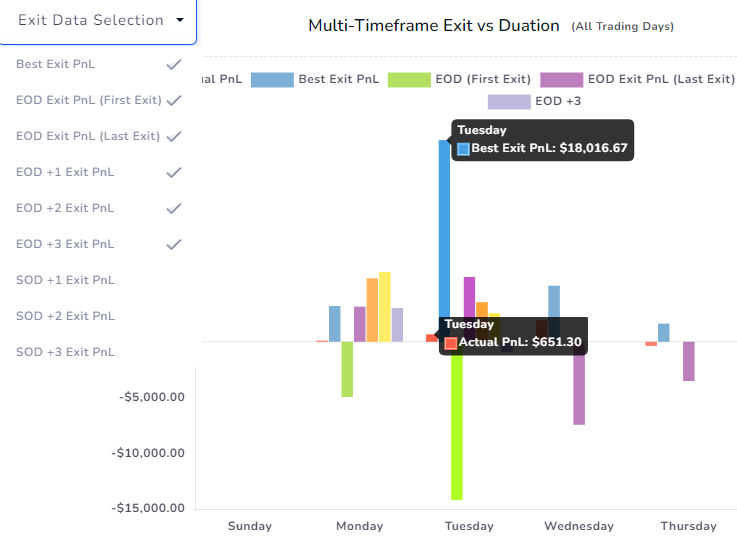
The unification of all the different types of exit simulations! You can now view all your exit stats in a single chart to optimize your trade holding time to maximize your profits!
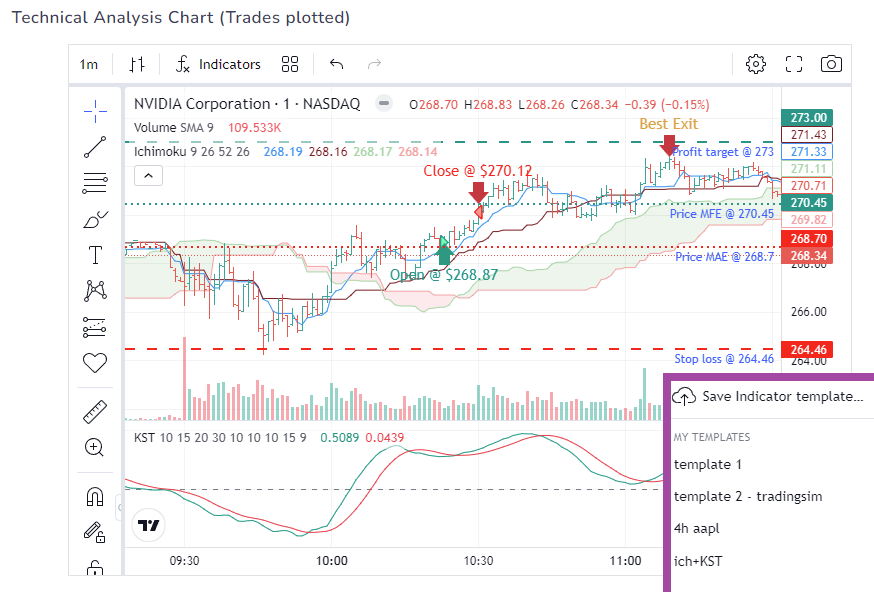
We've had super customizable image charts, then we introduced TradingView charts with customizable indicators and now you are able to automatically apply entire chart templates to your TradingView charts in TradesViz.
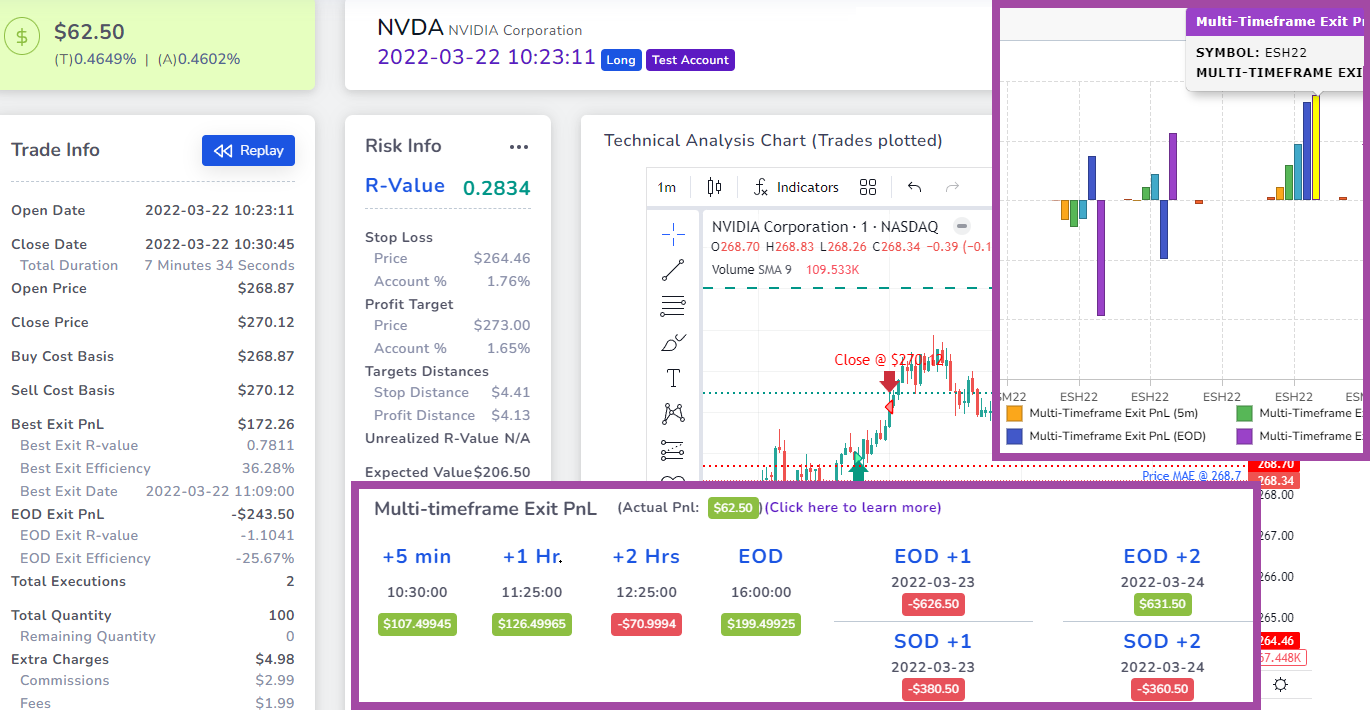
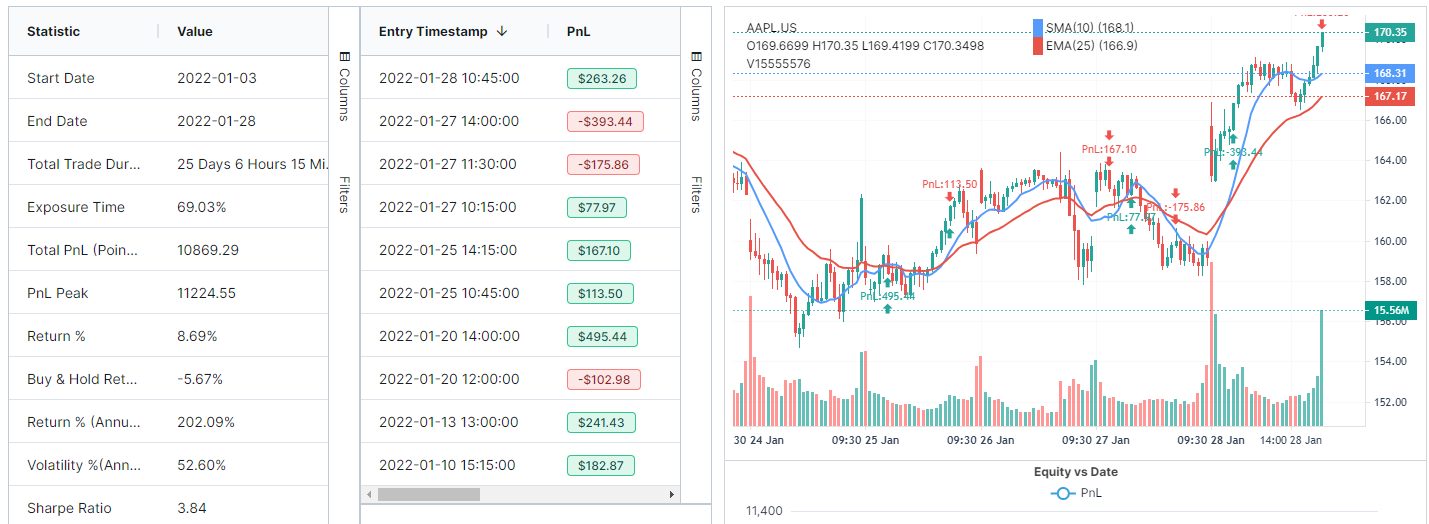
Have you ever wondered what would have happened to your trade if you had exited after 5 minutes? 1 hour? maybe after 2 days? It can be eye-opening to see these stats generated automatically for every single trade you take!
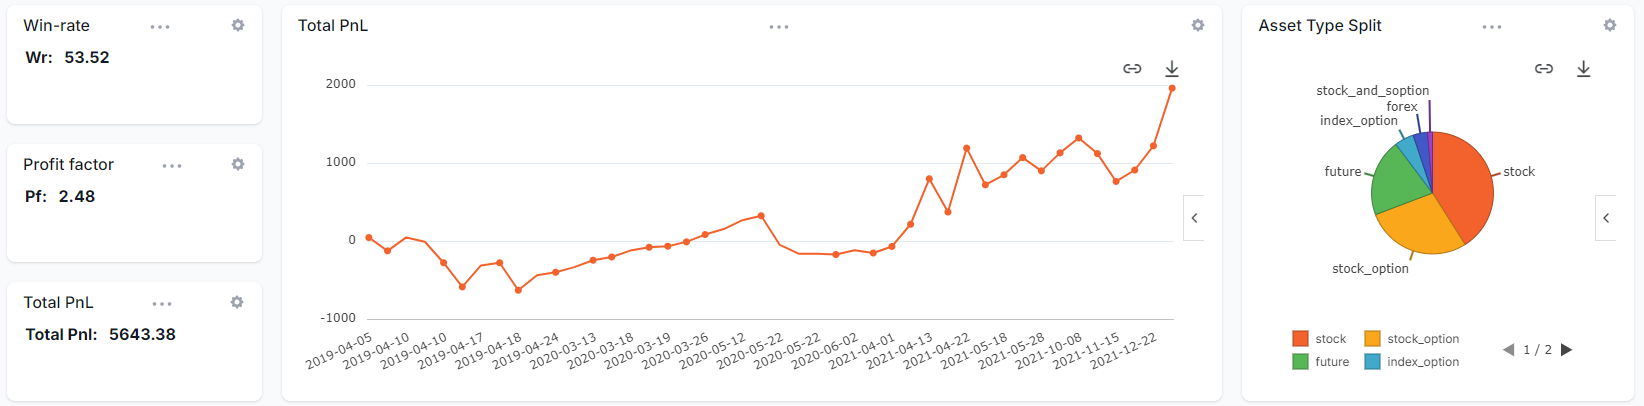
We've explored the highly customizable 400+ widgets custom dashboard on TradesViz, but when you include AI in it, the flexibility is no longer bound by a number - Unlimited possibilities - add ANY chart or any stat in your custom dashboard!
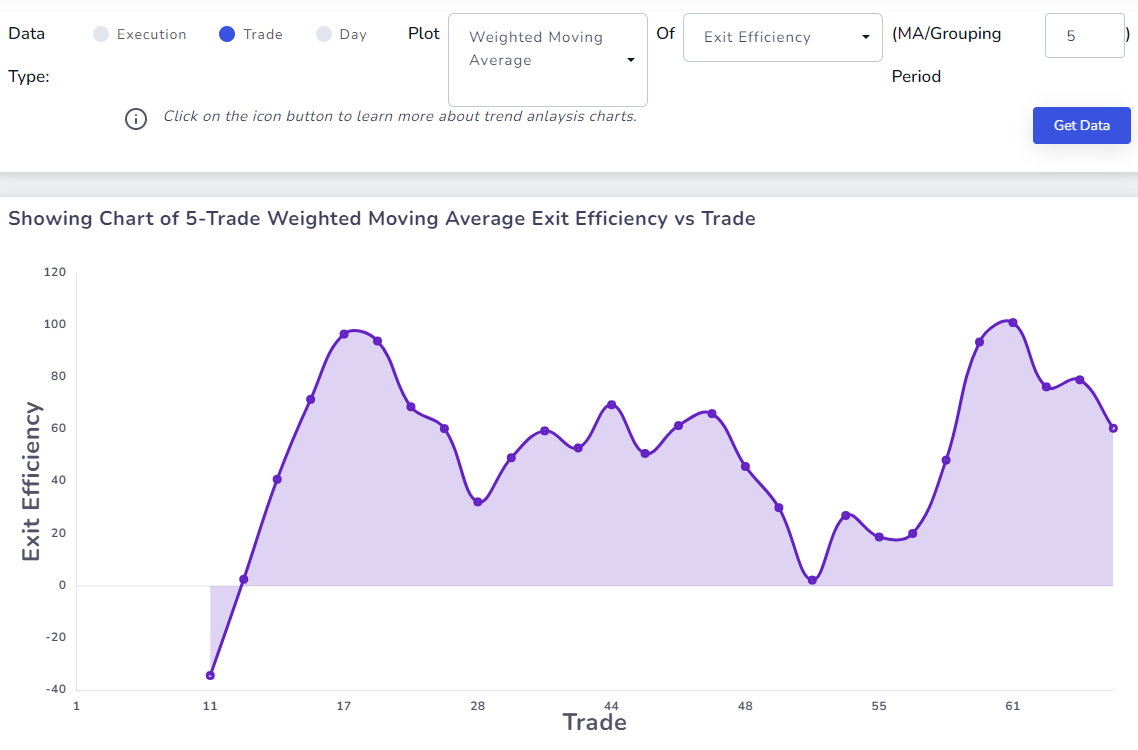
Visualize your trading trend. For example, how has your R-value been changing over time? Are you improving? These trend charts help you answer exactly those questions about your trading performance.