TradesViz

TradesViz

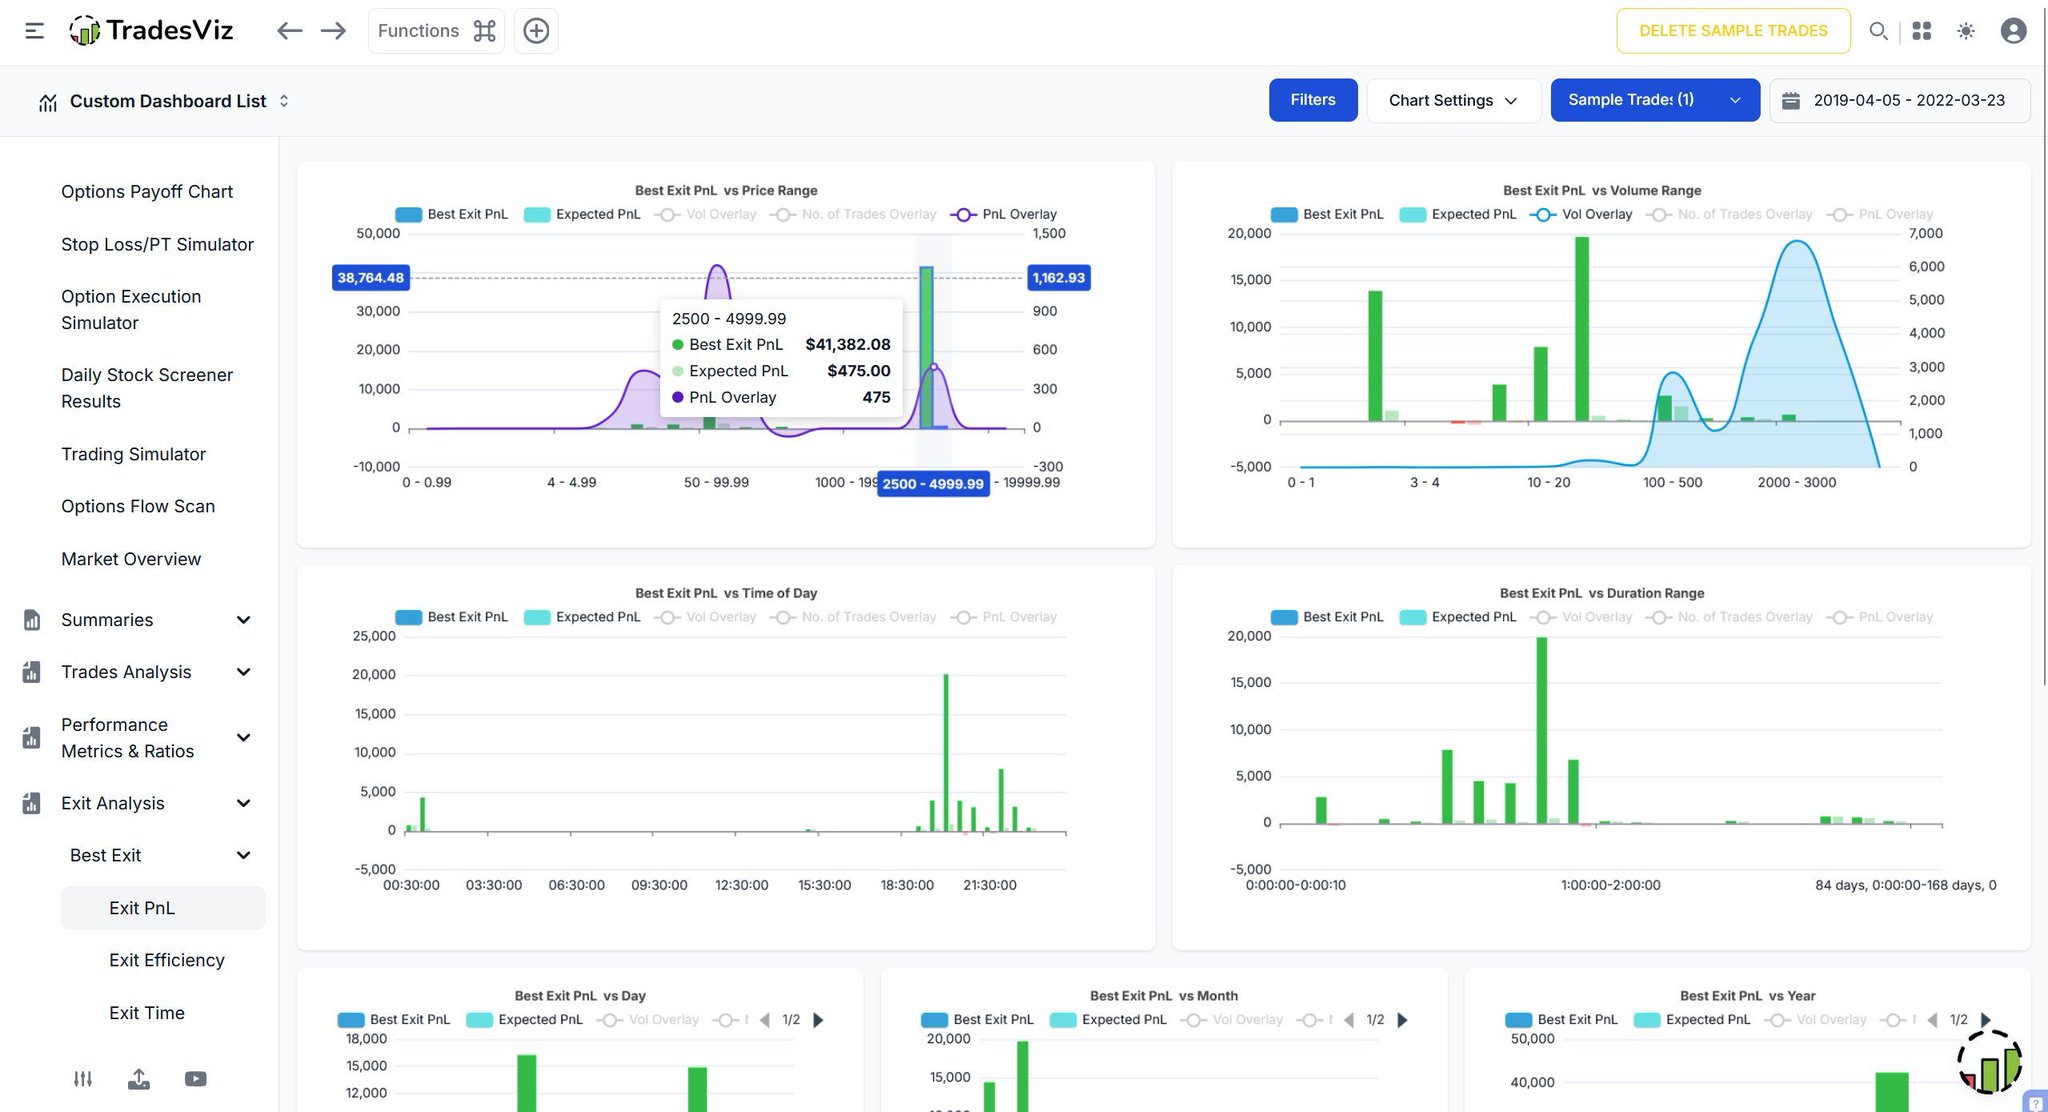
The Exit Analysis dashboard in TradesViz brings precision to one of the most critical parts of trade management — knowing when to step out 📊 It visualizes how PnL evolves across price, volume, and duration ranges, exposing where conviction in exits aligned with market flow and where opportunities were left on the tape. Each chart lights up points of notable efficiency, showing how timing shaped performance outcomes 📈 Whether you’re refining strategy or reviewing past positioning, this view keeps exits transparent and data-backed. It turns hindsight into a structured analysis that keeps execution discipline firmly on the radar 🔎
User-posted image
View original post
TradesViz

TradesViz

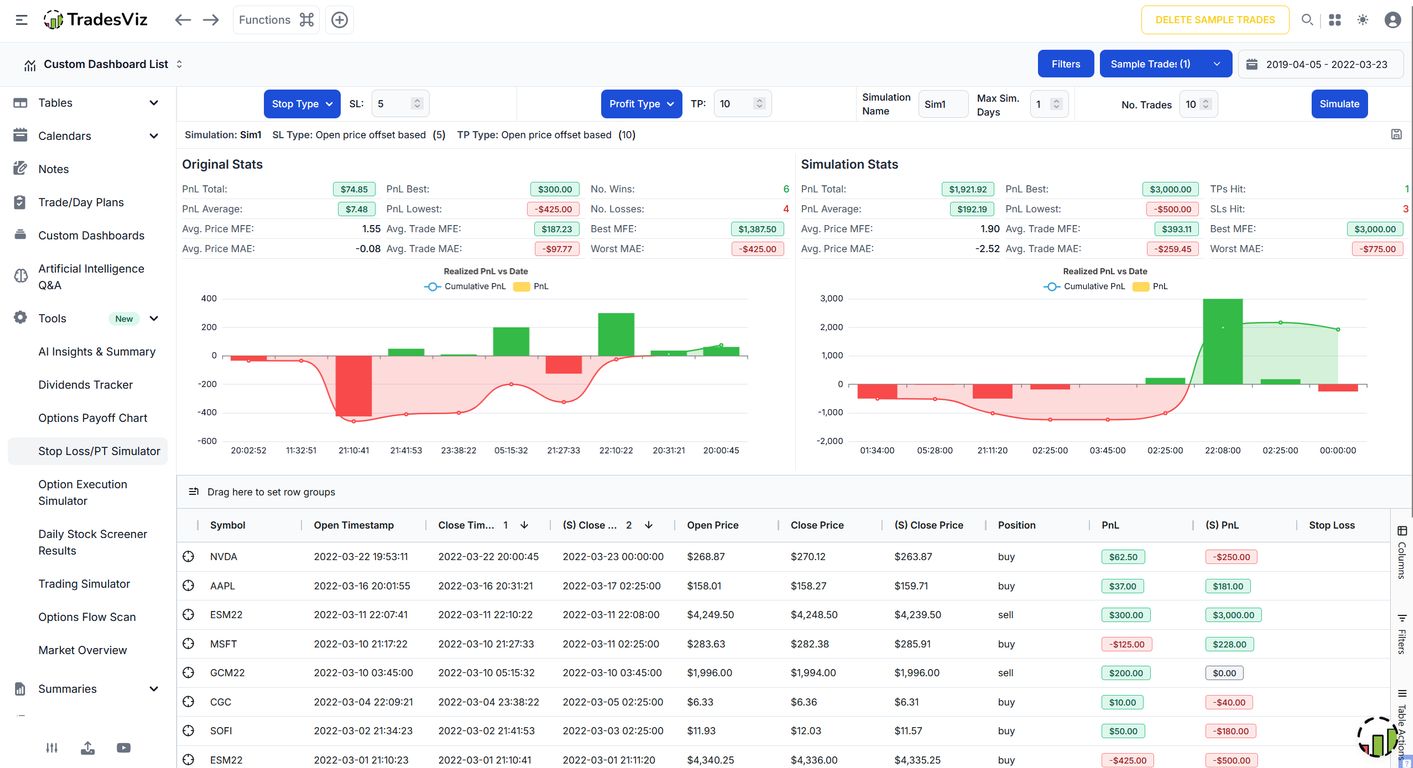
The Stop Loss & Profit Target Simulator in TradesViz lets you test discipline before committing capital 📊 By adjusting SL and TP levels, you can instantly see how the tape reacts under different constraints. The side-by-side view of original vs simulated PnL lit up with clear contrasts shows how tweaks in risk parameters shift conviction, drawdowns, and recovery curves 📈 This tool keeps strategy refinement grounded in data, not guesswork. Every simulation helps position future trades with more awareness and precision, putting risk management firmly on the radar ⚙️

User-posted image
View original post
TradesViz

TradesViz

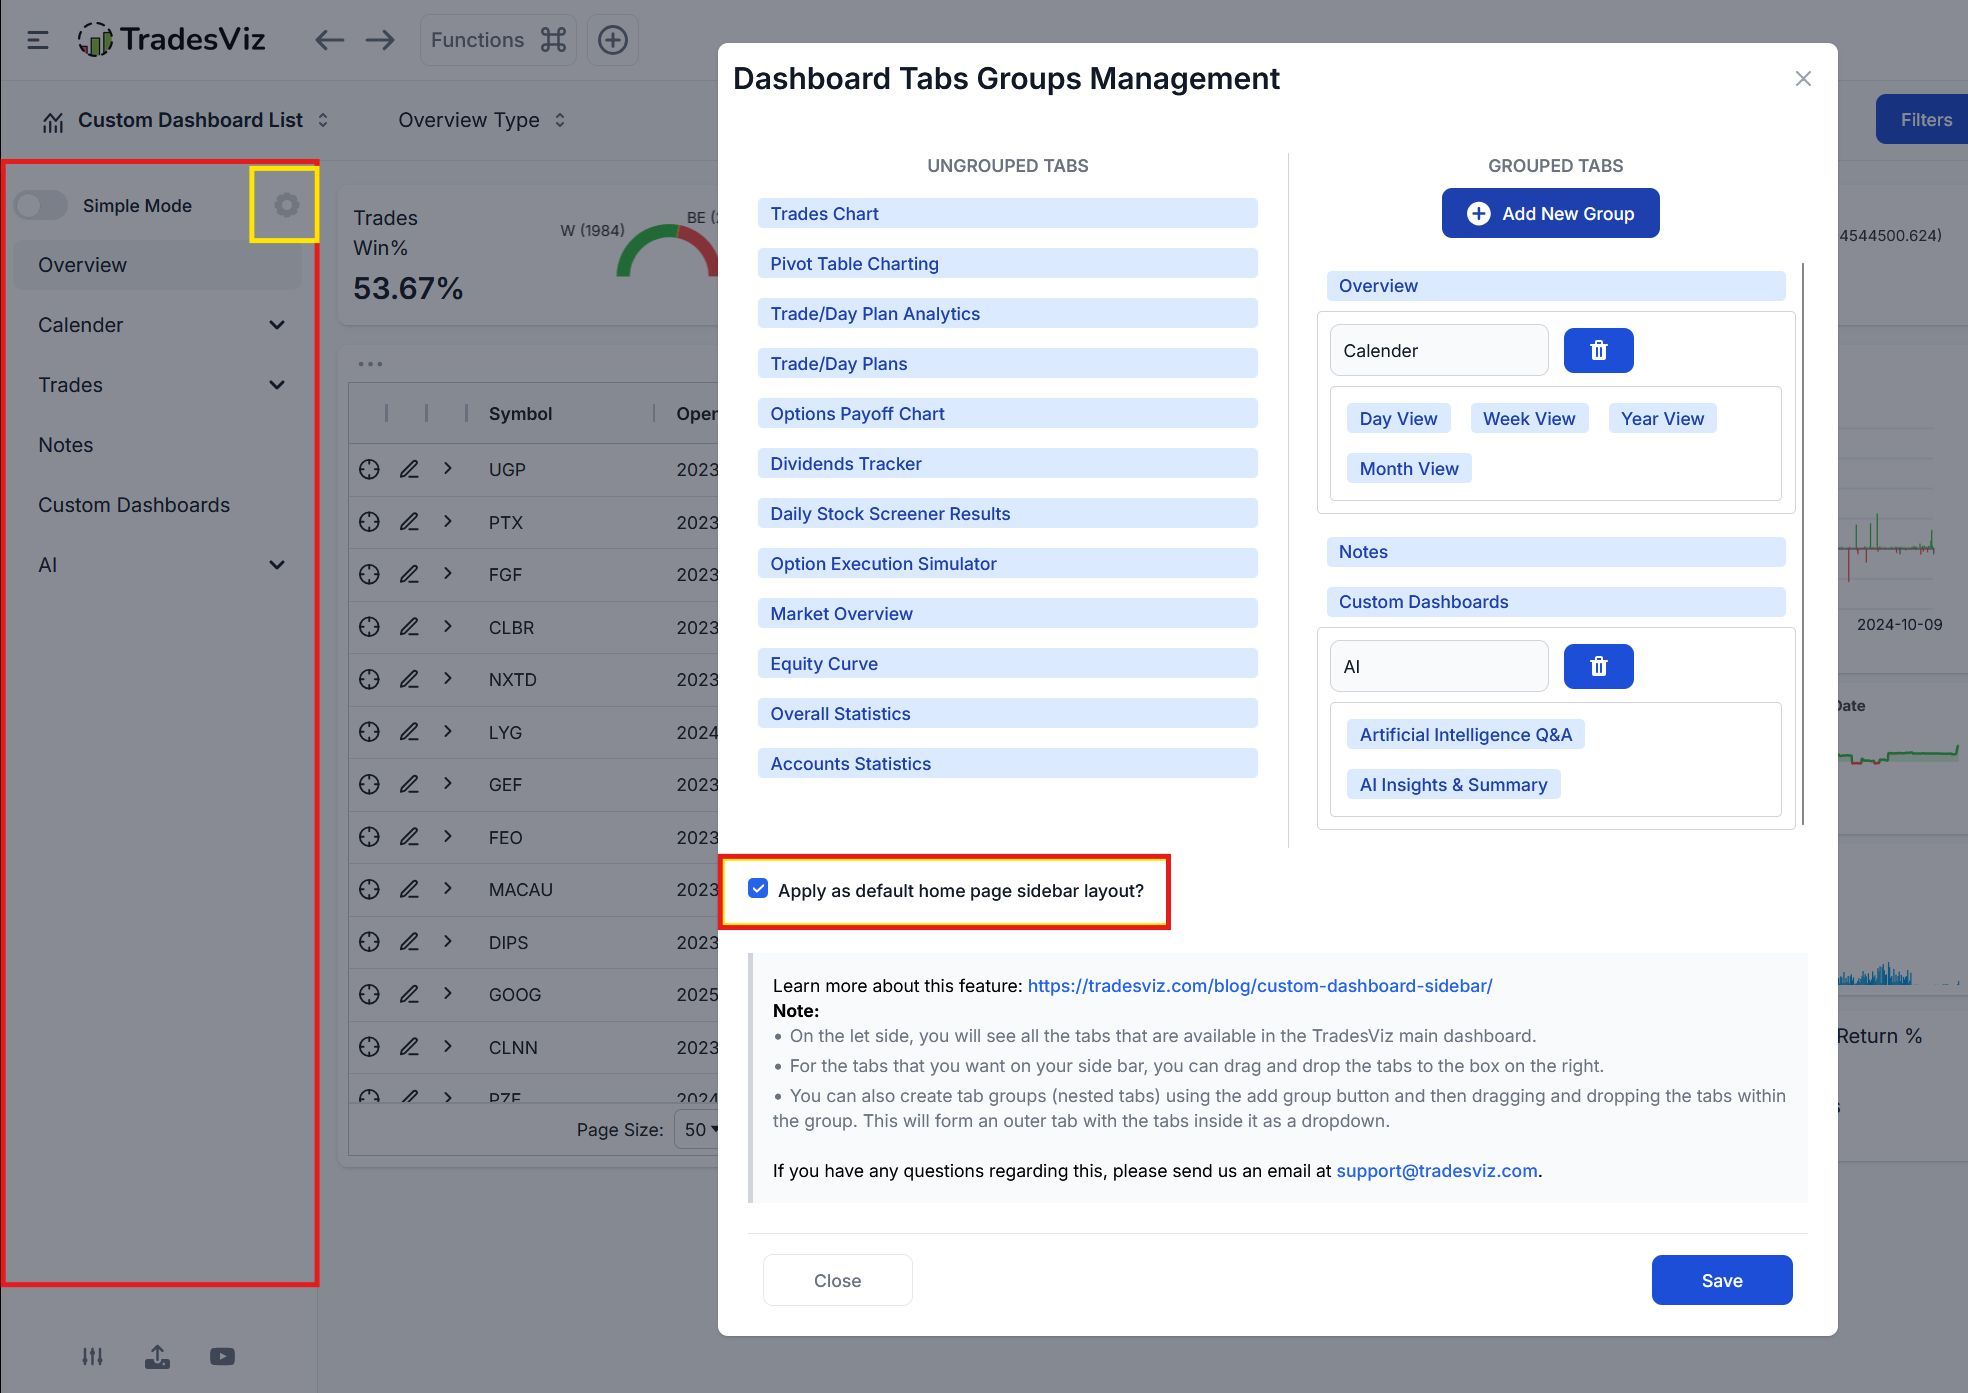
Did you know you can fully customize your sidebar in TradesViz? 📊 Just click the gear icon beside Simple Mode to open Dashboard Management. From there, drag and arrange your tabs exactly how you want them — whether it’s trades, notes, or your AI insights. Once you’ve set it up, don’t forget to check “Apply as default home page sidebar layout?” to save your custom setup ⚙️ It’s a quick way to keep your workspace clean, efficient, and aligned with how you track the tape every day 🔎

User-posted image
View original post
TradesViz

TradesViz

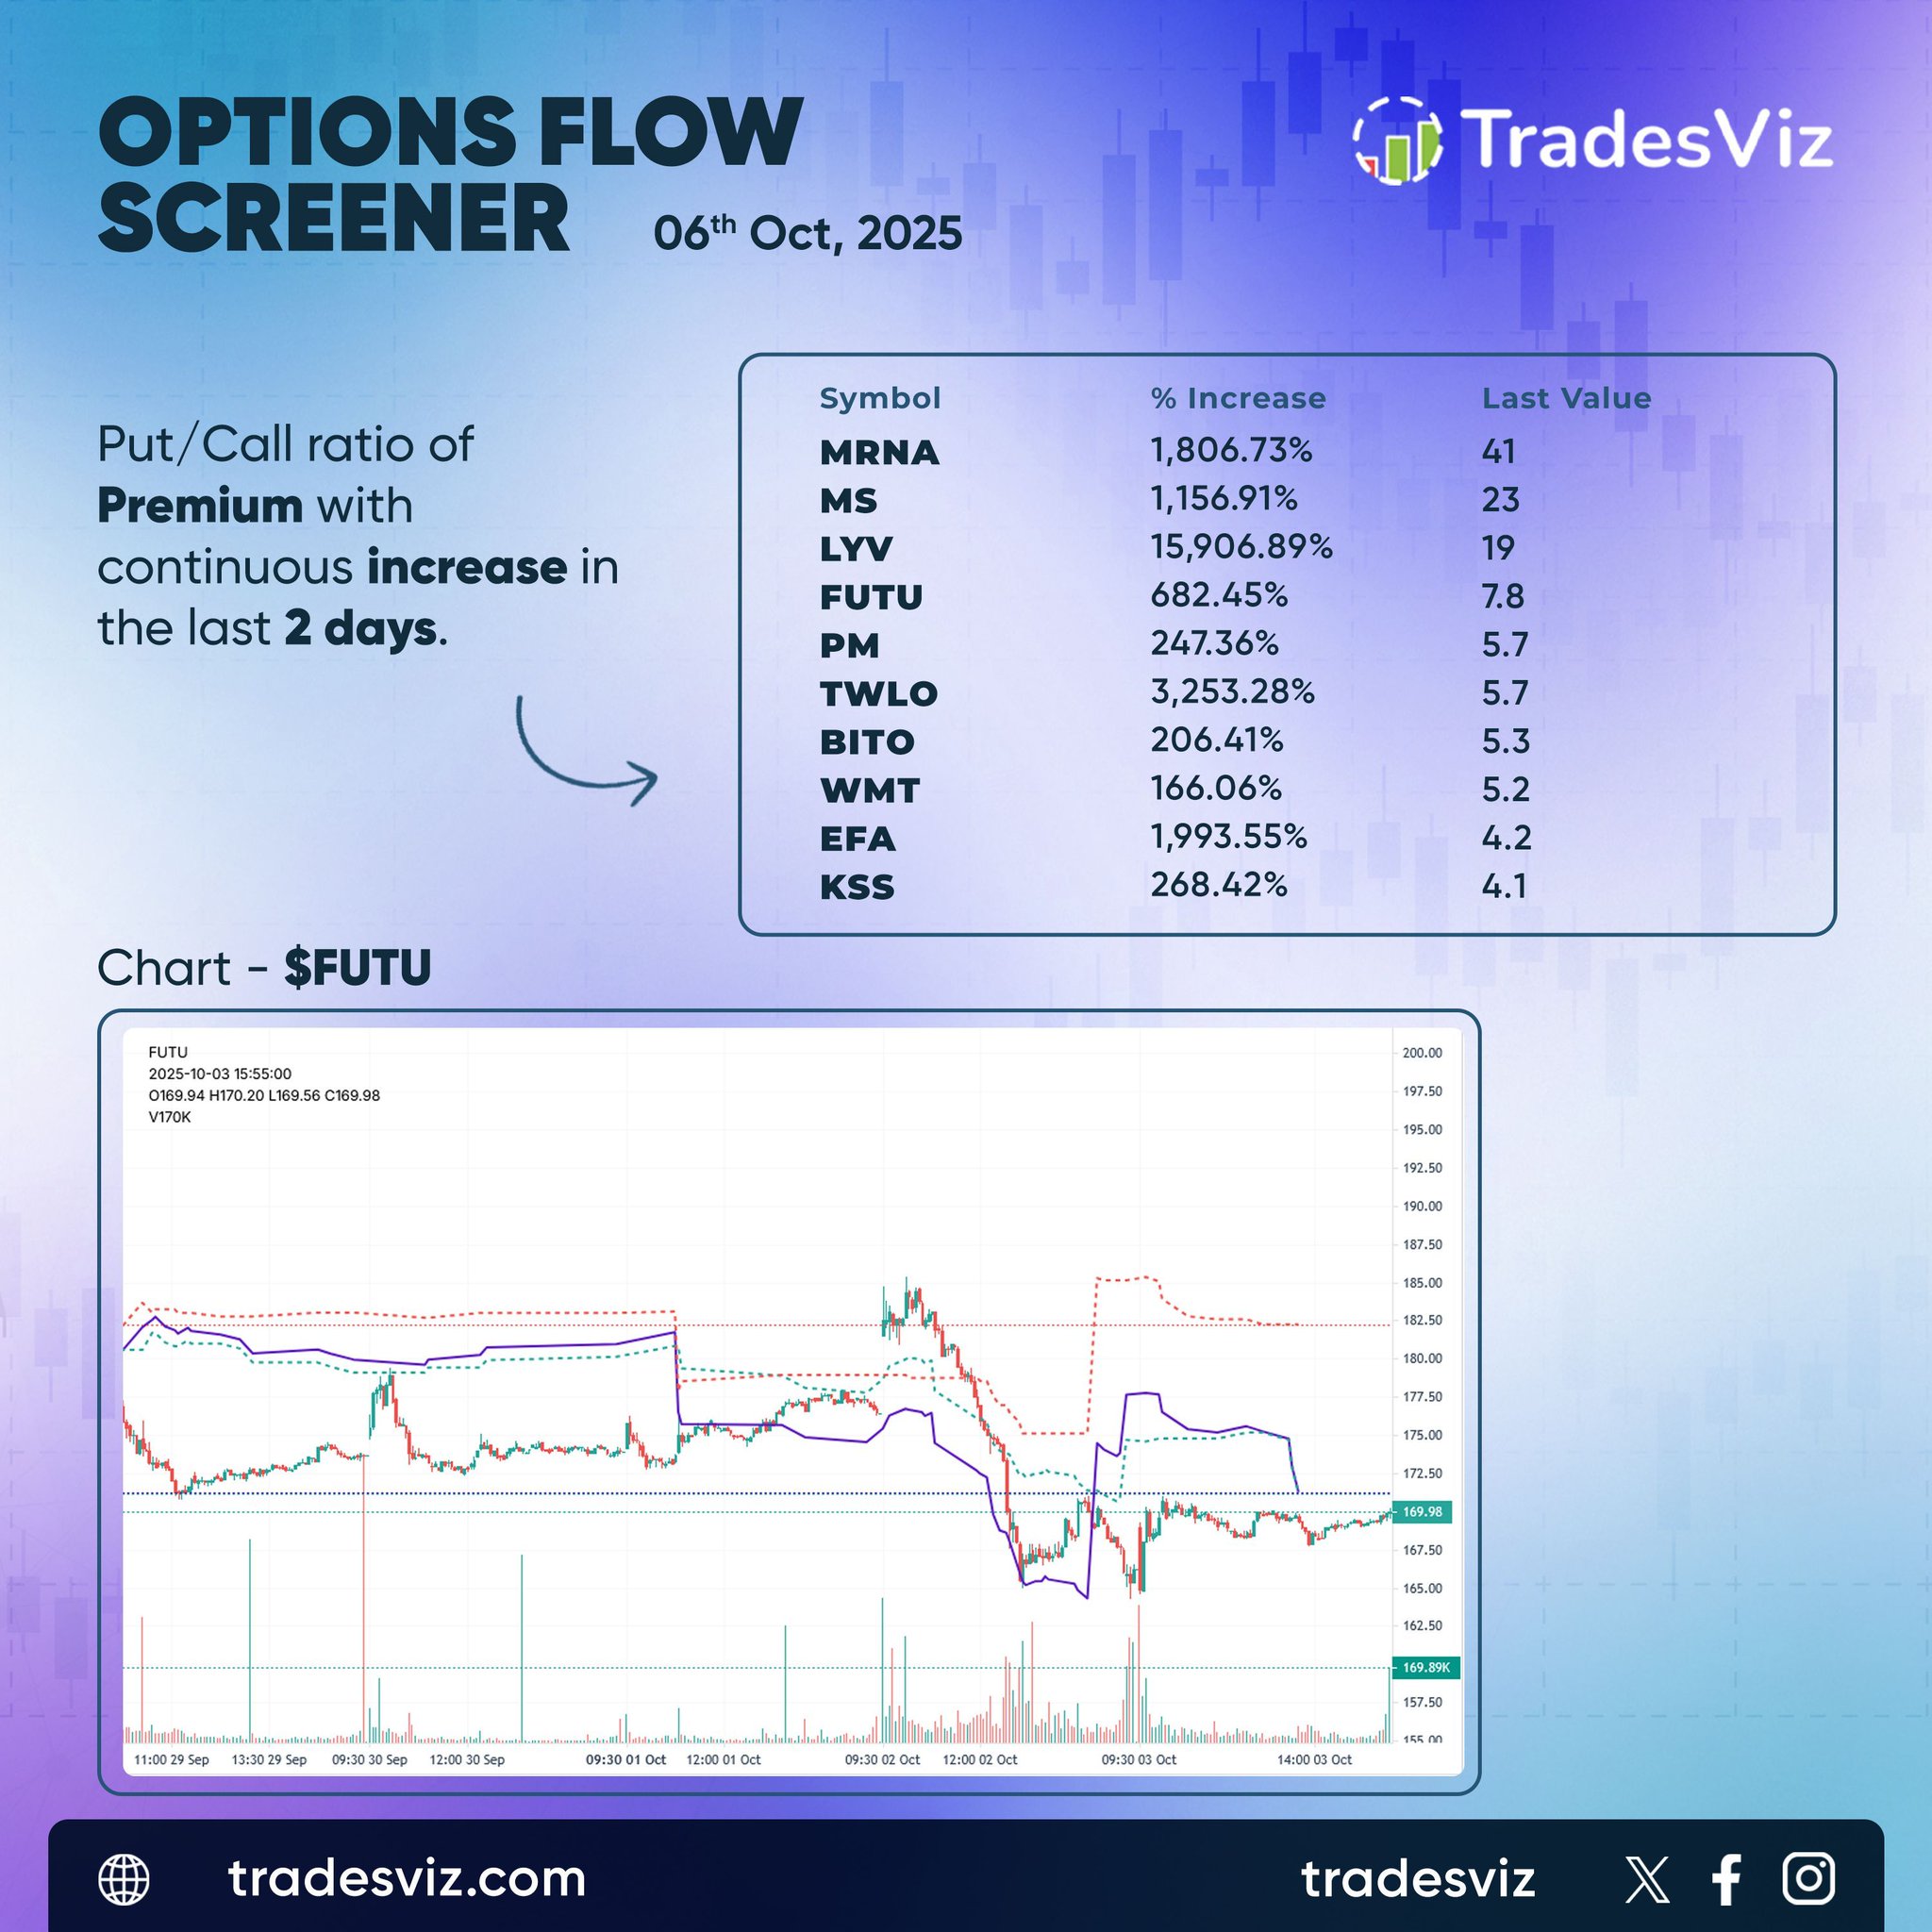
Bearish positioning surged into Oct 6 as put/call premiums spiked across several high‑beta names. $TWLO led with a staggering 3,253% increase in its ratio, followed by  $MRNA and  $EFA with gains north of 1,800%.  $FUTU drew attention with a 682% jump and a notable shift in intraday volatility, suggesting traders are repositioning for downside risk.  $MS and  $WMT also showed steady builds in put activity.  When ratios widen rapidly across diverse sectors, it often signals broad‑based hedging pressure rather than isolated sentiment. The tape is clearly tilting defensive.

User-posted image
View original post
TradesViz

TradesViz

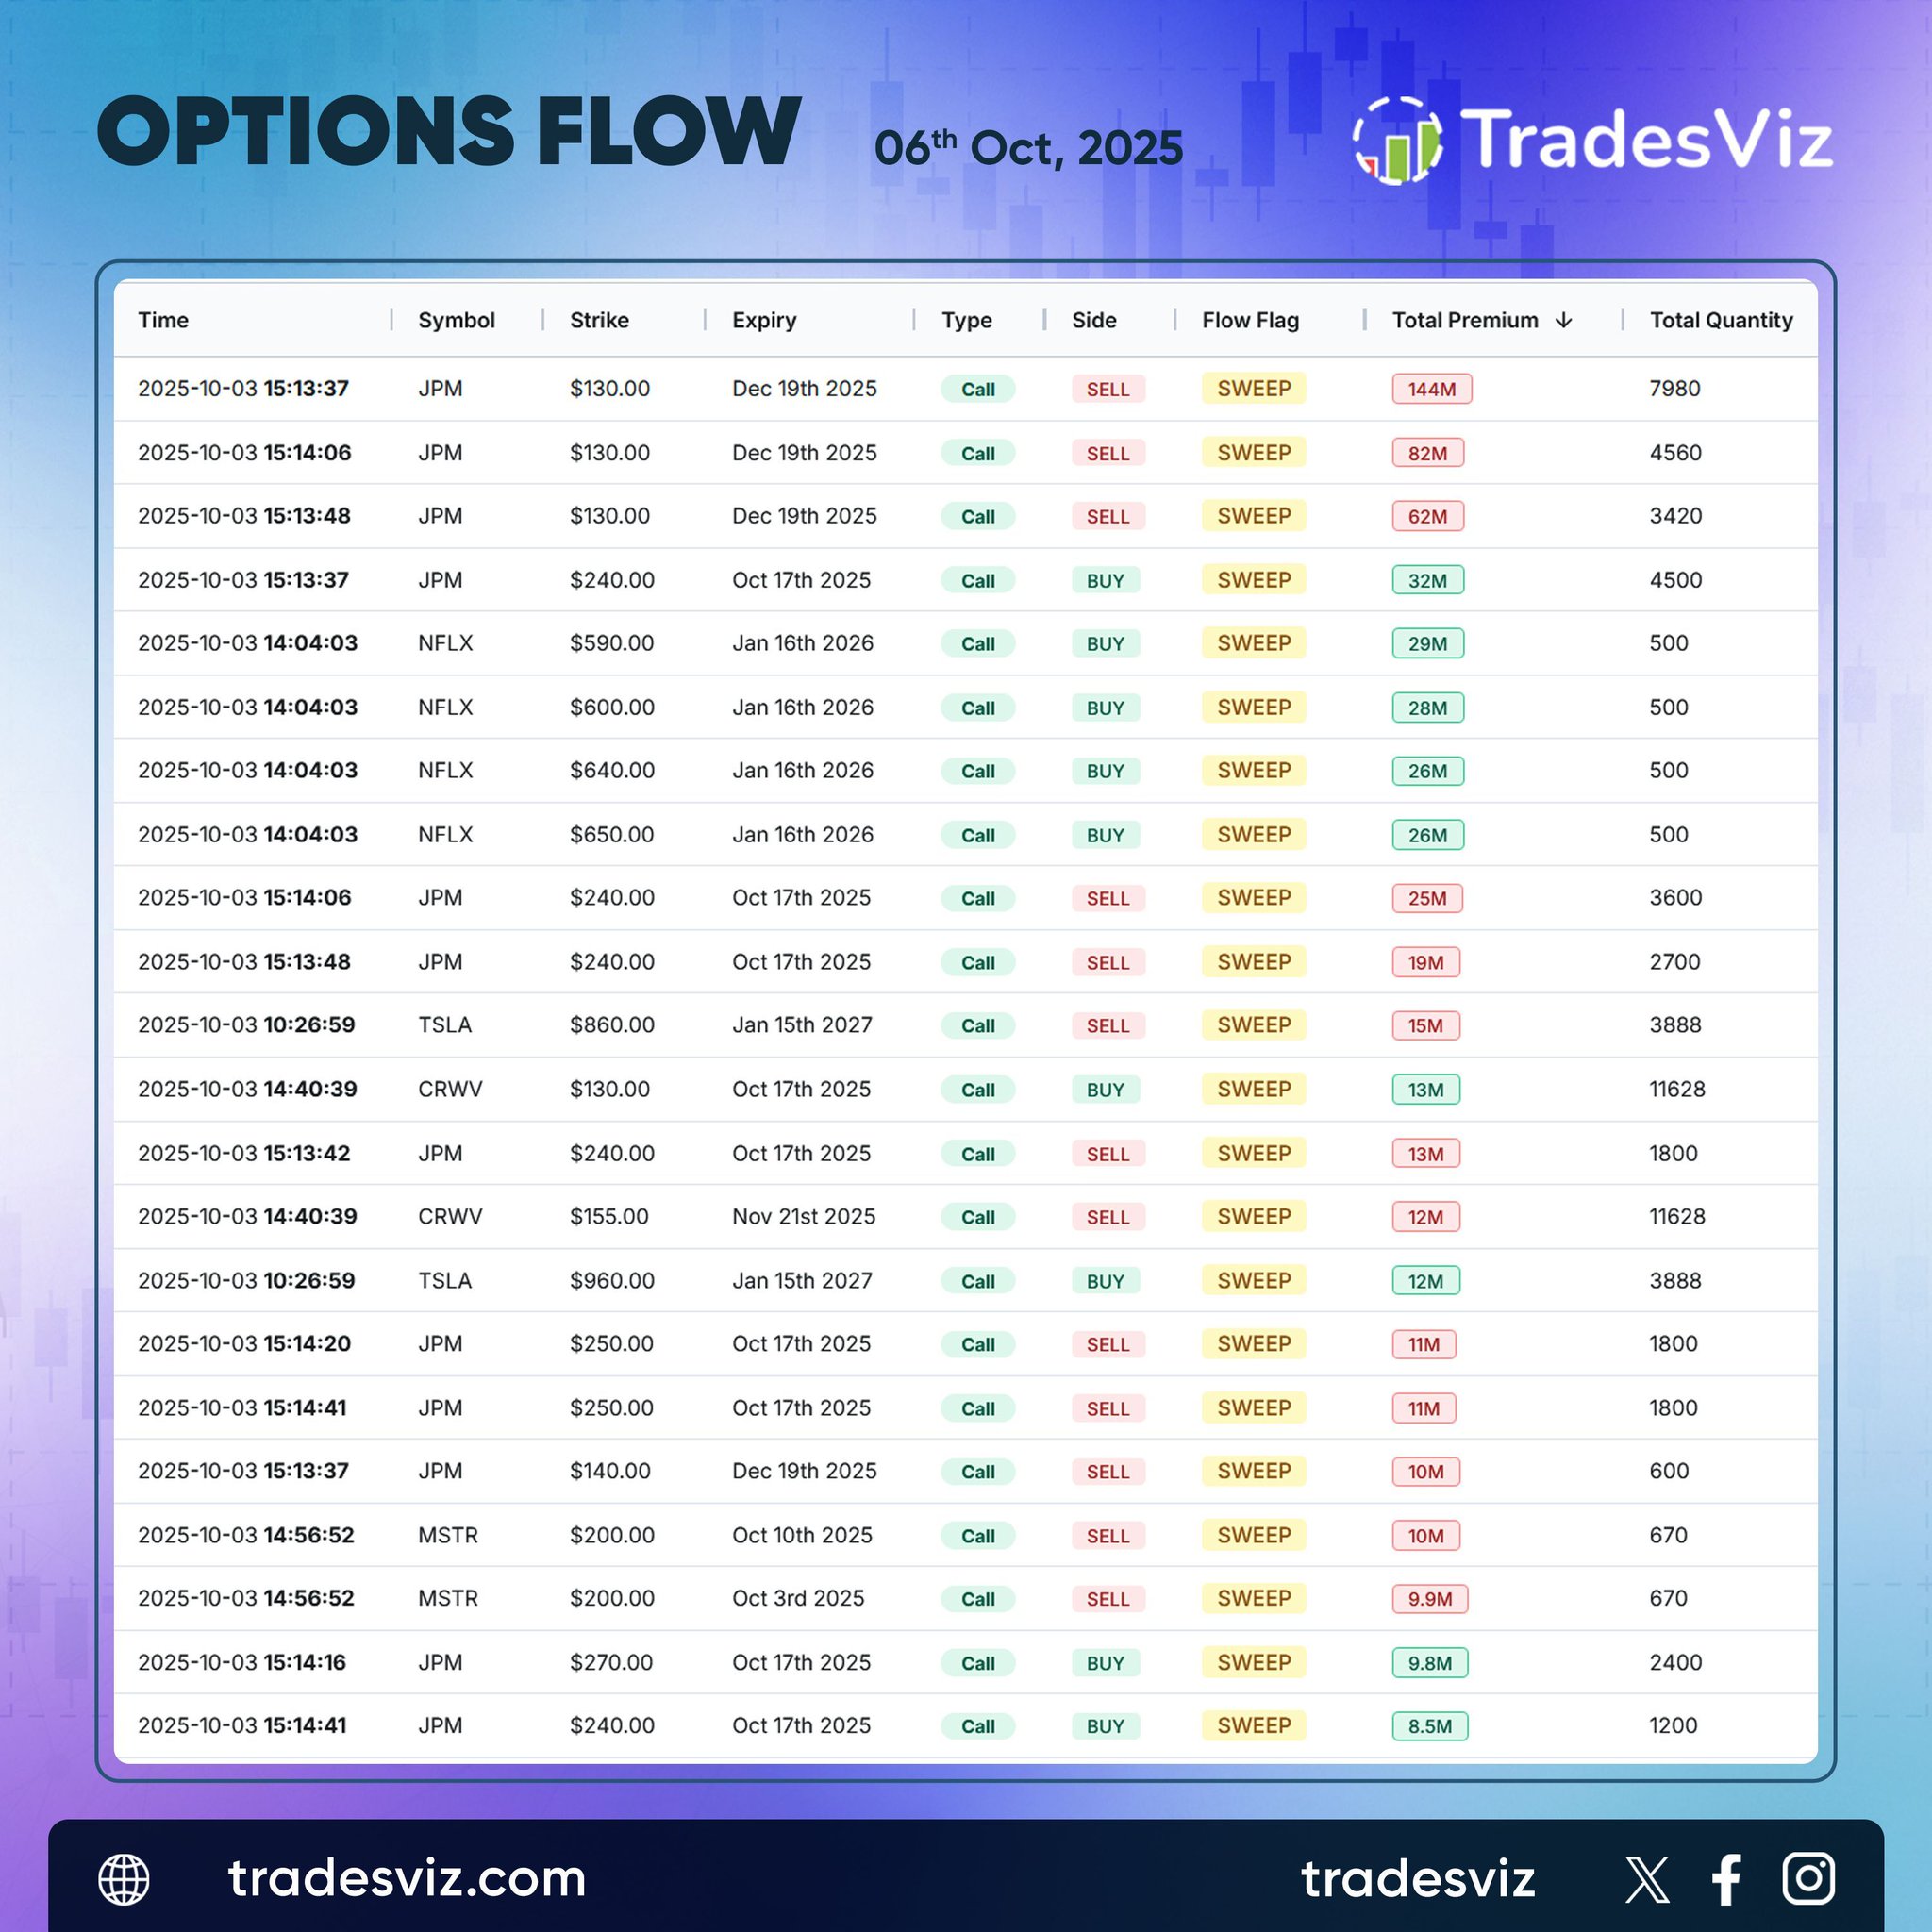
Heavy activity lit up the Oct 6 tape with  $JPM dominating flow. Over a dozen high‑notional sweeps hit both sides of the market, led by a $144M call sweep at the $130 strike for Dec ’25. Follow‑through across multiple expiries shows strong two‑way conviction.  $NFLX was the secondary standout, stacking call sweeps from $590 to $650 into Jan ’26.  $TSLA,  $CRWD, and  $MSTR also surfaced with medium‑sized call sweeps, but none matched the dollar volume seen in  $JPM.  When size concentrates in a single name across strikes and maturities, it often reflects repositioning rather than speculation.  $JPM remains the focal point on institutional radar.

User-posted image
View original post
TradesViz

TradesViz

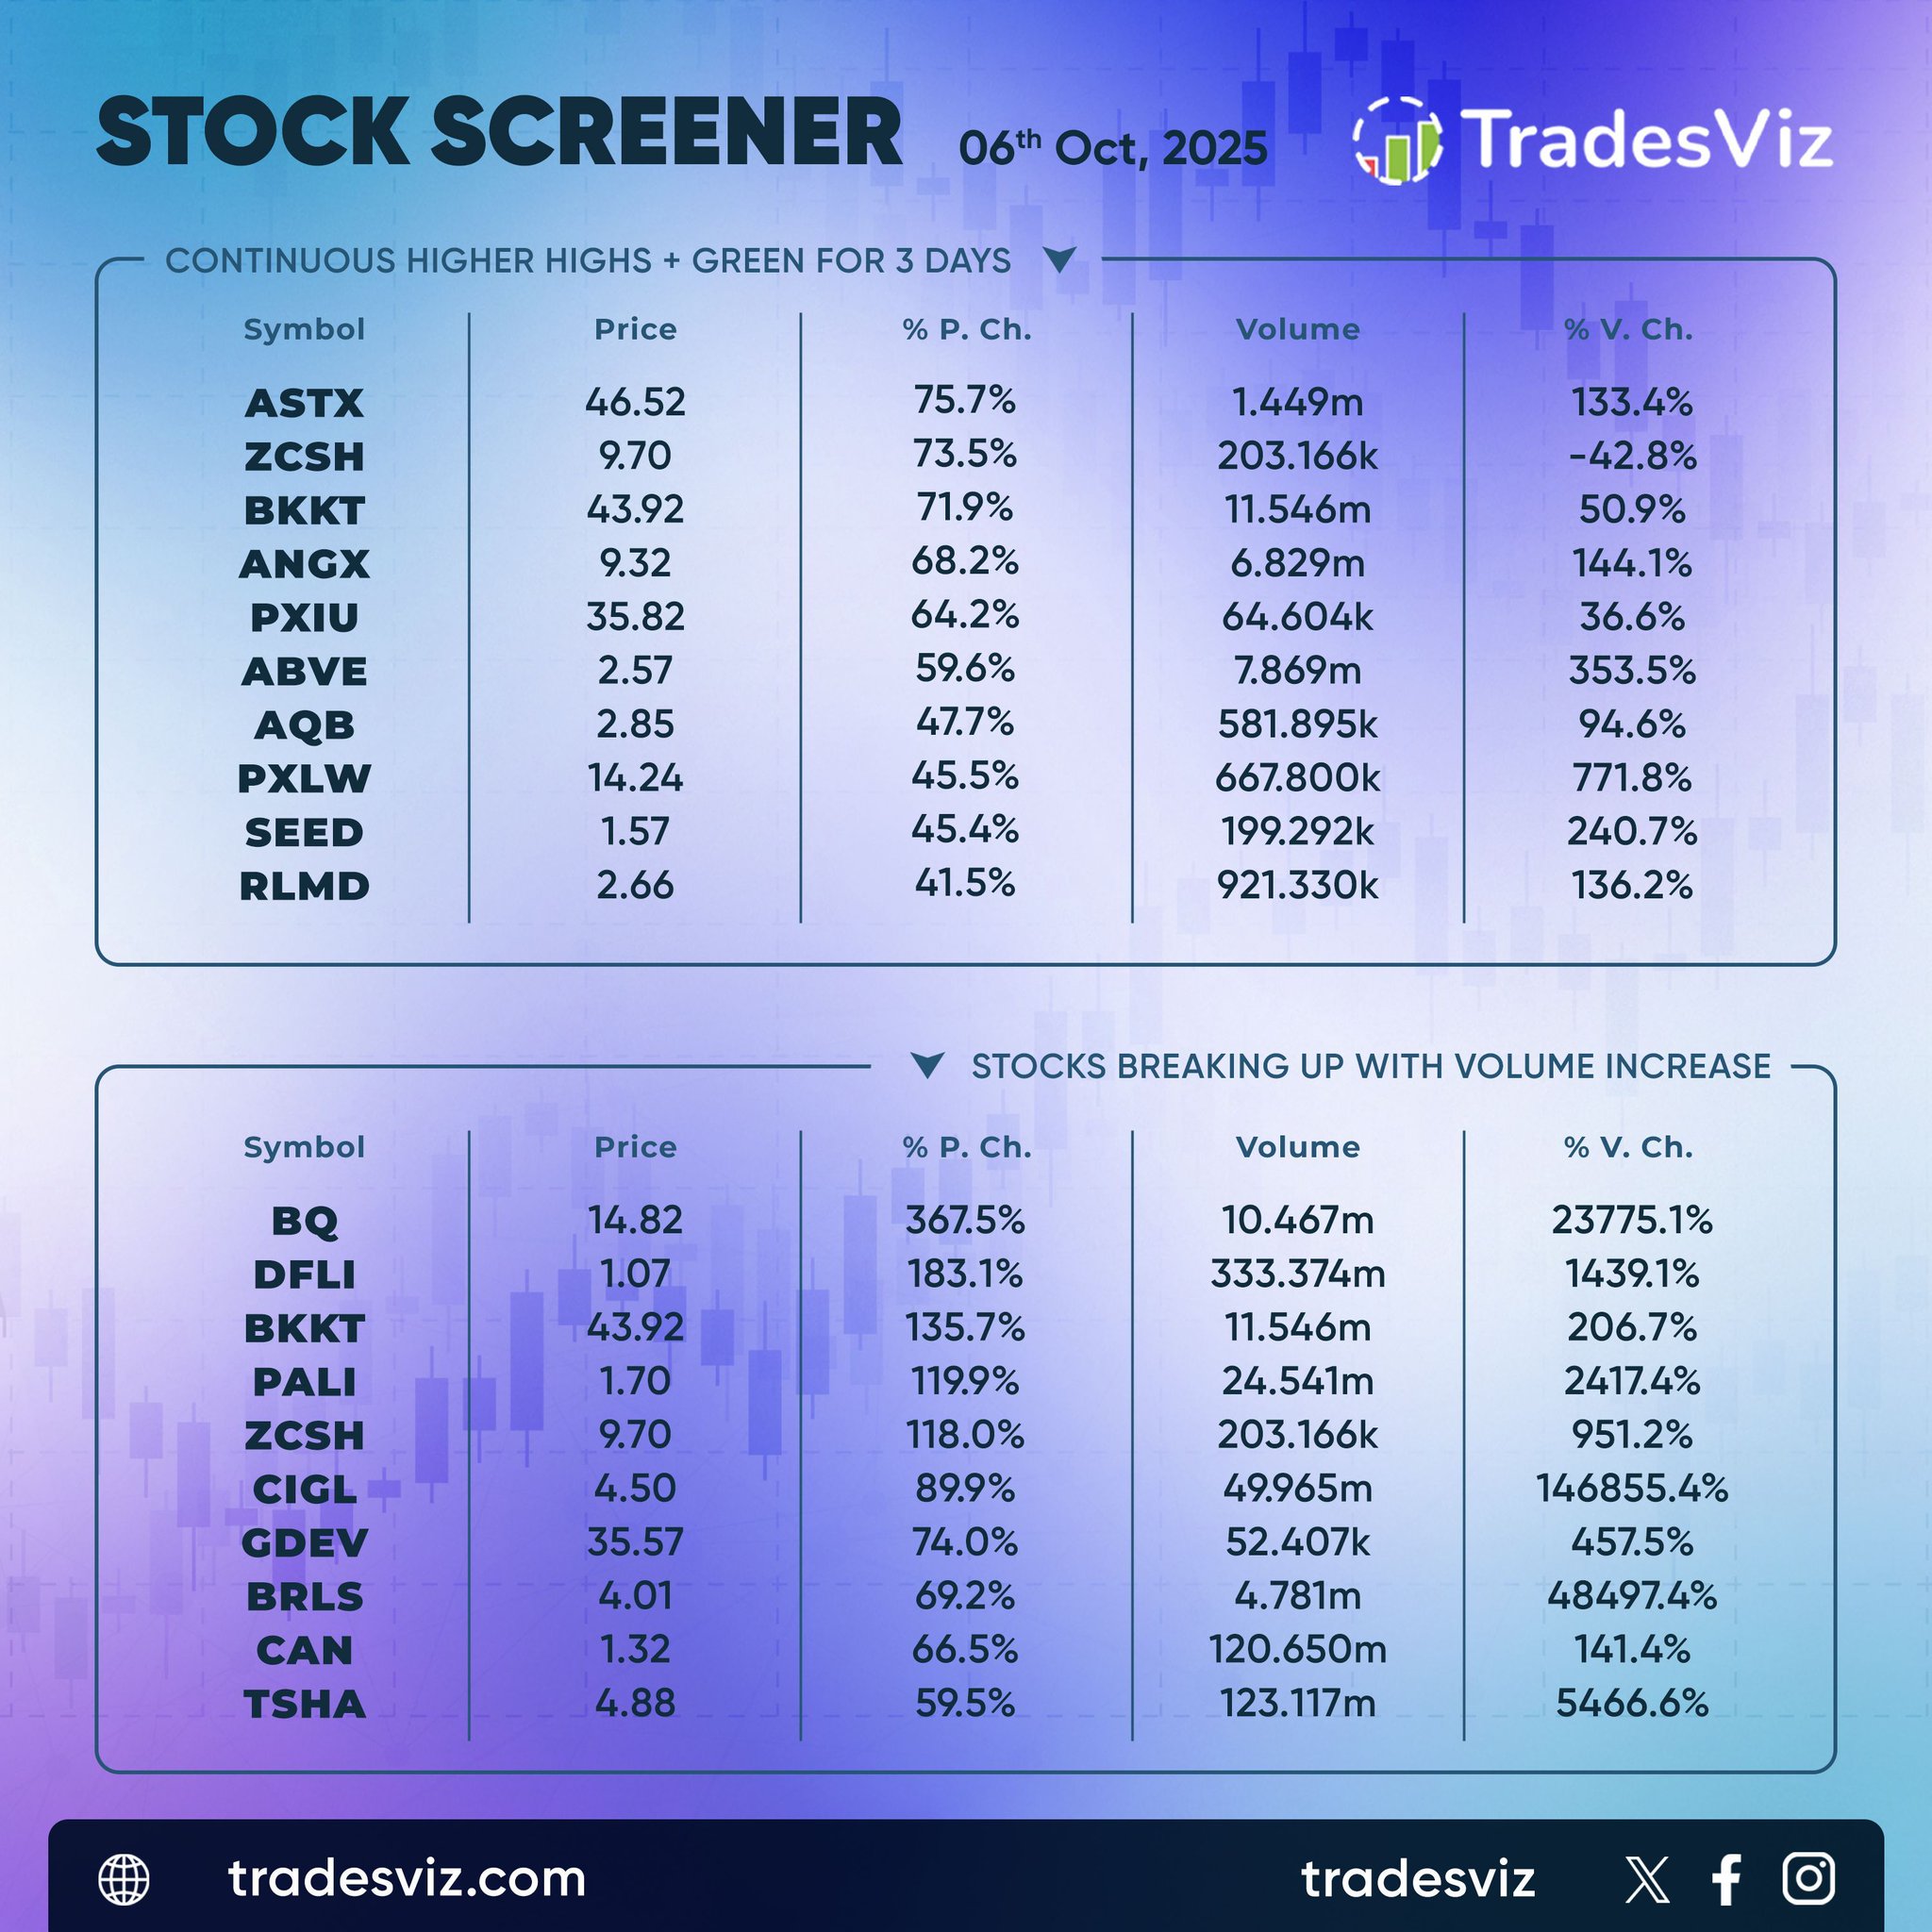
Momentum dominated the tape on Oct 6.  $ASTX,  $ZCSH, and  $BKKT led with three consecutive green sessions and steep price extensions, confirming sustained follow‑through backed by strong volume trends.  Breakout action was concentrated in  $BQ and  $DFLI, which exploded with gains of over 300% and 180% respectively as volume surged at extreme multiples of prior averages.  When price and volume expand in tandem, it reflects conviction rather than short‑term noise. These setups remain firmly on the radar as strength clusters in momentum names.

User-posted image
View original post
TradesViz

TradesViz

Weekly reminder not to get confused between the 3: These are ALL available in TradesViz - the only journal to have all of this under one roof! Backtesting: Fixed automated strategy testing on one or many symbols at once Simulation: Manual execution of trades in historical charts (bar by bar/second-by-second) Replay: No-action replay of all your executions

View original post
TradesViz

TradesViz

Are you prepared for the coming week? 🤓 This video shows a quick list of things you can do on TradesViz trading journal to up your prep: 1. Visit day explore 2. Add tags on what type of day you think it's going to be 3. Check screener 4. Add charts/watchlist 5. Create trade plans All this in less than 90 seconds ⏲️

User-posted image
View original post
TradesViz

TradesViz

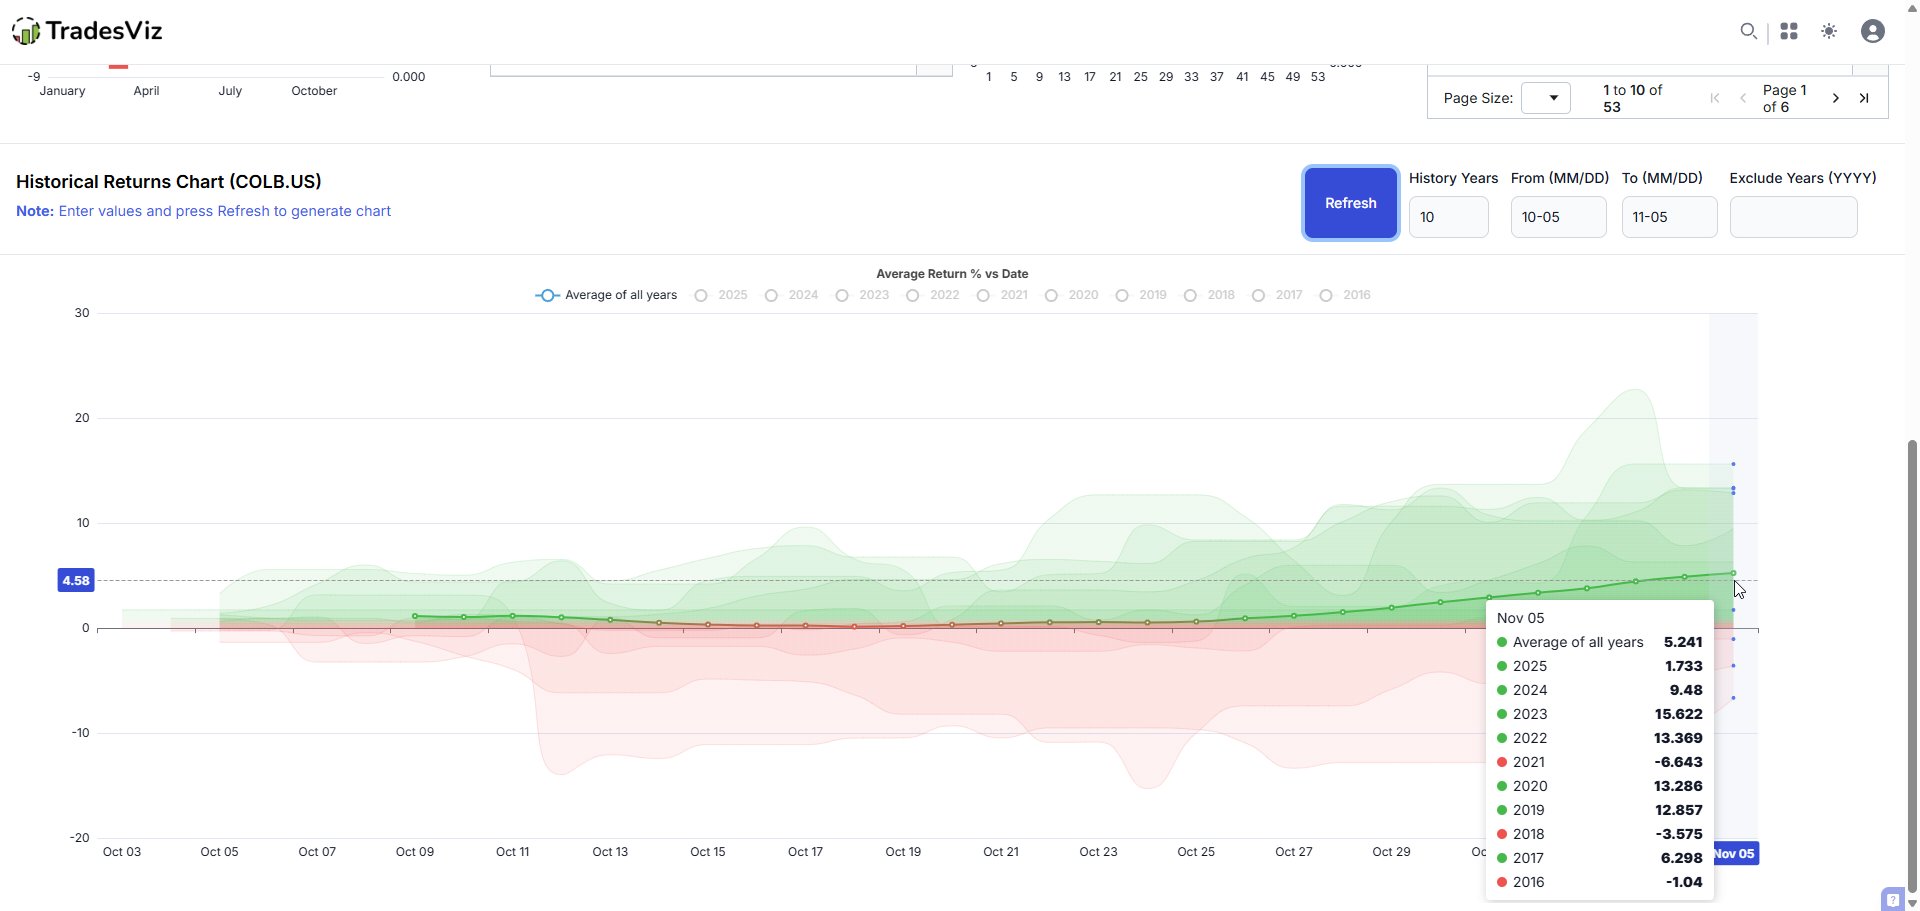
That's one very interesting seasonality returns chart. Check the average return in dark green in the middle 👀 $COLB: Columbia Banking System Inc Where'd we find this? TradesViz's seasonality practice mode. There's also practice mode for fundamentals and trading simultor 🎲

User-posted image
View original post
TradesViz

TradesViz

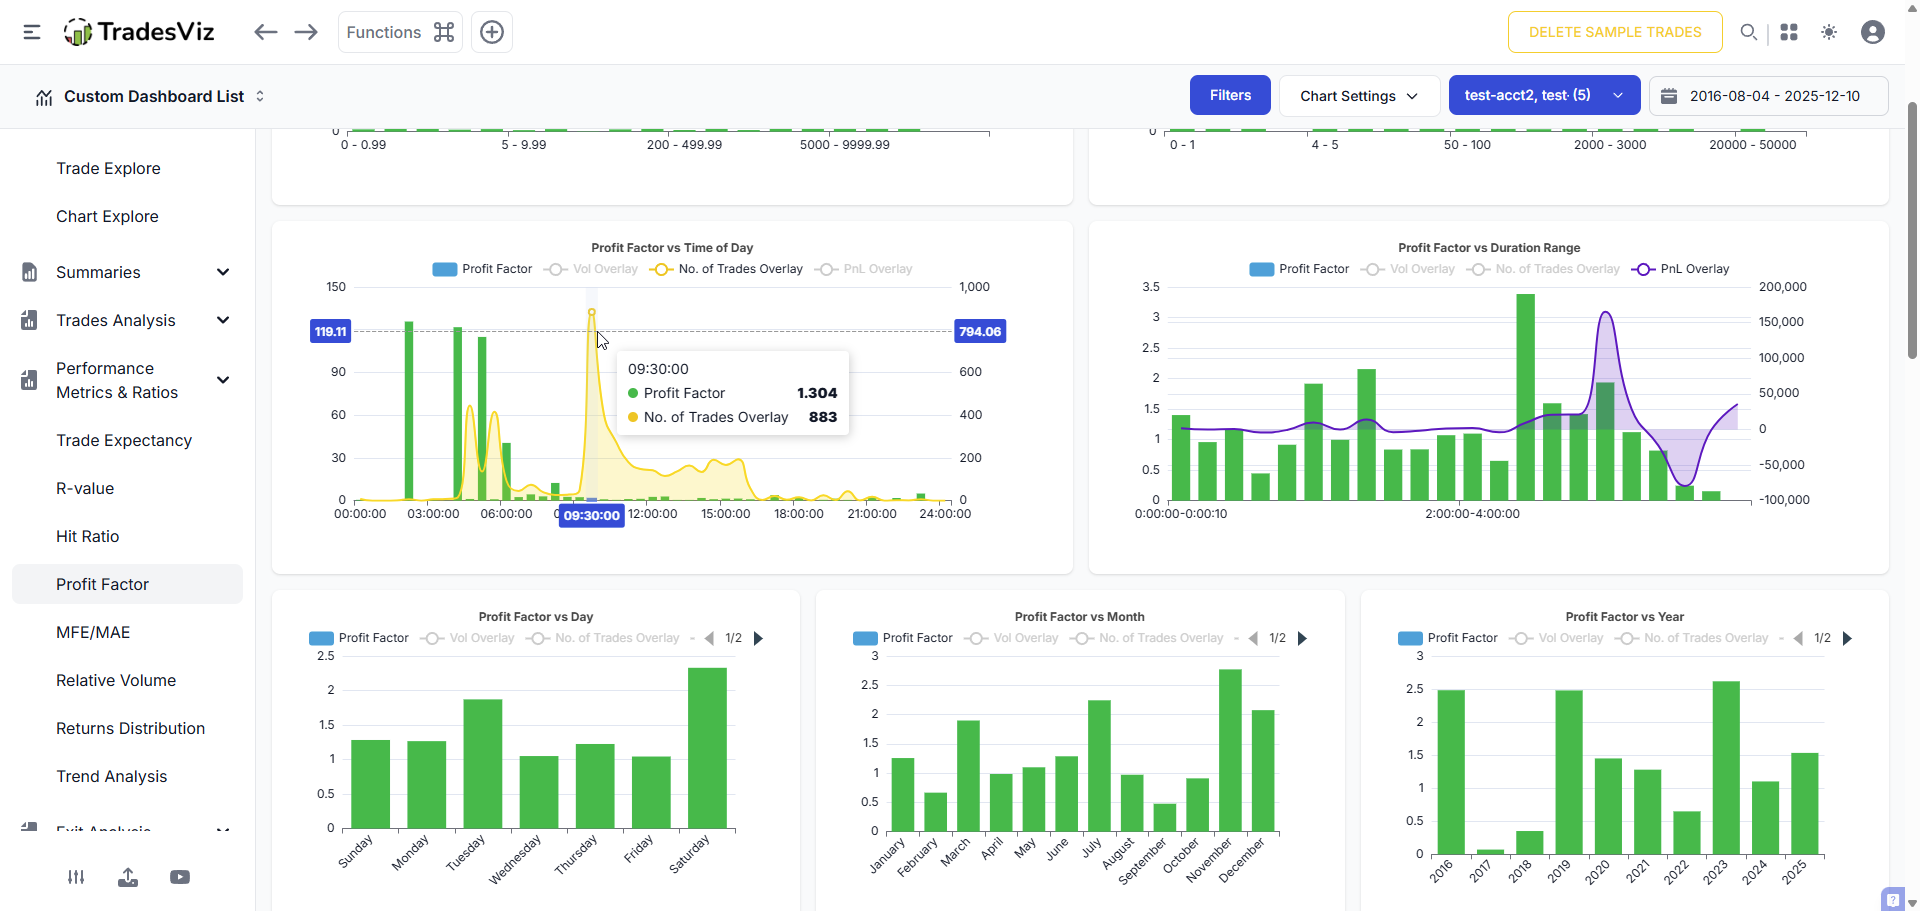
TradesViz chart of the day: R-value charts w/ no. of trades and pnl overlay. ❓ Why is this useful? 1. A higher R-value is nice, but at what cost? 2. Is your trade volume focused on the right time? 3. Are your highest effort trades yielding max effort? Chk this screenshot👇

User-posted image
View original post