
TradesViz
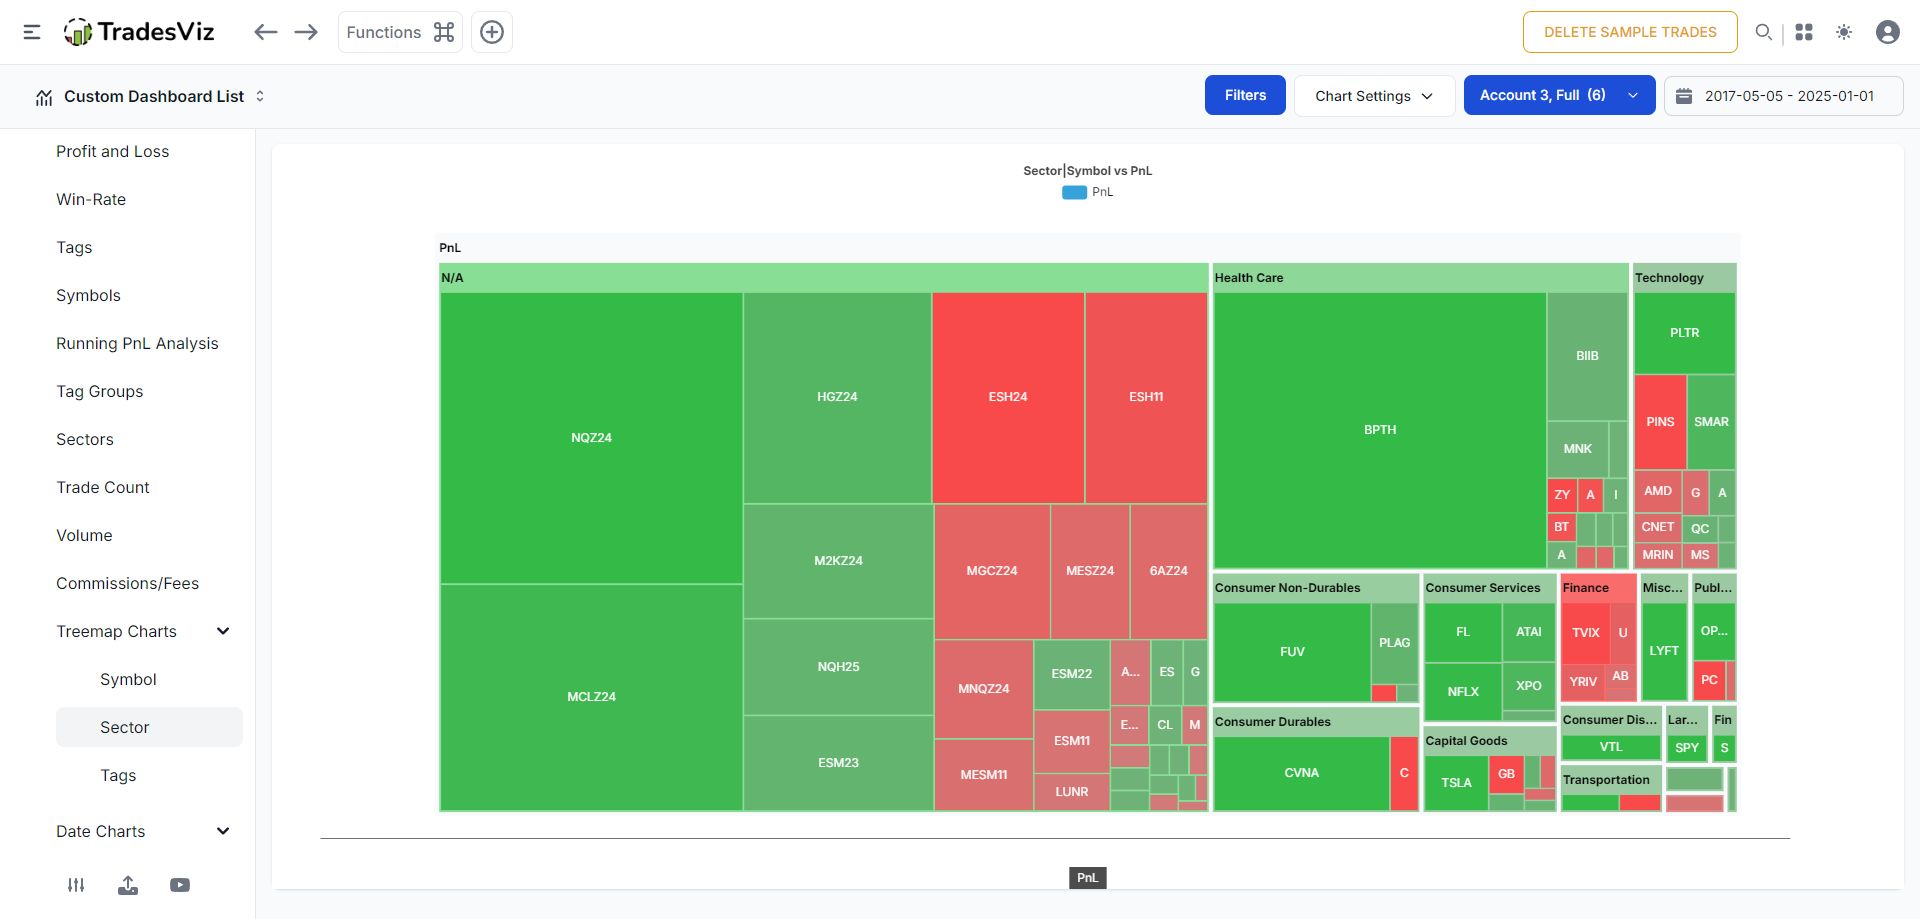
Zoom into your strengths. 📊 Treemaps in TradesViz help you visually decode your PnL, volume, and duration — broken down by
TradesViz
Zoom into your strengths. 📊 Treemaps in TradesViz help you visually decode your PnL, volume, and duration — broken down by
TradesViz
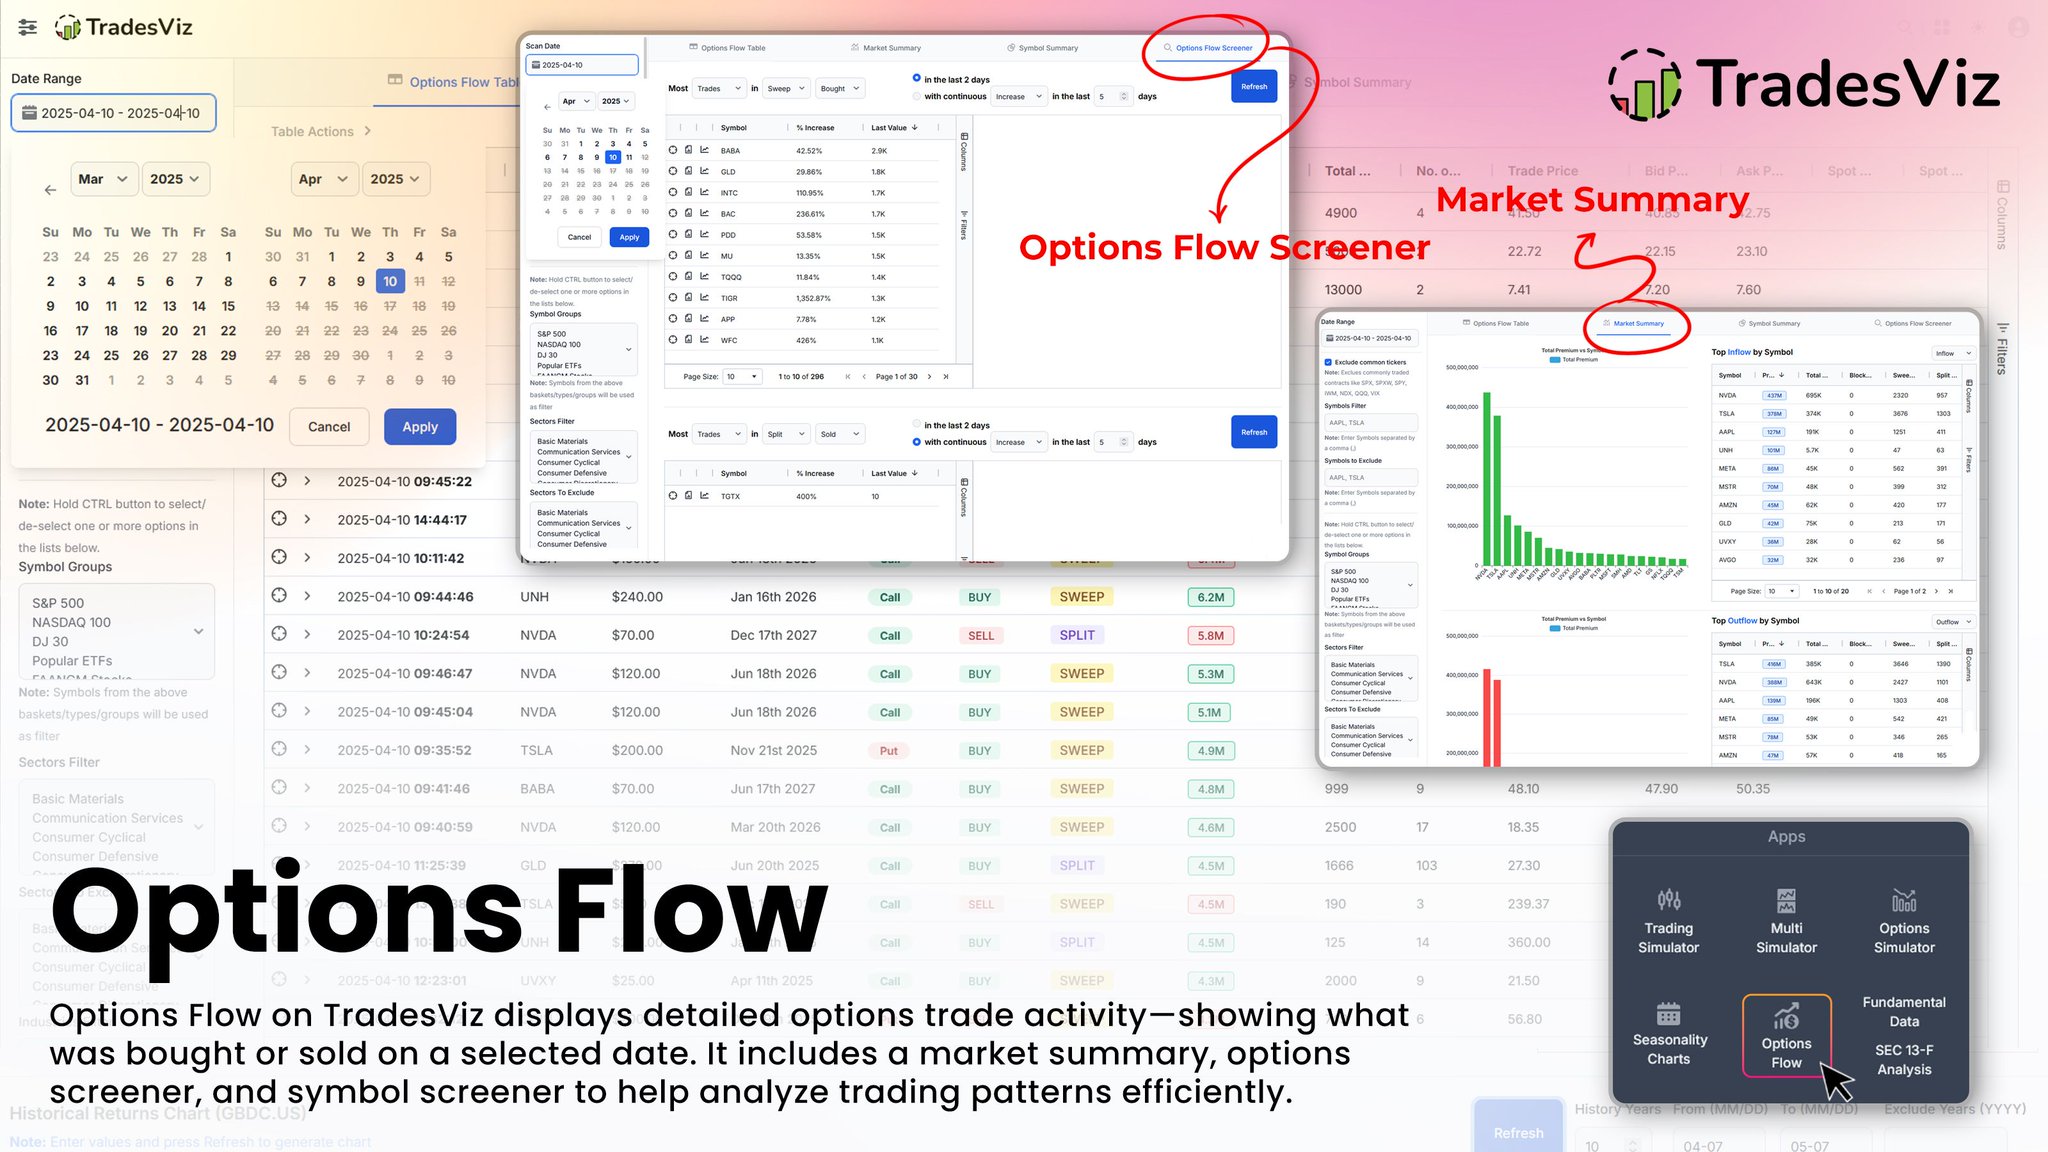
Options Flow on TradesViz isn’t just about tracking trades — it’s about understanding intent. 🧠💥 Who’s buying? Who’s selling? When are they striking? How big are the bets? Every sweep, split, and block trade — visualized across sectors, symbols, and time. You get: 🔎 Detailed…
TradesViz
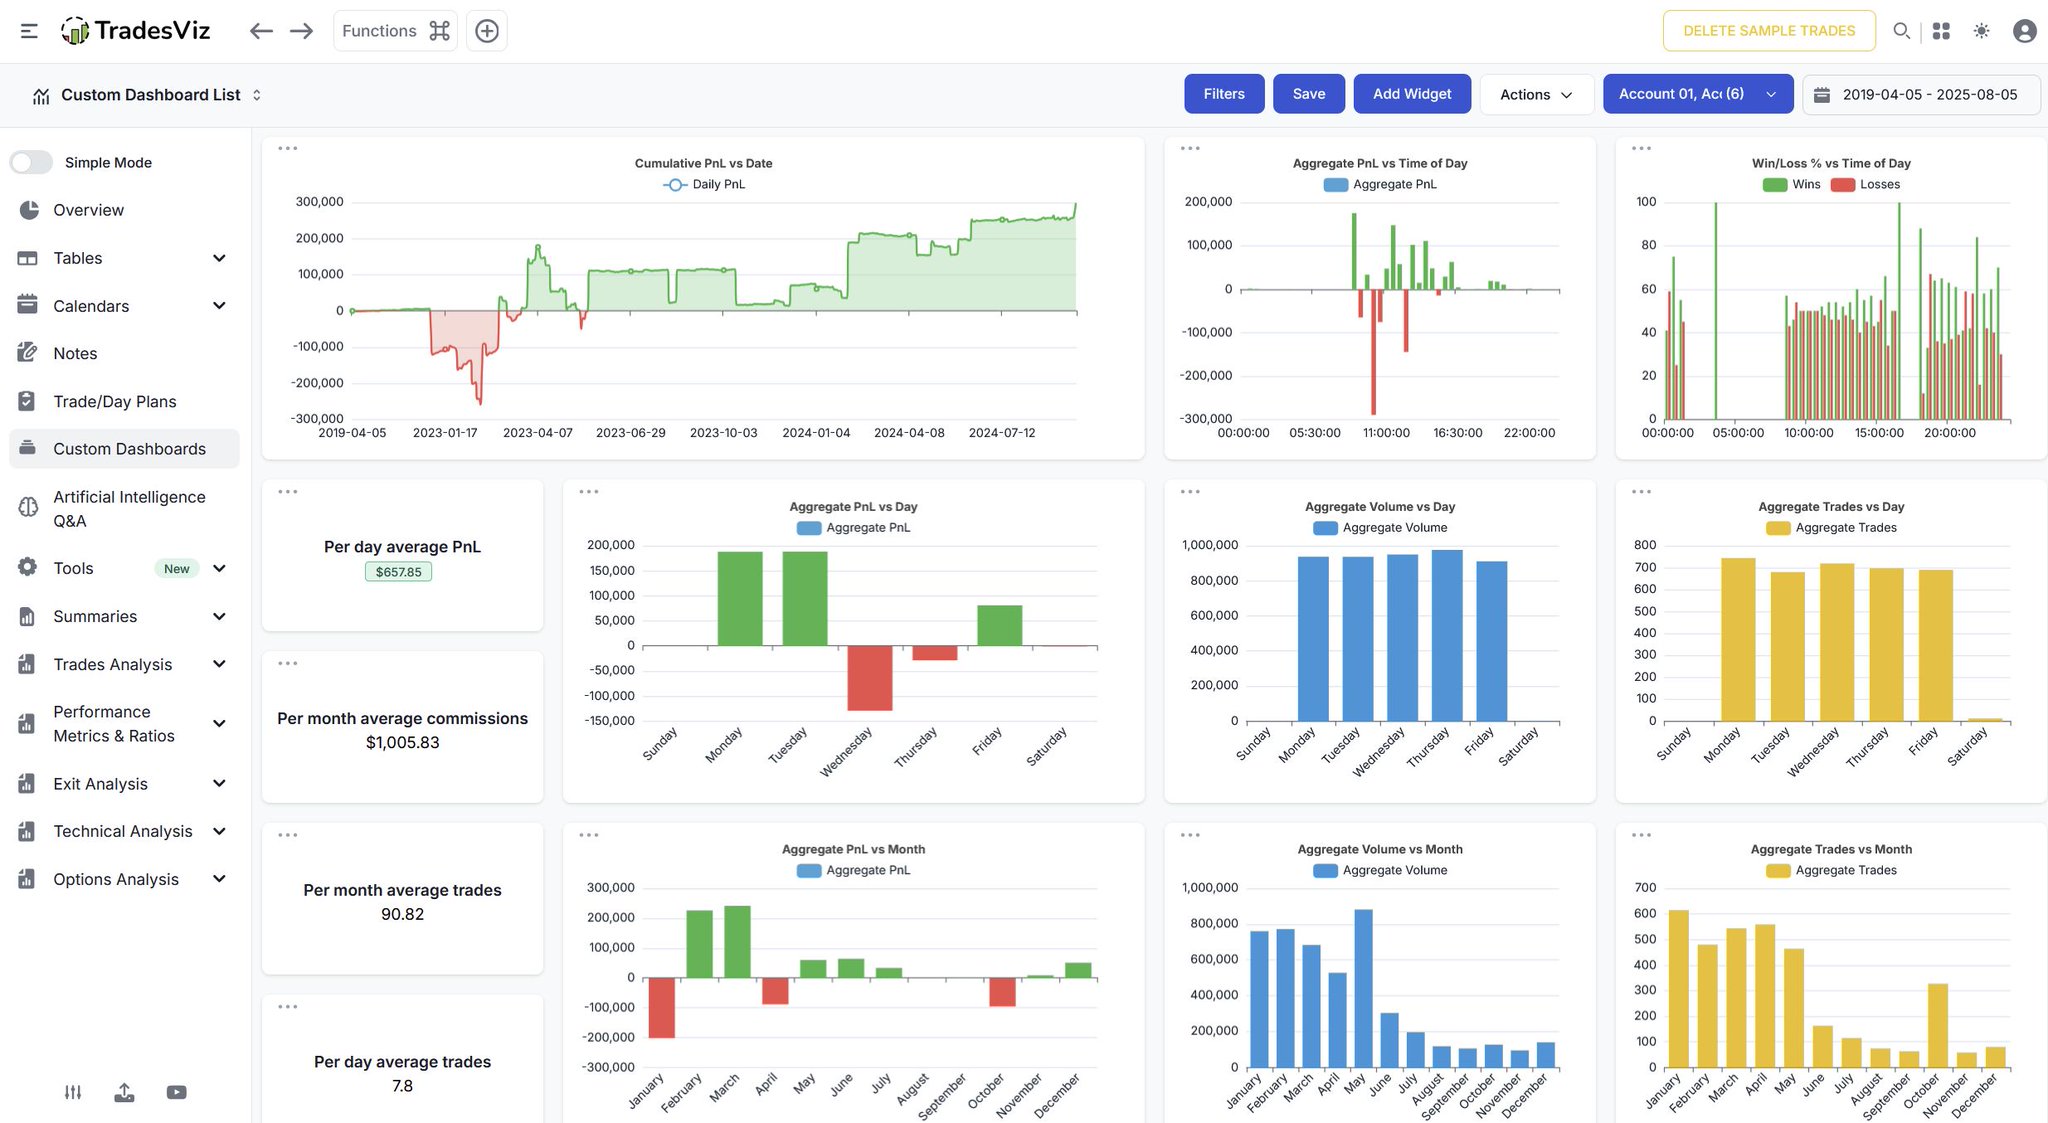
Your month-by-month trading story — visualized. 📊 From PnL swings to volume spikes, this custom dashboard lays it all out: 💰 Which months made you money 📉 Where commissions hurt 📆 What days bring your edge ⏰ Even time-of-day win/loss trends! This isn’t just stats — it’s…
TradesViz
Volume surging. Prices popping. Breakouts everywhere. 🚀 $SNGX up 143% with insane 99,784% volume spike 😳 $BTBD, $COMM, $BTAI — not far behind. This isn’t retail noise — this is smart money trailblazing. And if you’re tracking momentum… $RDTL, $ANTE, $ACUT are green for 3 days…

TradesViz
Most of the action? Sweeps. Most of them? SOLD. 😤 And in just the last 2 days. $SNAP, $TDOC, $UBER — seeing explosive % spikes in flow. But keep your eyes on $PLTR — 146% jump and flow chart lighting up like it’s earnings encore time. 📈🔥 Options traders aren’t just active —…

TradesViz
Options flowing fast? 🚦📈 Spotlight on today’s biggest options moves—see where the big premiums and high-volume action are happening, from

TradesViz
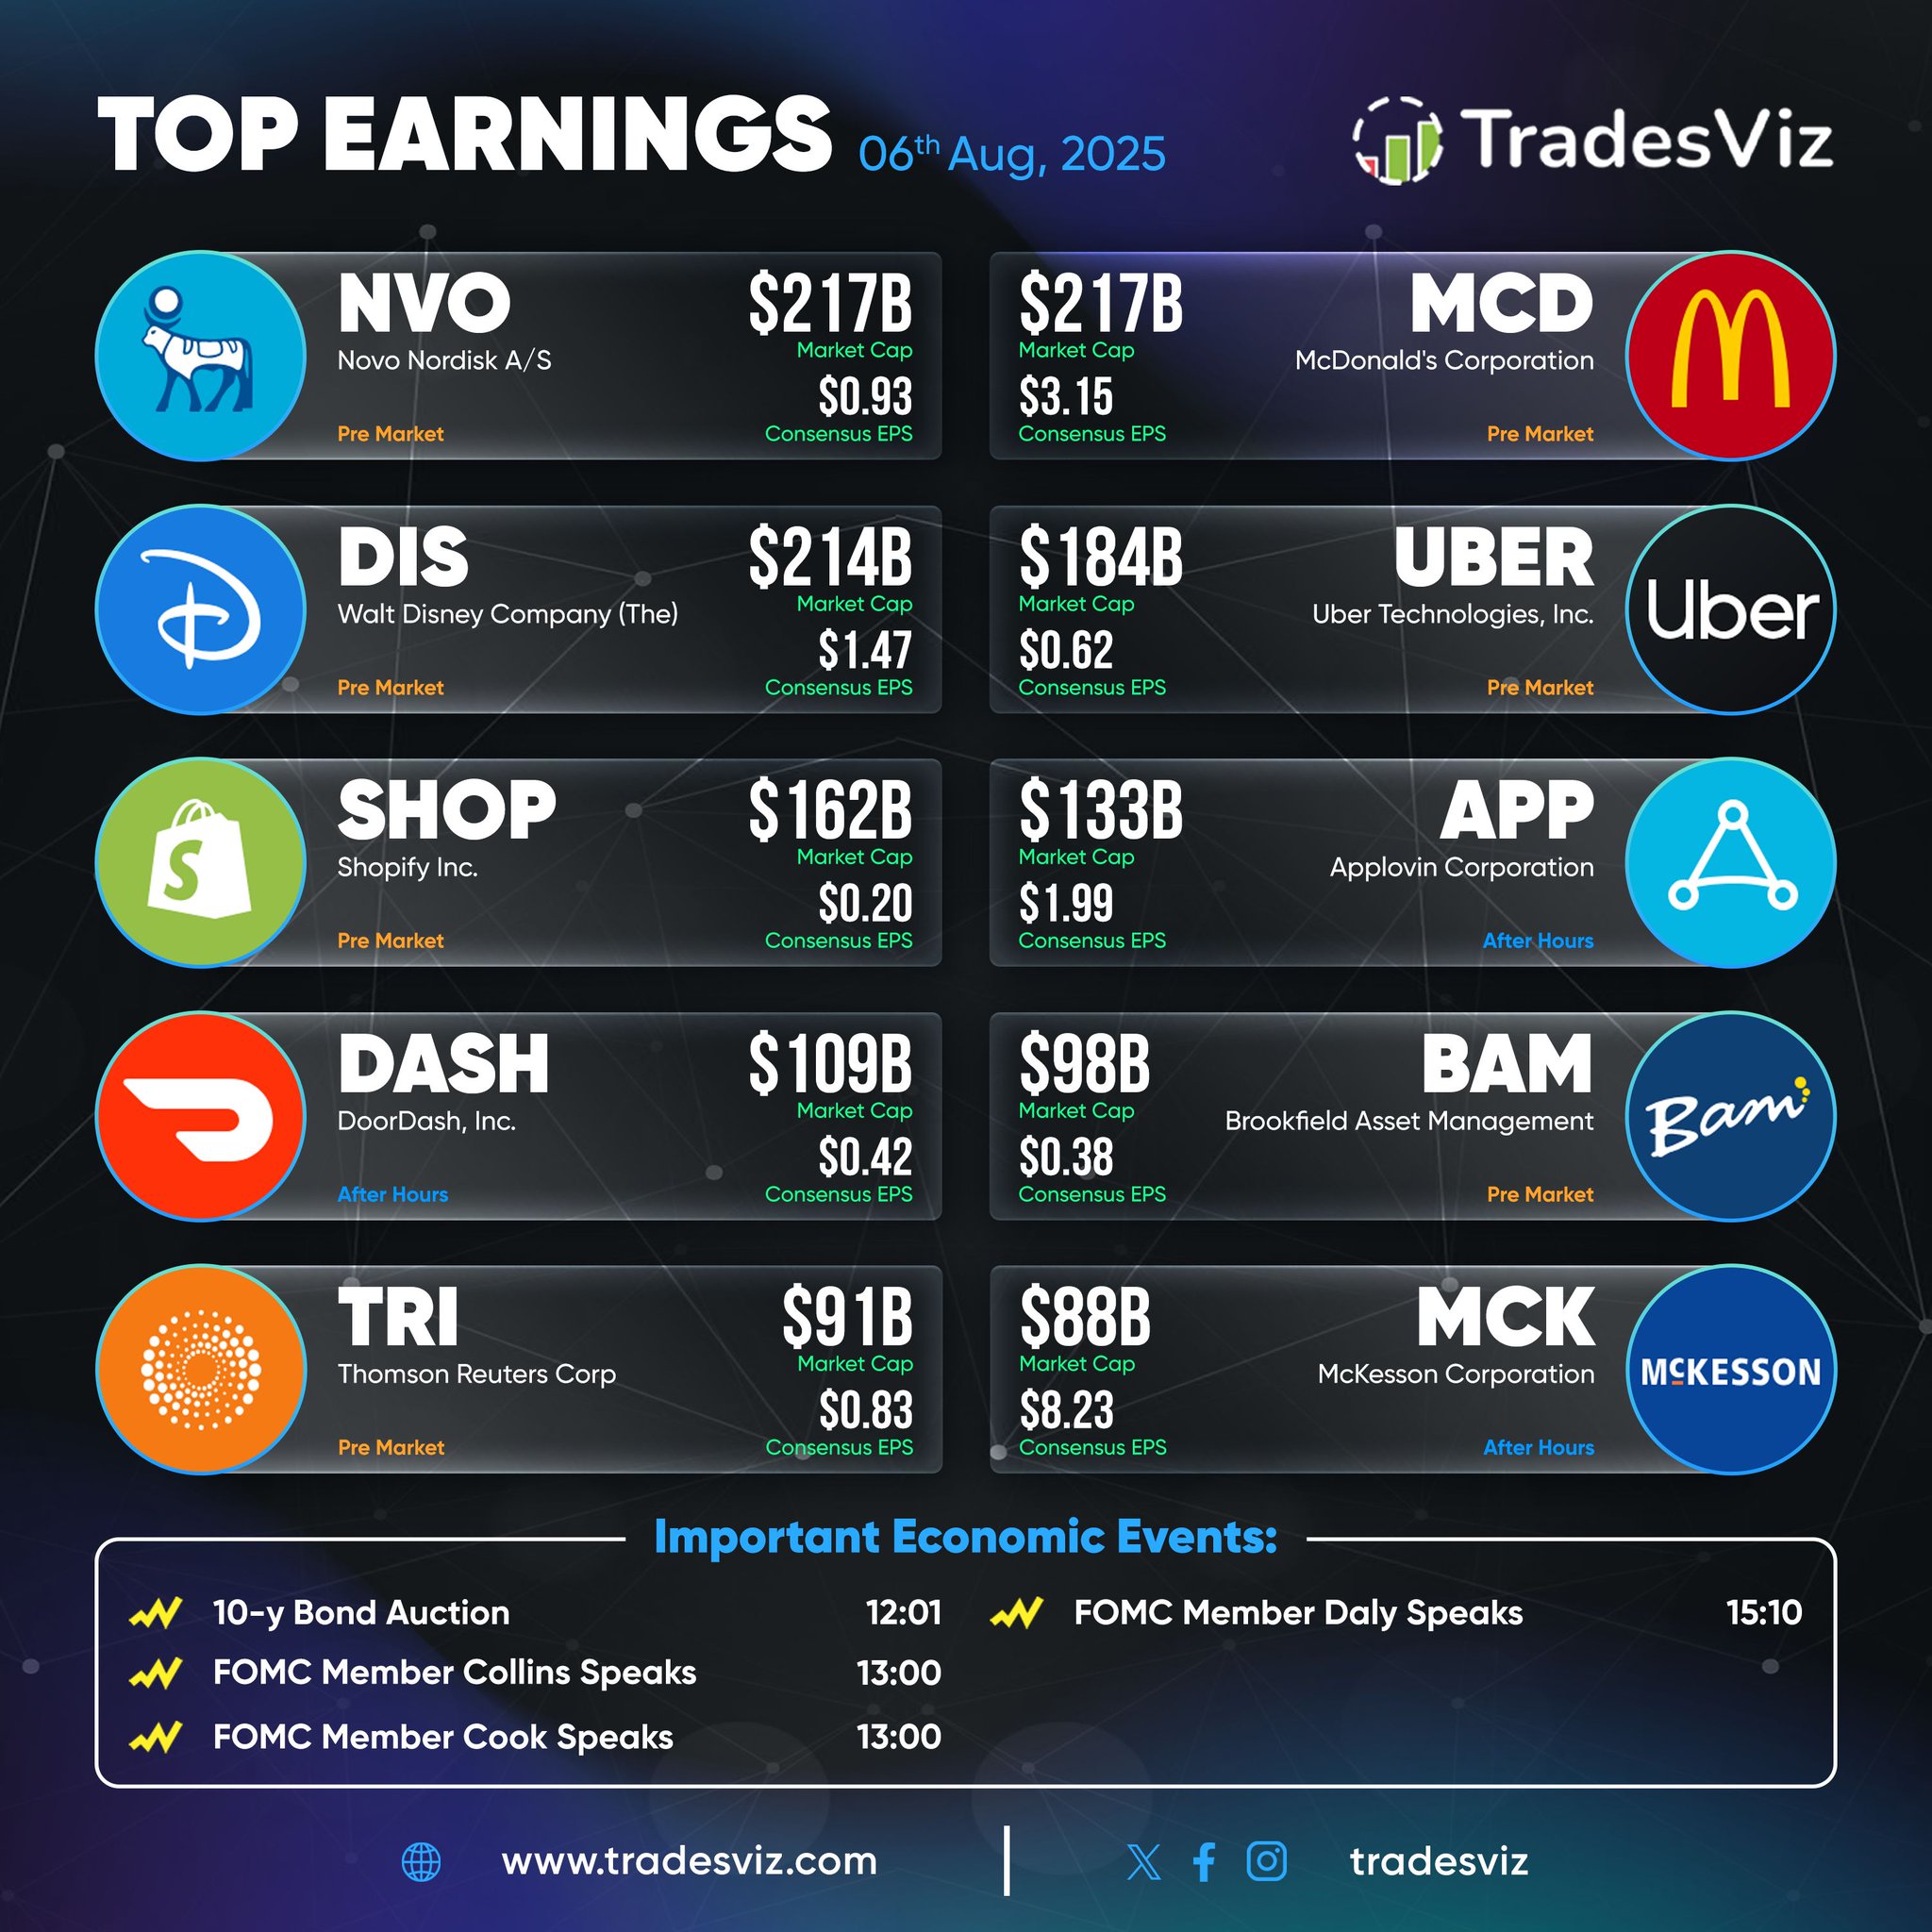
Top 10 earnings to watch today! 📅💥 TradesViz brings you the latest updates from heavy hitters like
TradesViz
At TadesViz, it's not just about the amount of stats. In fact, that's a (positive) side effect of how flexible the entire dashboard is. Here's an example of variations of a single tab. Each variation has a meaning. Is price vs pnl useless if you trade just 1 symbol? Nope. Is…
View original post
TradesViz

TradesViz
Trying to pick the best tool for your trading journey? 🎯 Here’s what sets TradesViz apart—unlimited AI-powered charts, in-depth automation, and customizable dashboards, all in one powerful platform. 📊✨ No more juggling multiple subscriptions. Get backtesting, trade journals,…
