Which version of your strategy is actually working? 📉
You might trade five different chart patterns, but are they all worth your capital?
The Tag Group Statistics dashboard acts as a leaderboard for your strategies.
It instantly highlights your "Top PnL" performers against your "Bottom PnL" bleeders.
If your "M-FORM" group has a 50% win rate but is still red on PnL, you have a risk/reward issue, not a win-rate issue. Diagnose the specific leak. Fix the system.
There is no "one-size-fits-all" in trading.
So why do other journals force you into their rigid "Performance Meters"? 🚫
A metric that works for a scalper is useless for a swing trader.
At TradesViz, we reject the made-up stats. We give you a canvas:
Digitise YOUR specific psychology, not a generic "mood."
😒 Stop trying to fit your round peg into their square hole.
Build your own journal. 🏗️
Your strategy might be winning, but your exits are losing. 🚪
Most traders abandon a strategy because the P&L is flat. But what if the entries are actually perfect? This simulator answers the ultimate question:
"What if I had used a static 177 tick Stop and 118 tick Target?" In this example, the difference is staggering.
❌ Original Result: A flat struggle ending at $74.85.
✅ Simulated Result: A massive parabolic move to $17,237.95.
The trades were the same. The management was the difference. Unlock the hidden profit in your existing data.
Stop guessing your yield. Measure it. 🌾
If you are selling Cash-Secured Puts or running the Wheel Strategy, you aren't just trading; you're generating income.
This dashboard calculates your Weighted Avg APY instantly (7.53% in this example) so you know exactly how hard your money is working.
Don't settle for "collecting premium." Aim for a specific annualized return.
Track the ROI. Optimize the yield.
Stop trading in the dark. It’s time to level up. 🚀
Your broker gives you a P&L. We give you a roadmap.
✅ TradesViz is the all-in-one command center designed to help you Track & Refine Performance with surgical precision.
From our advanced Multi-Chart Simulators that let you practice risk-free, to powerful tools that Identify strengths across strategies & accounts, we provide the data you need to grow.
Don't just place trades. Master them. 🔥
When you have clear charts with your trades on them, easy & flexible UI for journaling and anlaysis, your journal becomes your pillar of support 🏦
🔖 Learn from your data and grow every day with TradesViz.
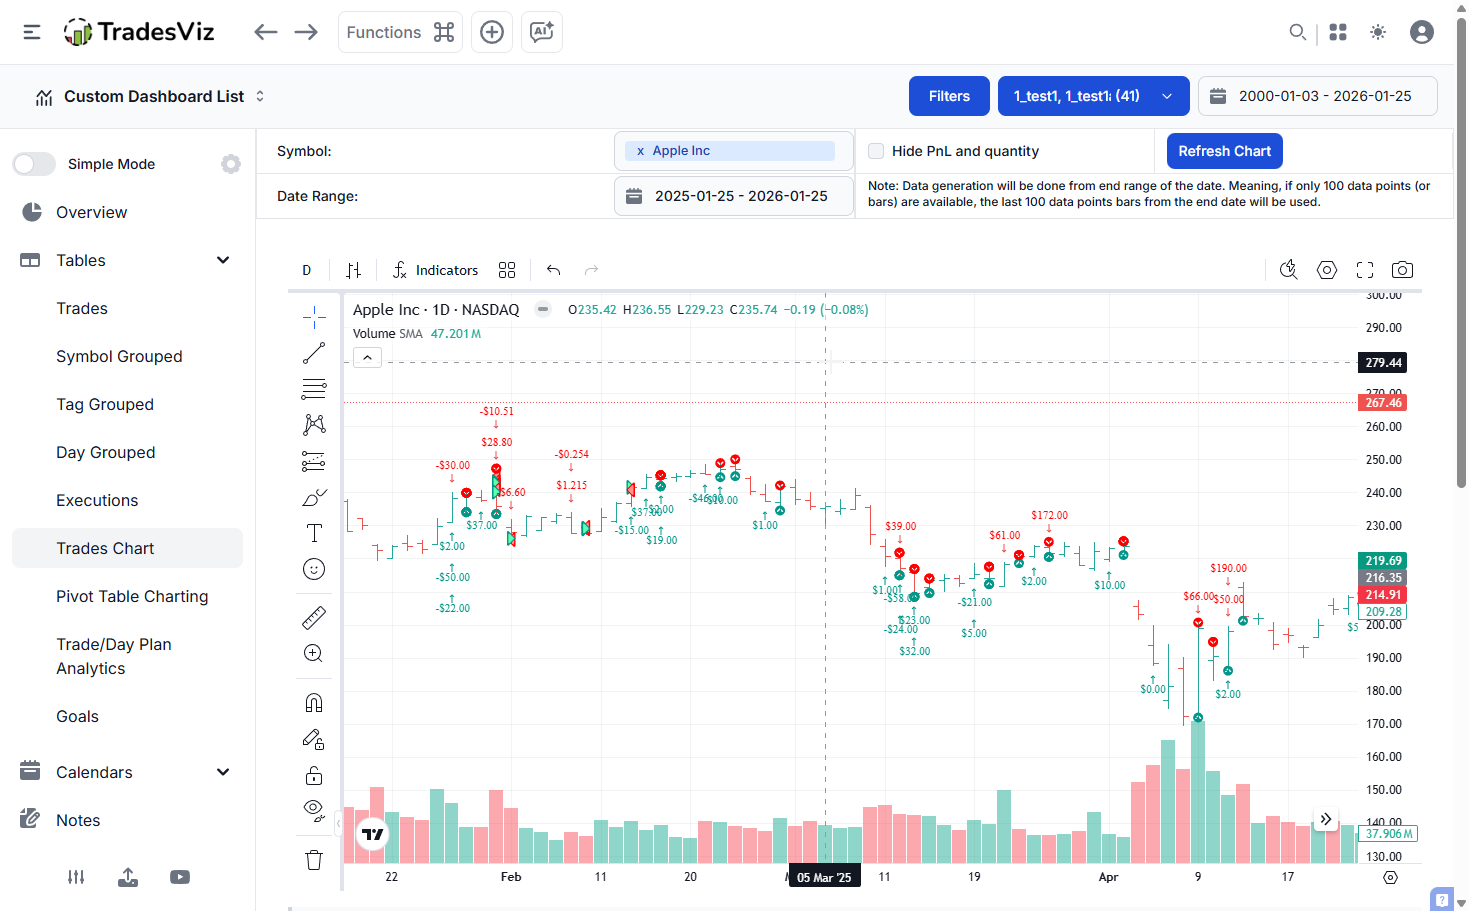
$AAPL trades on the trades chart view👇
Stop learning code. Start asking questions. 🗣️
Your trading journal holds the answers, but usually, they are buried in spreadsheets.
With AI Query and AI Trade Chat, you can access deep insights just by asking.
Look at the example in the image: The trader simply asked to "list out my top performing stocks," and the AI generated a detailed, ranked list with open/close dates and profit metrics immediately.
From global financial data to your personal risk metrics, the barrier between you and the answer is now just a sentence. Ask. Analyze. Act.
Do you own the month, or does the month own you? 🗓️
A single trade can be luck. A month of trading is a track record. The Month View provides an instant visual audit of your consistency.
It’s not just about Green vs. Red; it’s about the density of the data. Look at the box for March 9th:
PnL: +$292k
Volume: 42k shares
Win Rate: 48%.
This view forces you to face the reality of your volume and win rate on a daily basis. You can’t hide a bad habit on this calendar. It shows up in bright red.
A blank page is a trader's enemy. 📝
If you don't know what to write, you won't journal consistently. Use the "Note Template" dropdown to instantly apply a pre-built structure to your session review.
✅ Pre-Market Plan
✅ Mental State
✅ Top Mistakes
Don't start from scratch every day. Click Apply, fill in the blanks, and move on.