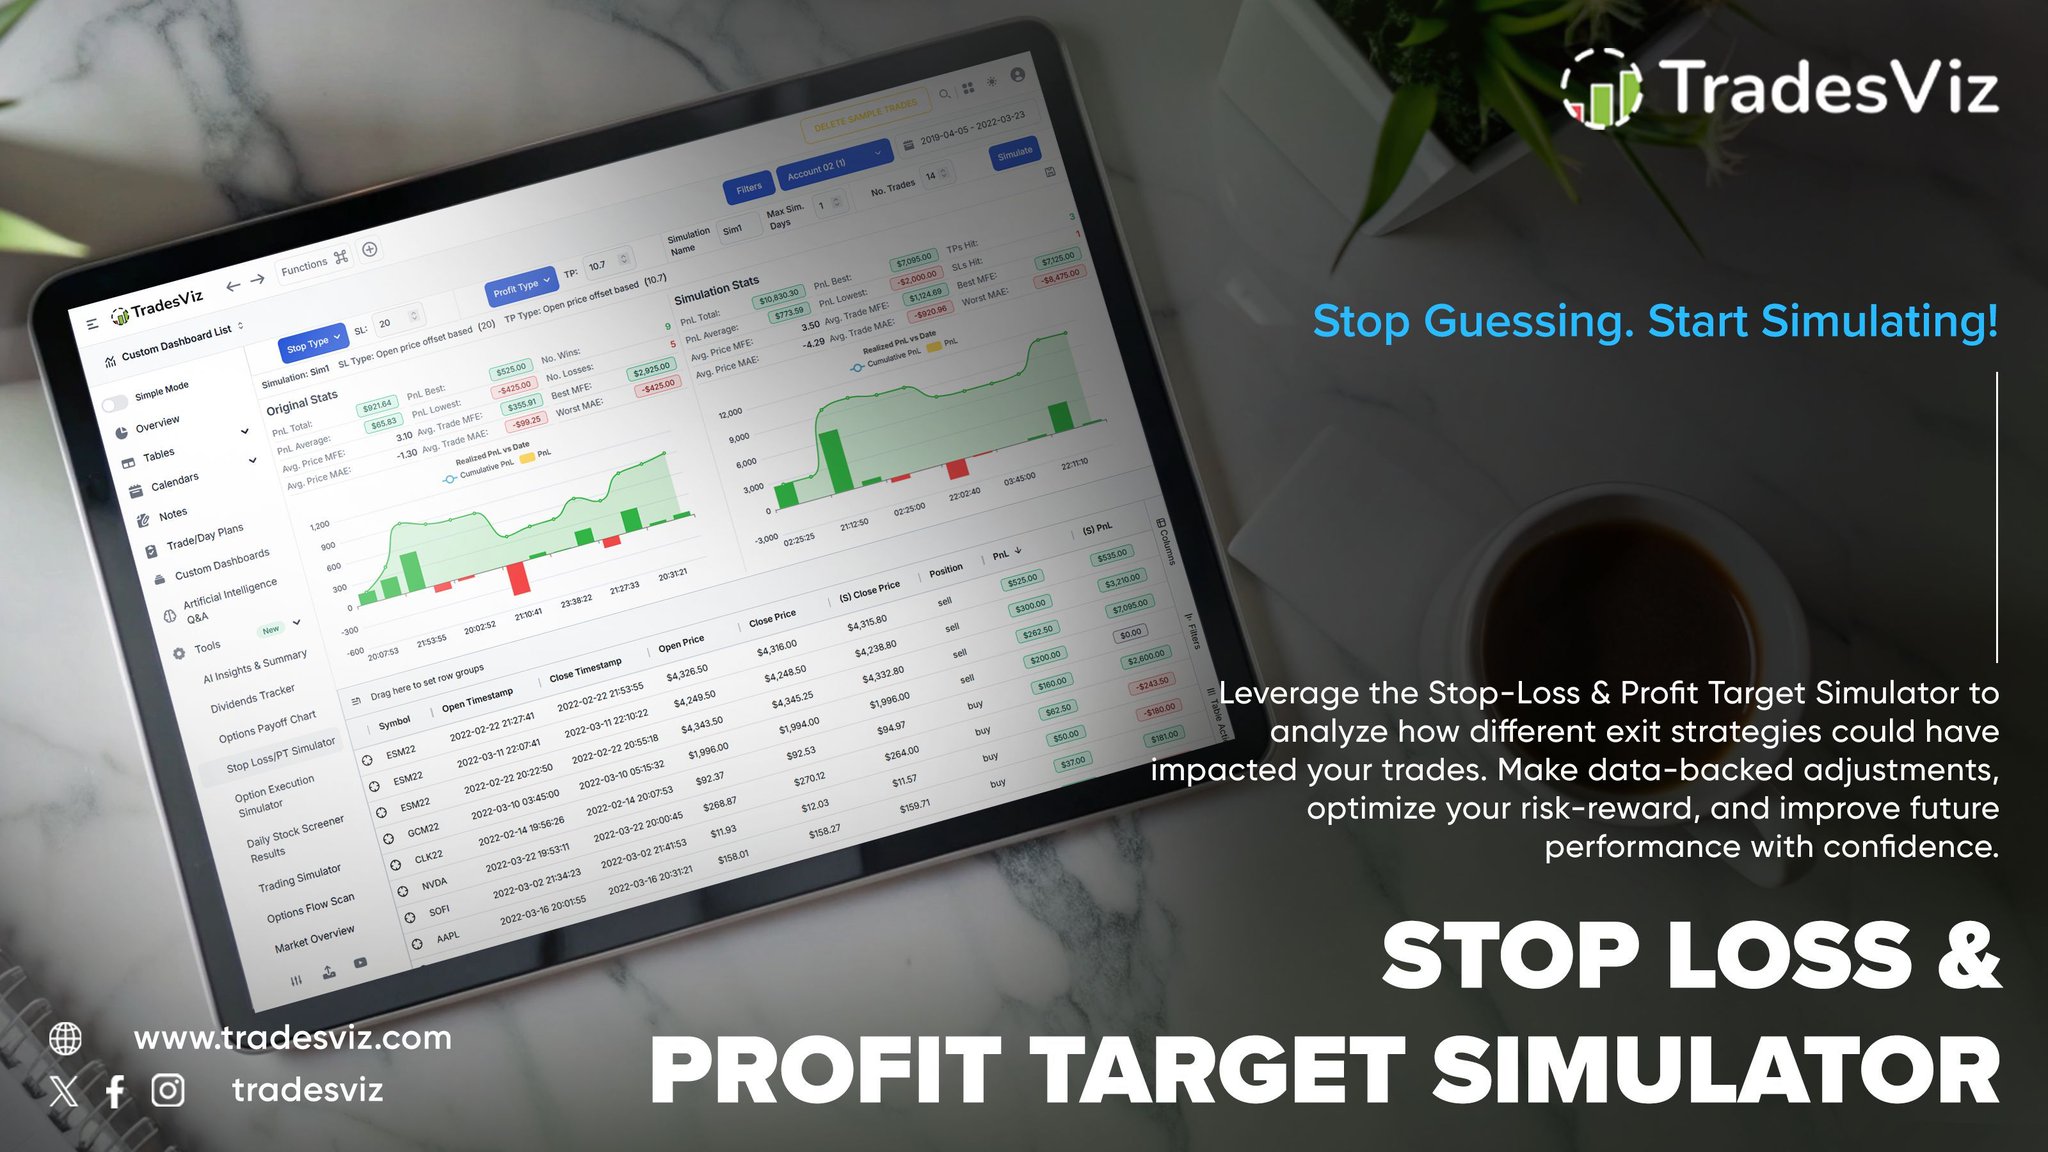
Stop guessing - start simulating your success! ⚙️📊
With the Stop Loss & Profit Target Simulator on TradesViz, you can test how different exit strategies would have changed your results - without risking a cent.
See exactly how tweaks in stop levels or profit targets could have boosted your PnL, reduced losses, or optimized your risk‑reward.
It’s not hindsight - it’s data‑backed foresight.
Refine your strategy, validate your setups, and take control of your trade outcomes with confidence.
🎯 Stop Loss & Profit Target Simulator - because smart exits make winning traders.
Only on TradesViz. 👇
Know your trades - and your companies too. 🧠💼
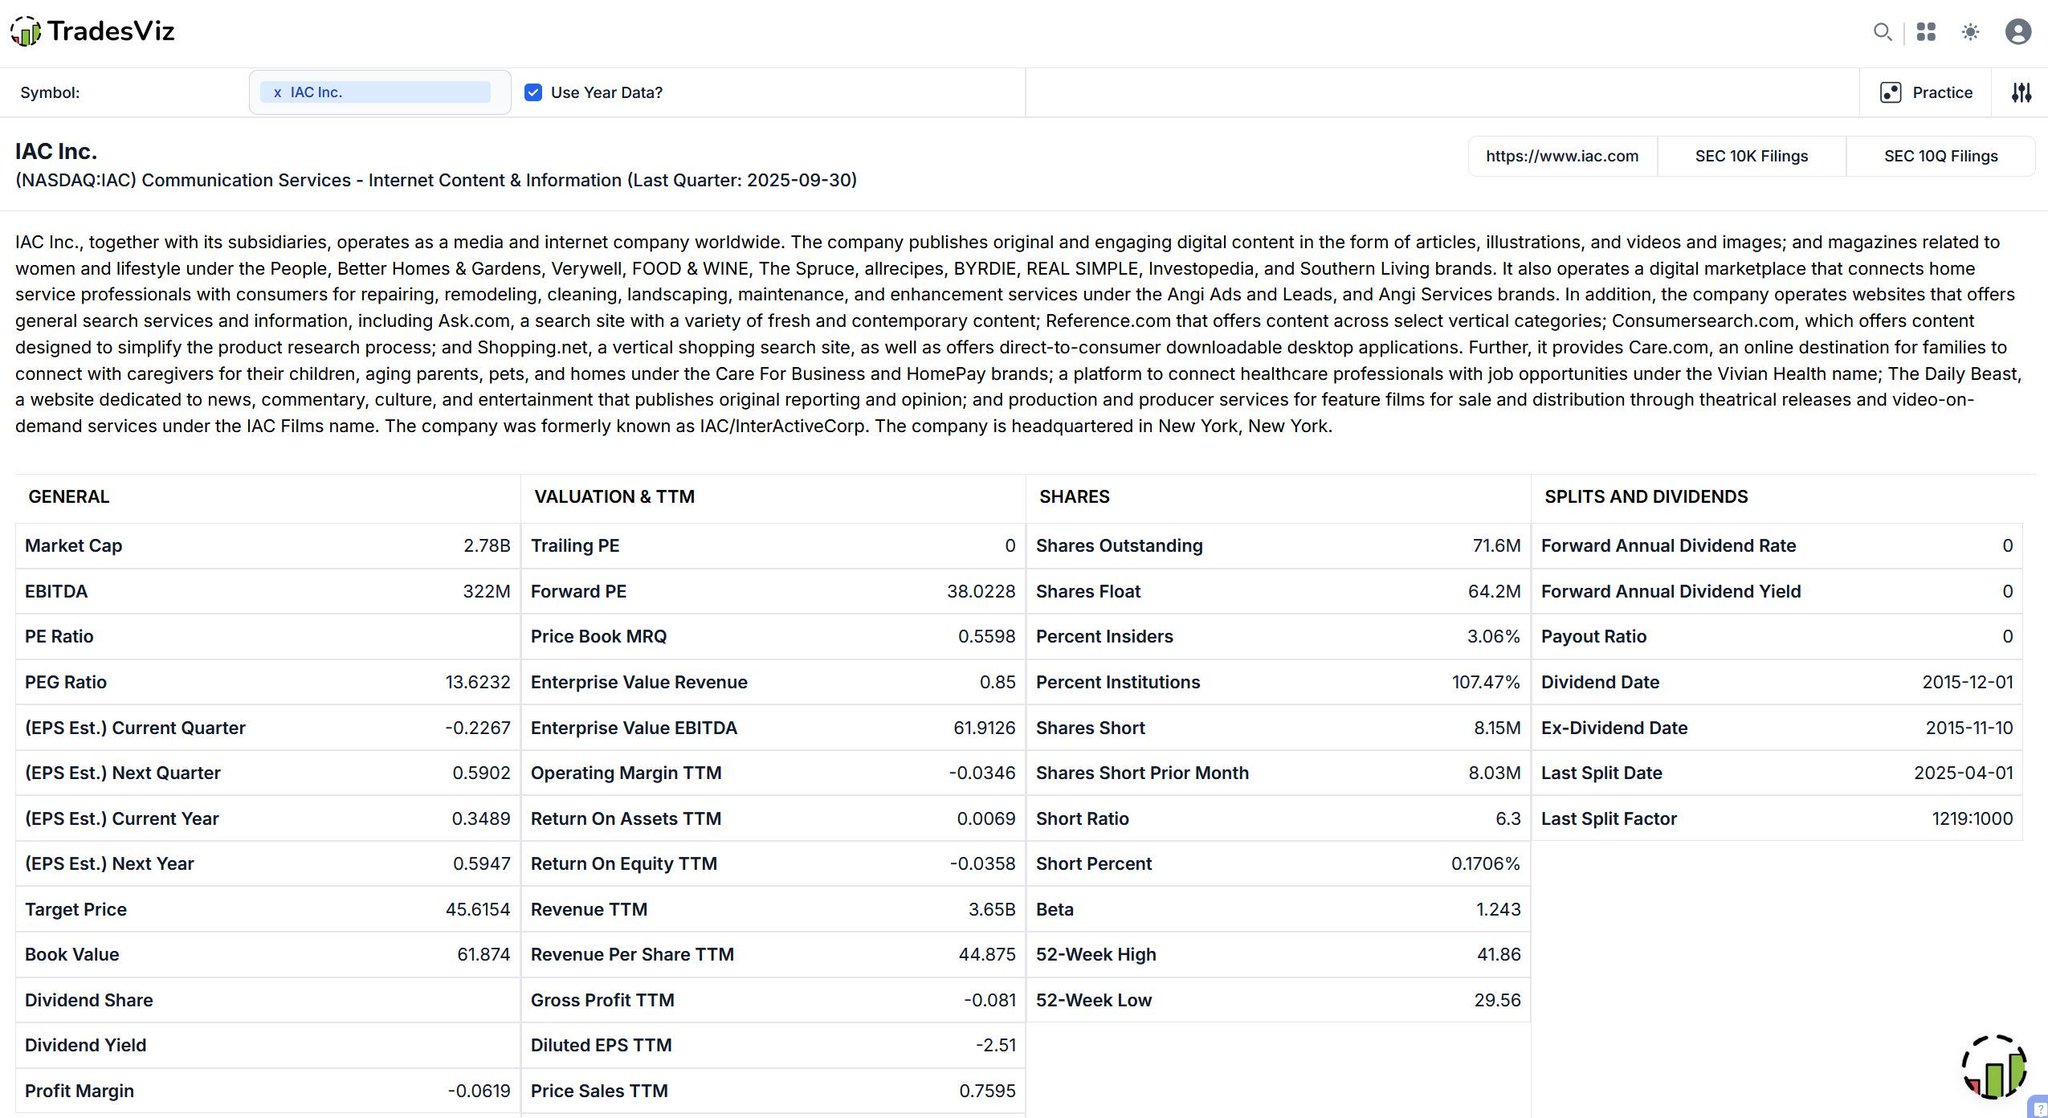
With Fundamentals Data on TradesViz, you can go beyond charts and execution stats - and dive deep into the true financial health behind every stock.
Instantly access market cap, revenue, EBITDA, P/E ratio, margins, book value, insider holdings, dividend info, and more - all in one clean, interactive view.
No need to switch platforms or hunt through reports - it’s all right where you analyze your trades.
Combine technical precision with fundamental insight and make better, data‑driven decisions.
Your data. Your design. Your edge. ⚙️📈
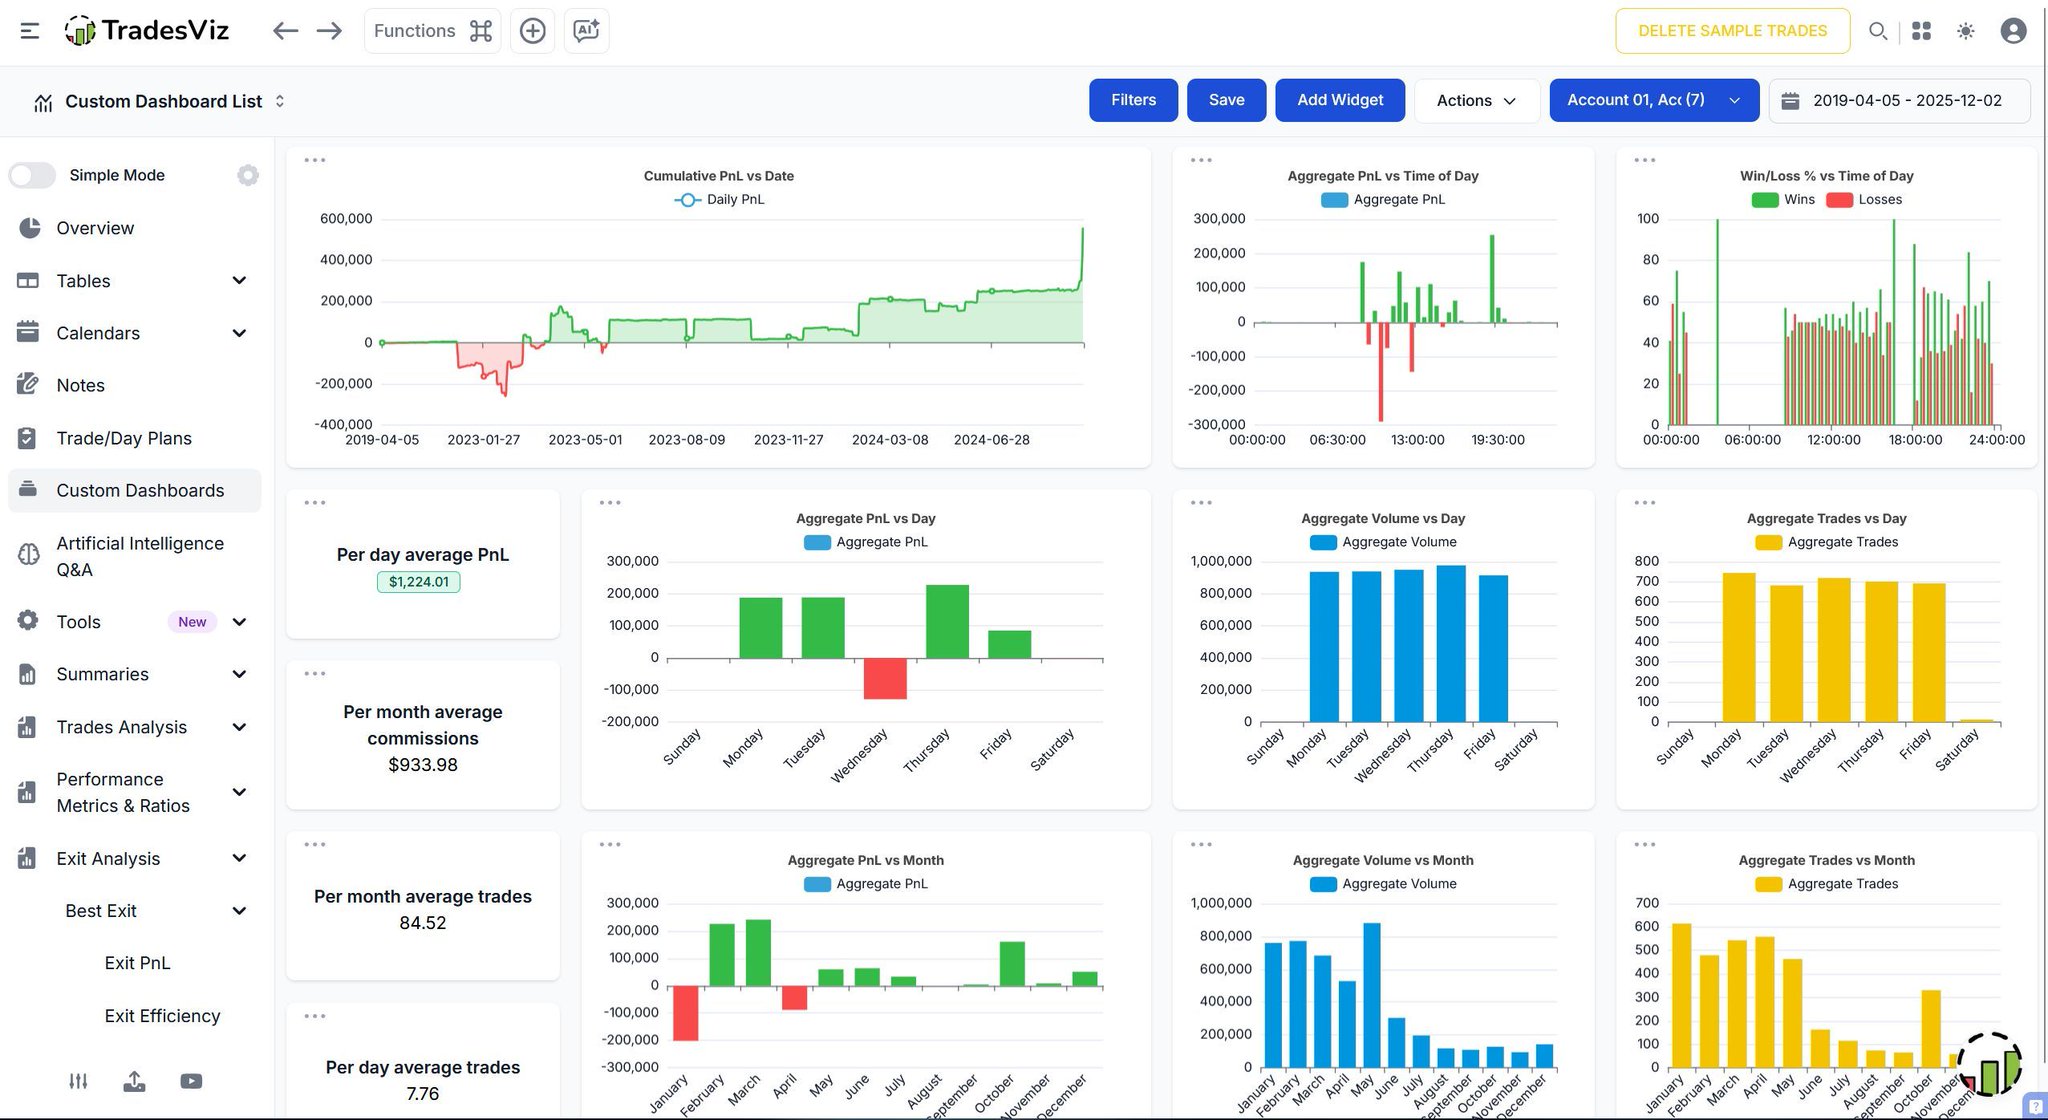
The TradesViz Custom Dashboard puts you in control - build the perfect trading cockpit from scratch.
Want a minimalist layout with just key metrics? Done.
Prefer a deep‑dive setup with detailed charts, ratios, and trends across time, duration, and assets? Also done.
Every widget is customizable - drag, resize, and combine insights to match your workflow.
From exit analysis to expectancy stats, your dashboard evolves with every trade.
Stop fitting into generic tools - create your own data playground with the Custom Dashboard on TradesViz. 👇
The easiest trade of the year closes tonight. 📉➡️📈
You have less than 24 hours to lock in the "TradesViz + @ezstockscreener" combo at the lowest price of 2025.
Already have a plan? Extend it.
Know a struggling trader? Gift it.
Still on the fence? Jump.
This isn't just a journal. It’s a Simulator, an AI Analyst, and a Stock Screener all in one ecosystem.
Secure your edge before the price corrects back to normal.
Code: TVBF25 (50% OFF)
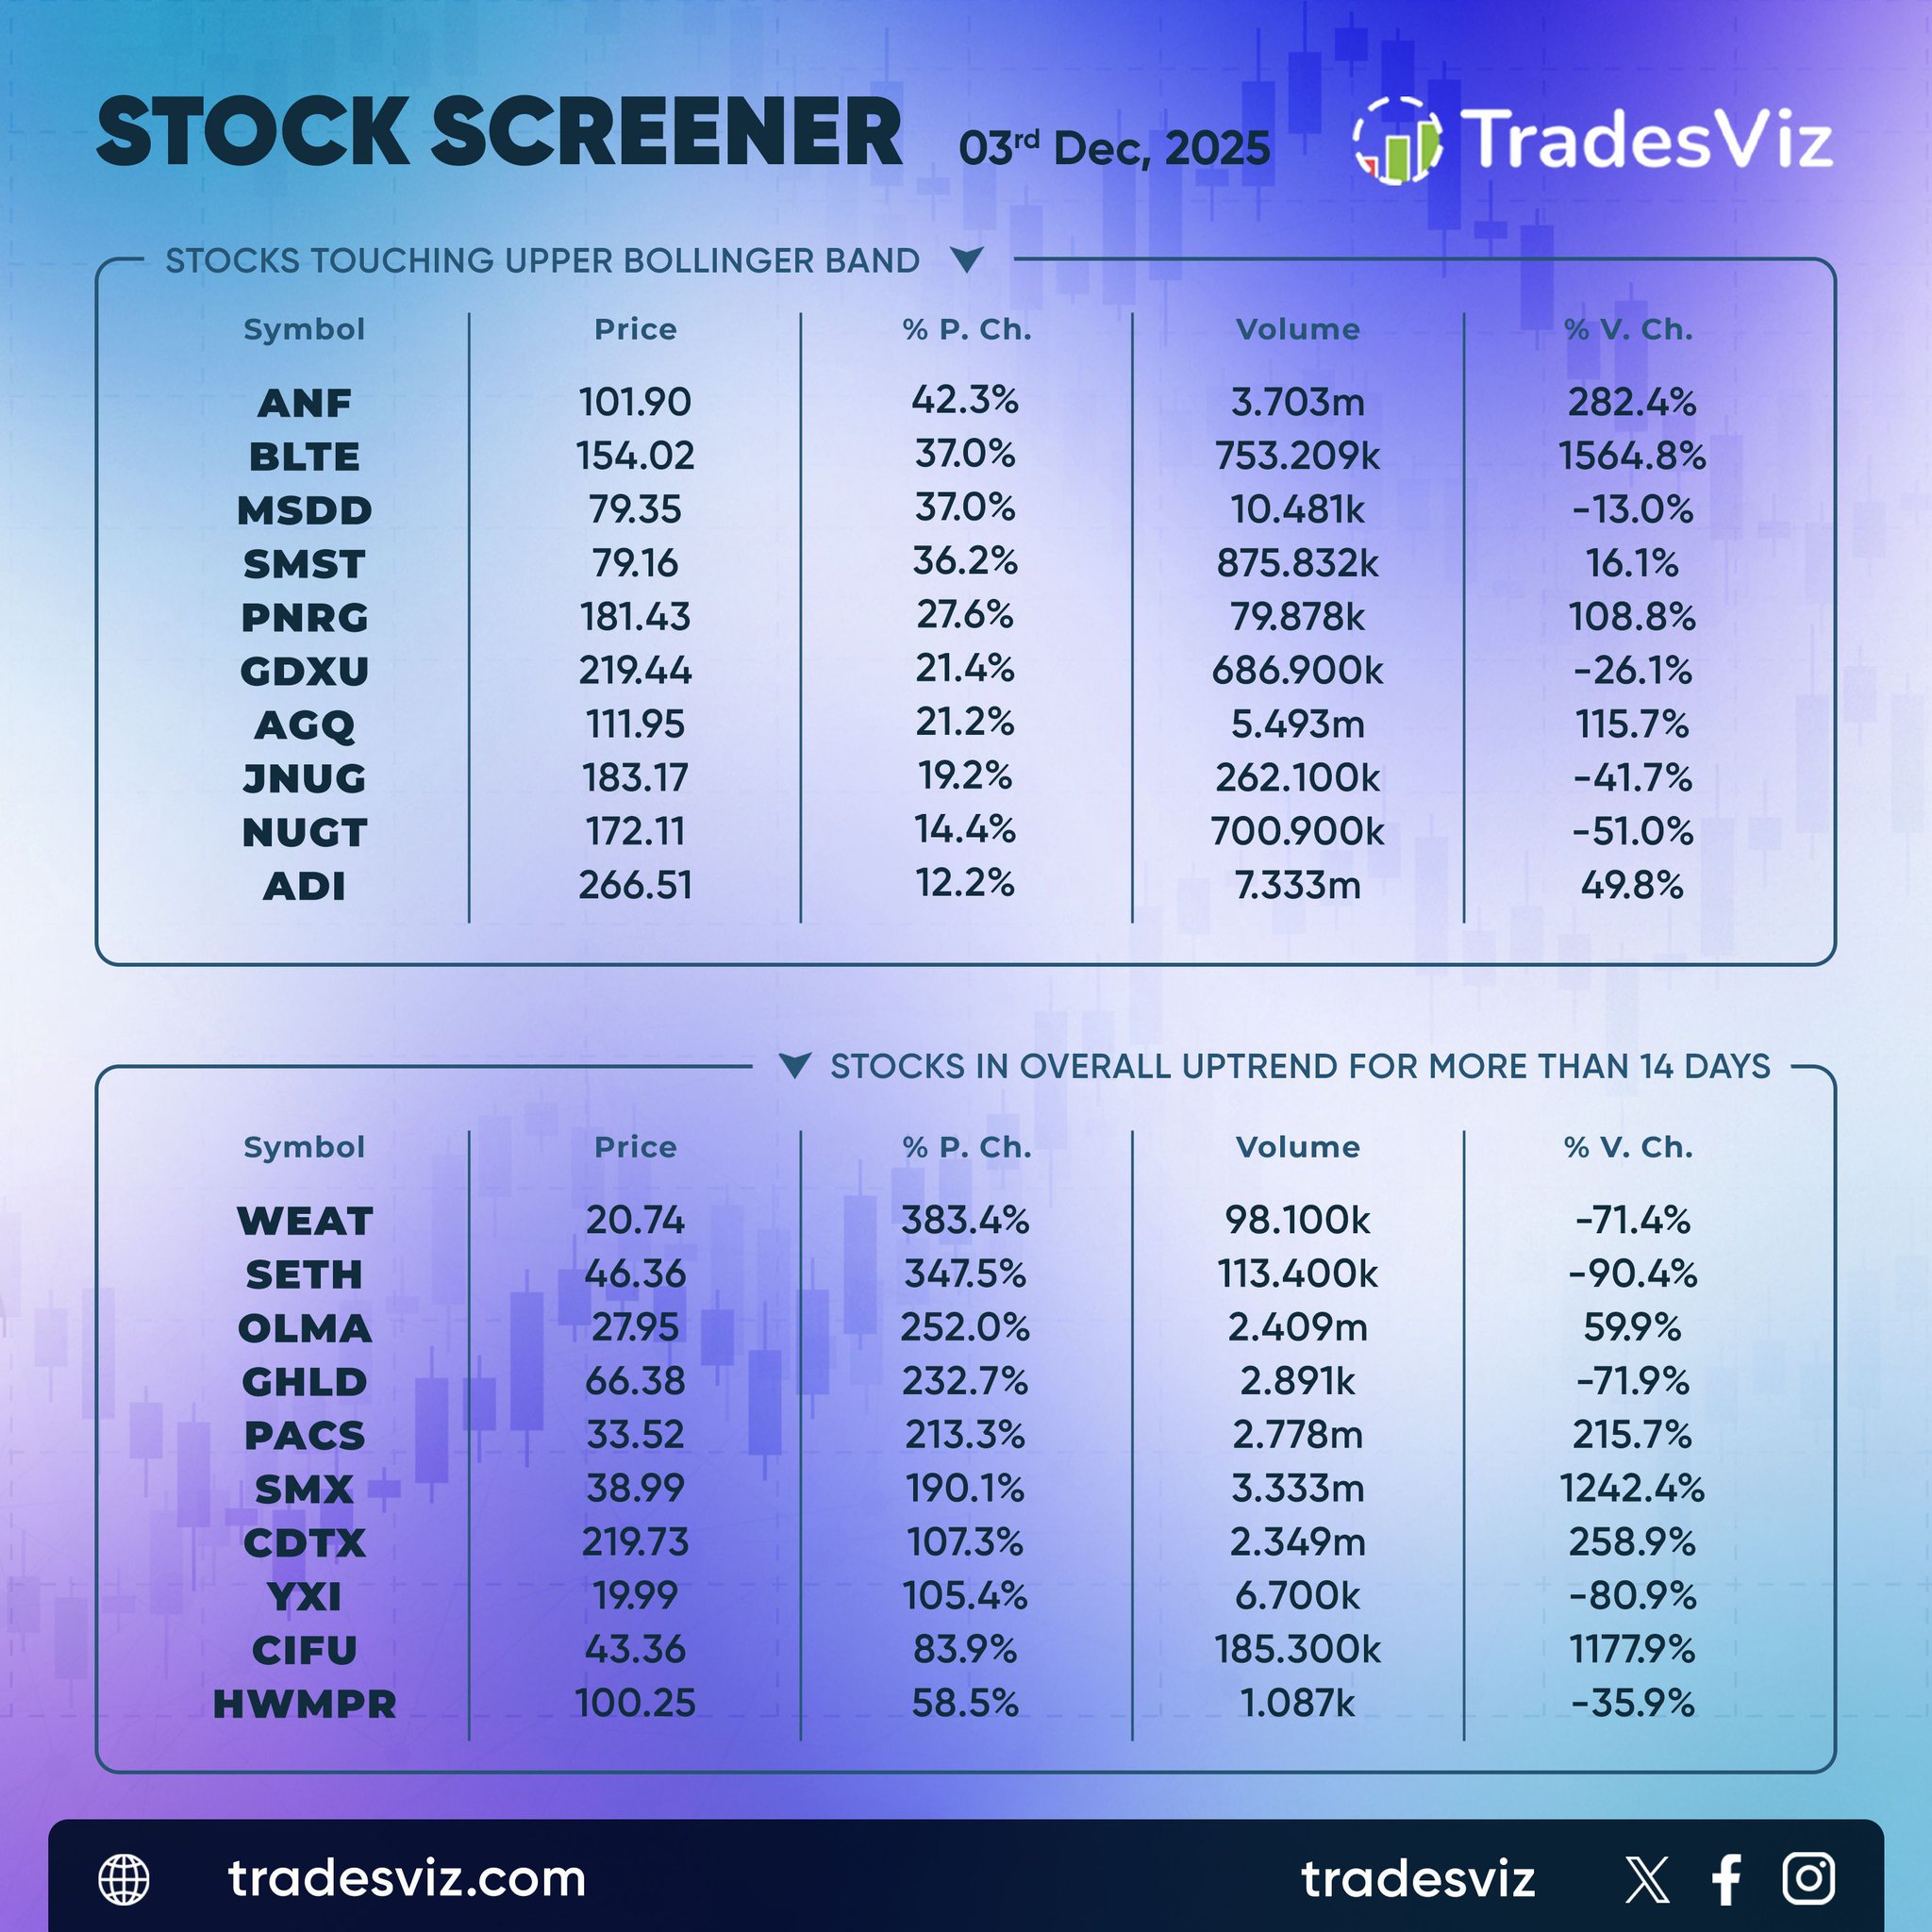
The stock screener for December 3, 2025 highlights strong bullish momentum across both short-term breakouts and longer-term uptrends, with multiple names showing large percentage gains and steady volume expansion.
In the stocks touching upper Bollinger Band category, $ANF led with a 42.3 percent surge to 101.90, supported by a 282.4 percent volume increase. $BLTE followed with a 37 percent jump to 154.02 and an impressive 1,564.8 percent rise in trading volume, indicating explosive buying pressure. $MSDD and $SMST each gained 37 percent and 36.2 percent respectively, with multi-day volume strength confirming continued momentum. $PNRG climbed 27.6 percent, while $GDXU and $AGQ rose over 21 percent each, reflecting active interest in precious metals. $JNUG and $NUGT gained around 19 and 14 percent respectively, while $ADI posted a solid 12.2 percent increase on growing demand.
In the stocks in overall uptrend for more than 14 days list, $WEAT led with a massive 383.4 percent gain, followed by $SETH up 347.5 percent and $OLMA up 252 percent, all showing exceptional trend extension. $GHLD and $PACS gained over 200 percent, while $SMX rose 190 percent on a 1,242 percent volume increase, signaling heavy accumulation. $CDTX climbed 107.3 percent, and $YXI and $CIFU posted sustained uptrend gains of 105 and 83.9 percent, respectively. $HWMPR closed the group with a 58.5 percent rise, maintaining its overall strength.
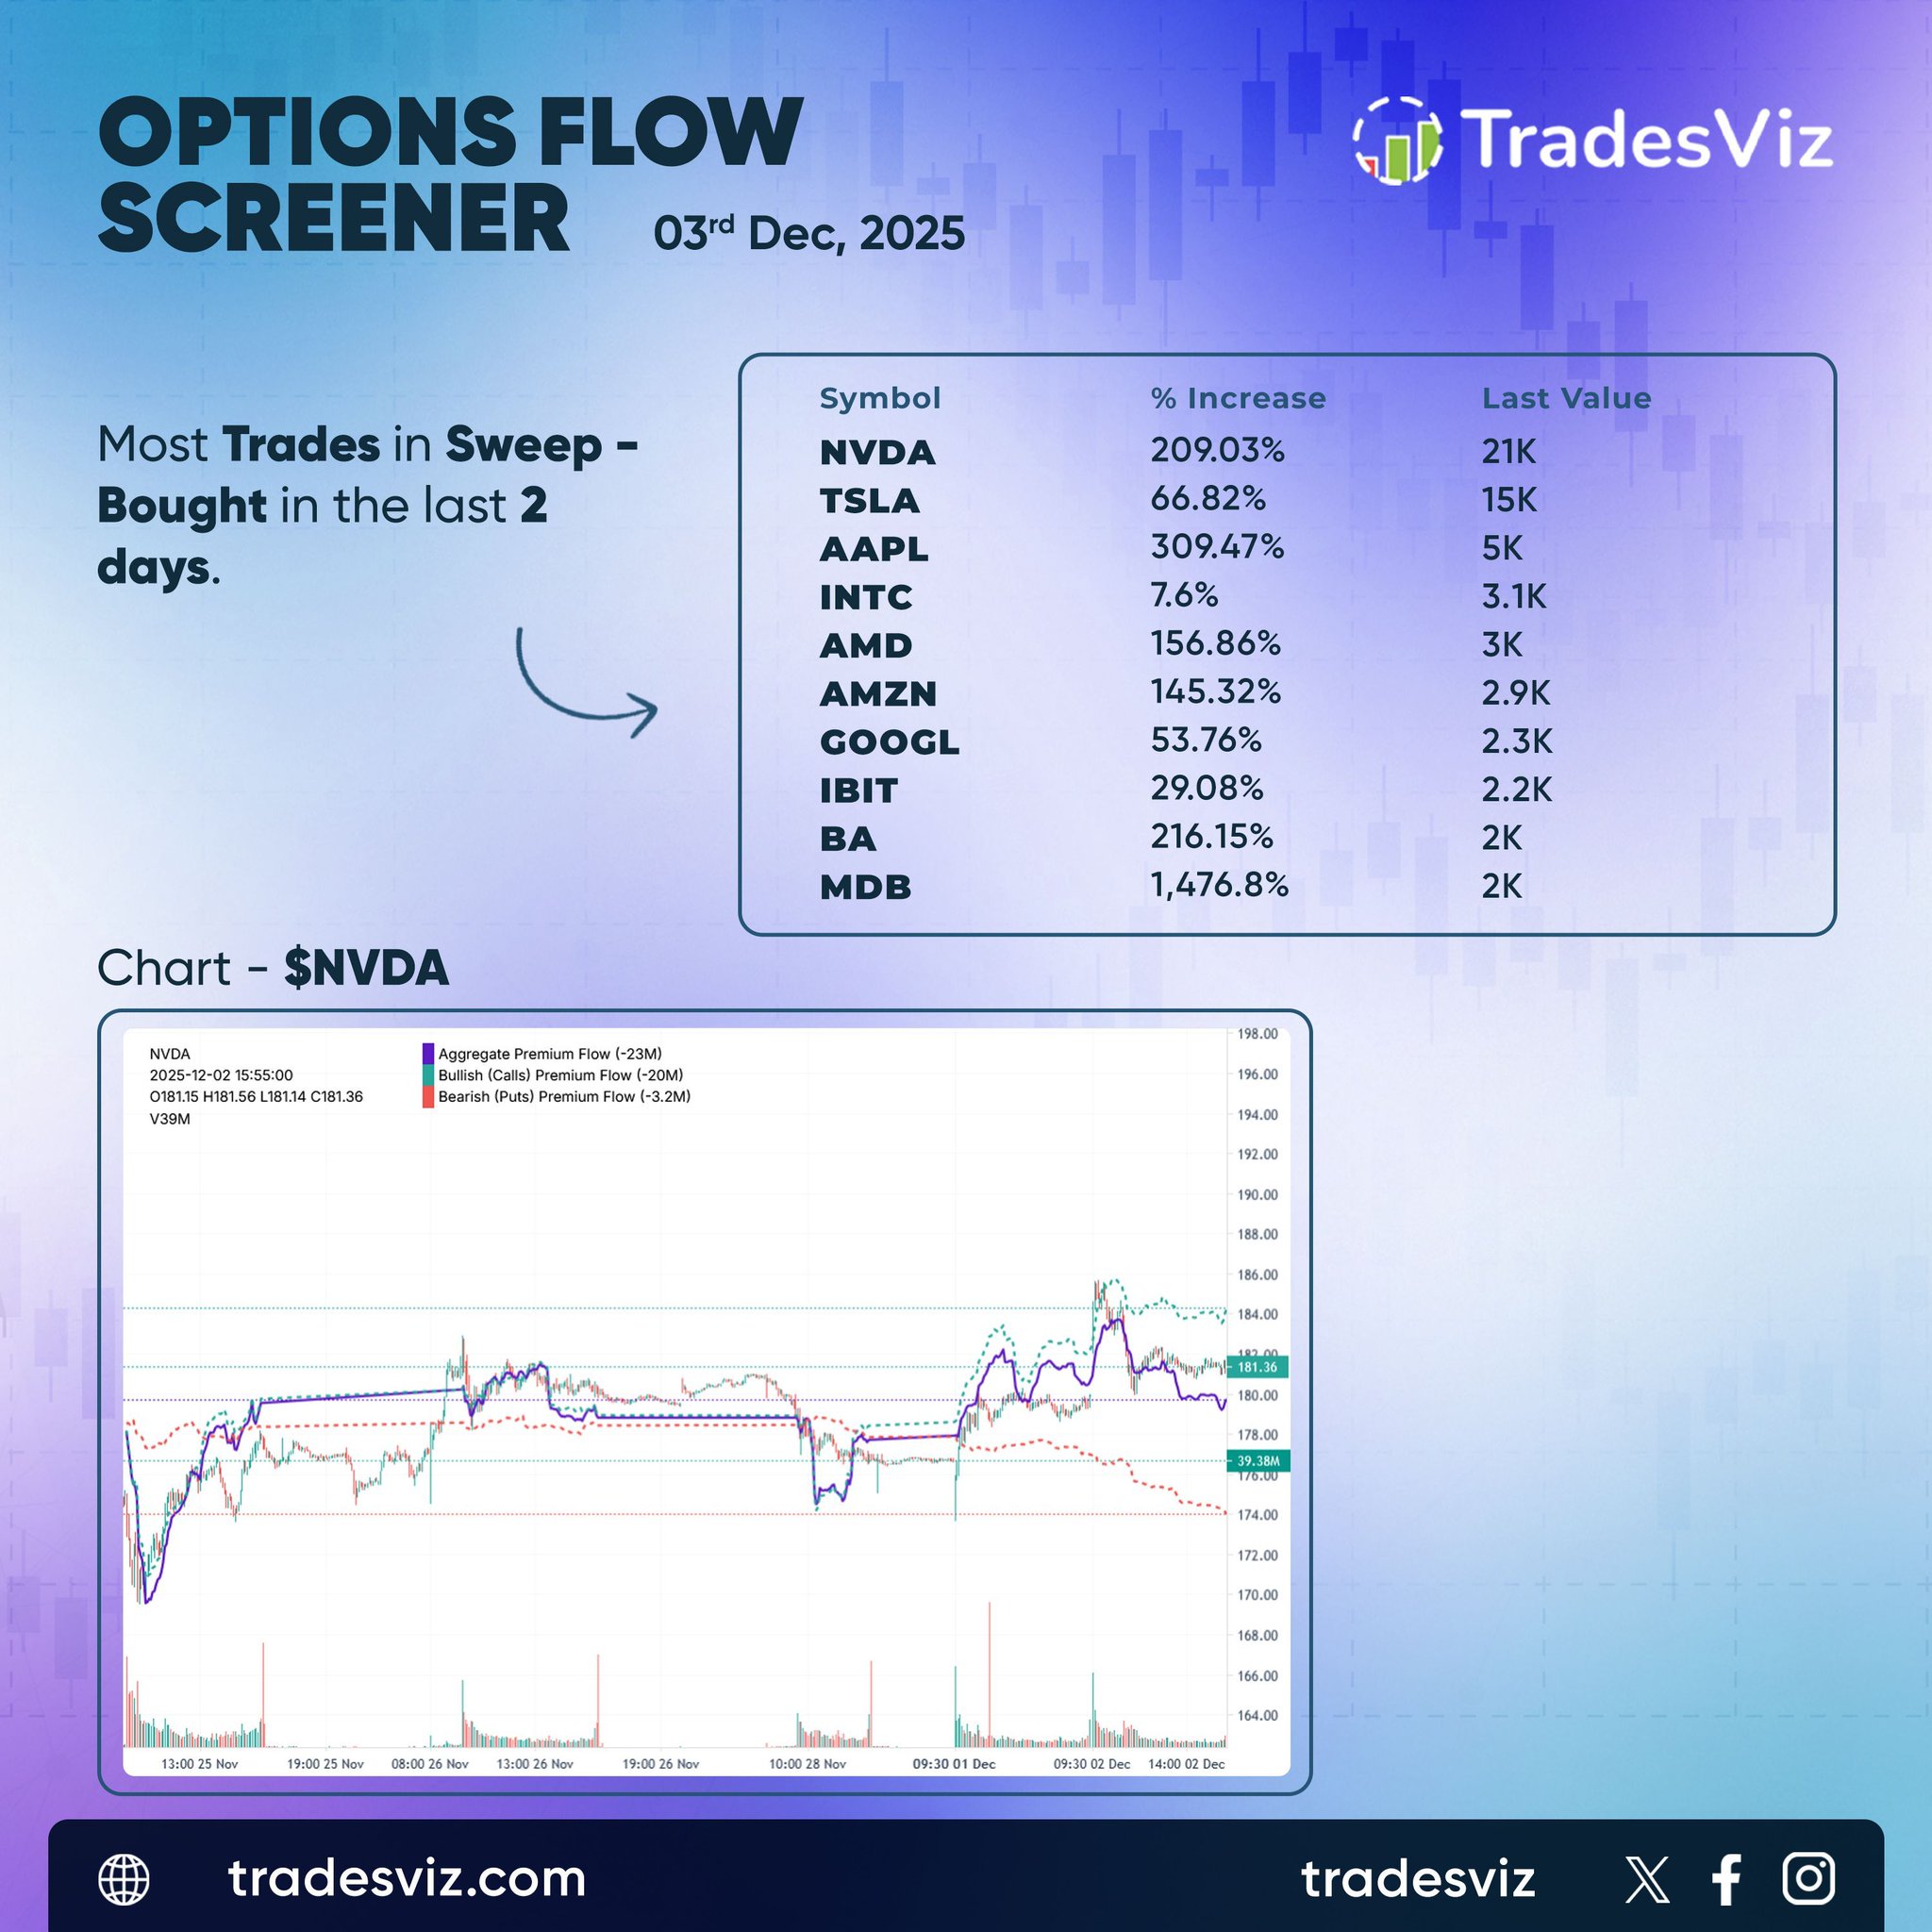
The options flow screener for December 3, 2025 shows a strong surge in bullish sweep trades, indicating renewed institutional buying across major tech names and high growth stocks over the last two days.
$AAPL led with a 309.47 percent increase in sweep buys, while $NVDA followed with 209.03 percent, both showing continued accumulation after recent consolidation phases. $BA saw a 216.15 percent rise, signaling rotation into industrials, and $MDB posted a massive 1,476.8 percent spike, highlighting renewed interest in software and data services.
$AMD and $AMZN recorded 156.86 percent and 145.32 percent increases respectively, confirming broader strength across the tech sector. $TSLA gained 66.82 percent and $GOOGL climbed 53.76 percent, showing steady inflows, while $IBIT was up 29.08 percent, reflecting steady momentum in crypto-linked assets.
The accompanying chart for $NVDA shows rising premium inflows, led by $20M in bullish call flow versus $14.2M in bearish put flow, with price action trending higher throughout the session - a sign of sustained confidence in the name.
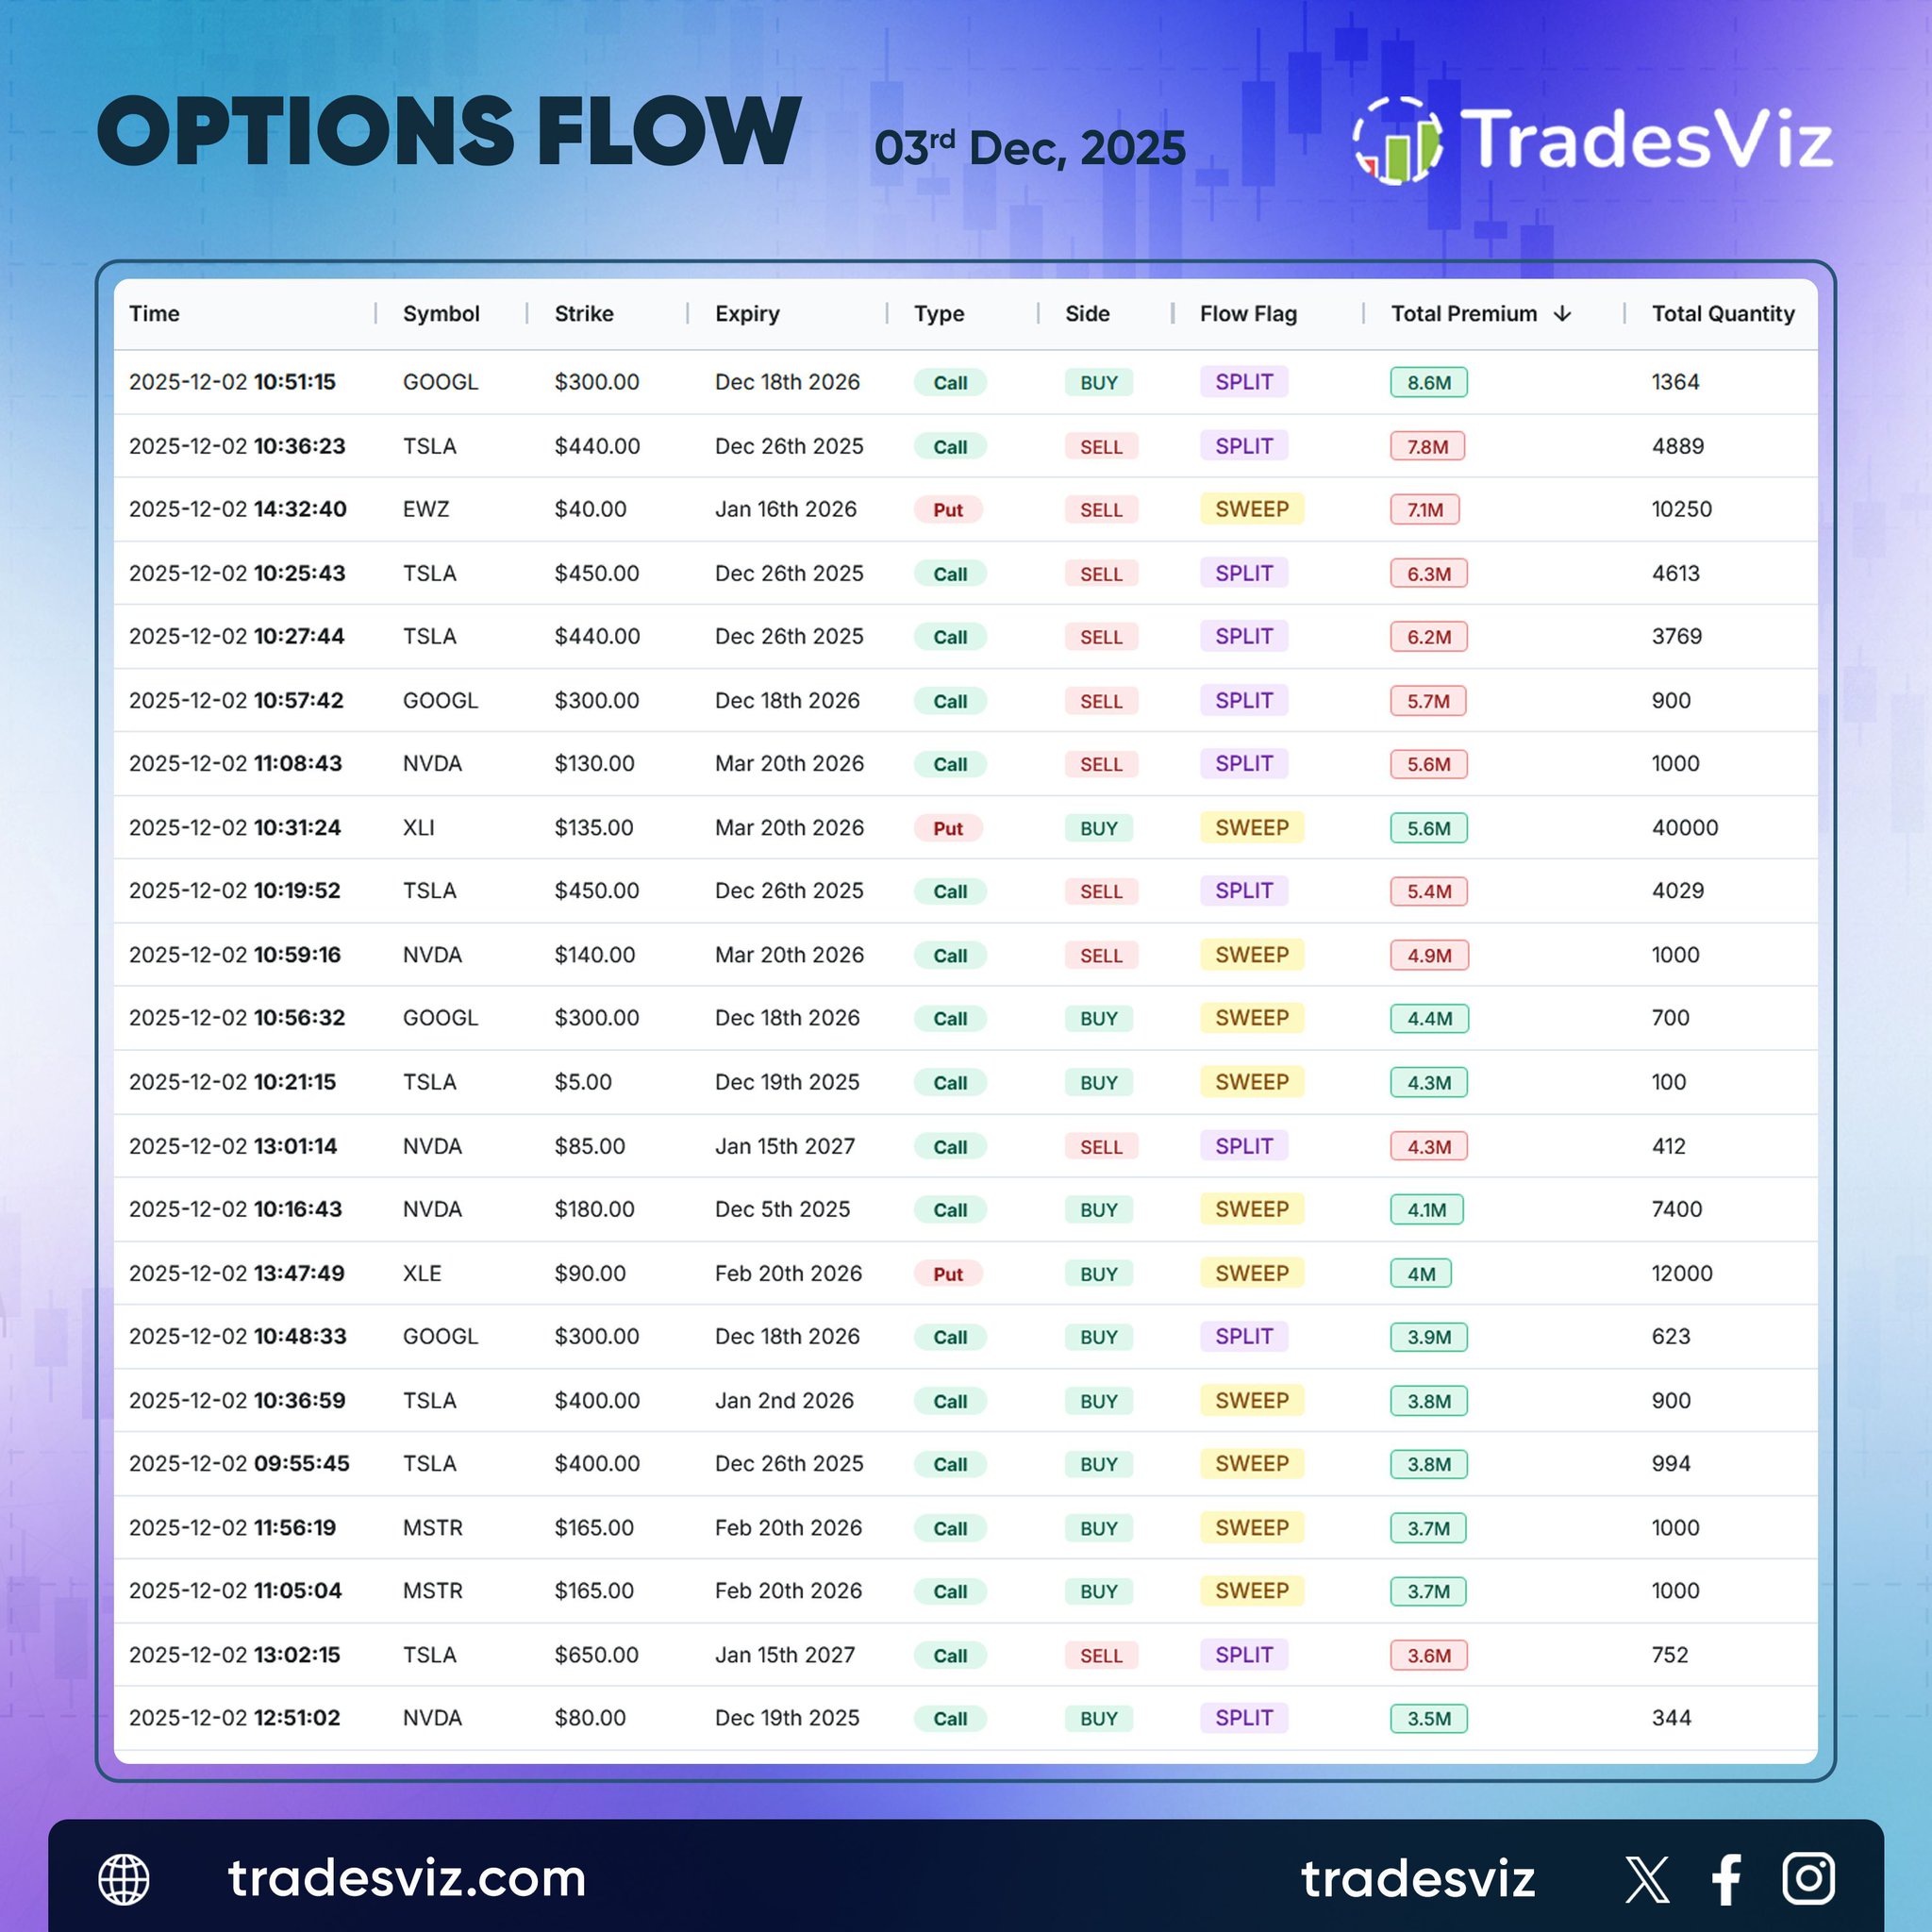
The options flow for December 3, 2025 shows strong institutional activity concentrated in large cap tech and select sector ETFs, with several high value sweeps and splits indicating active positioning ahead of key market data.
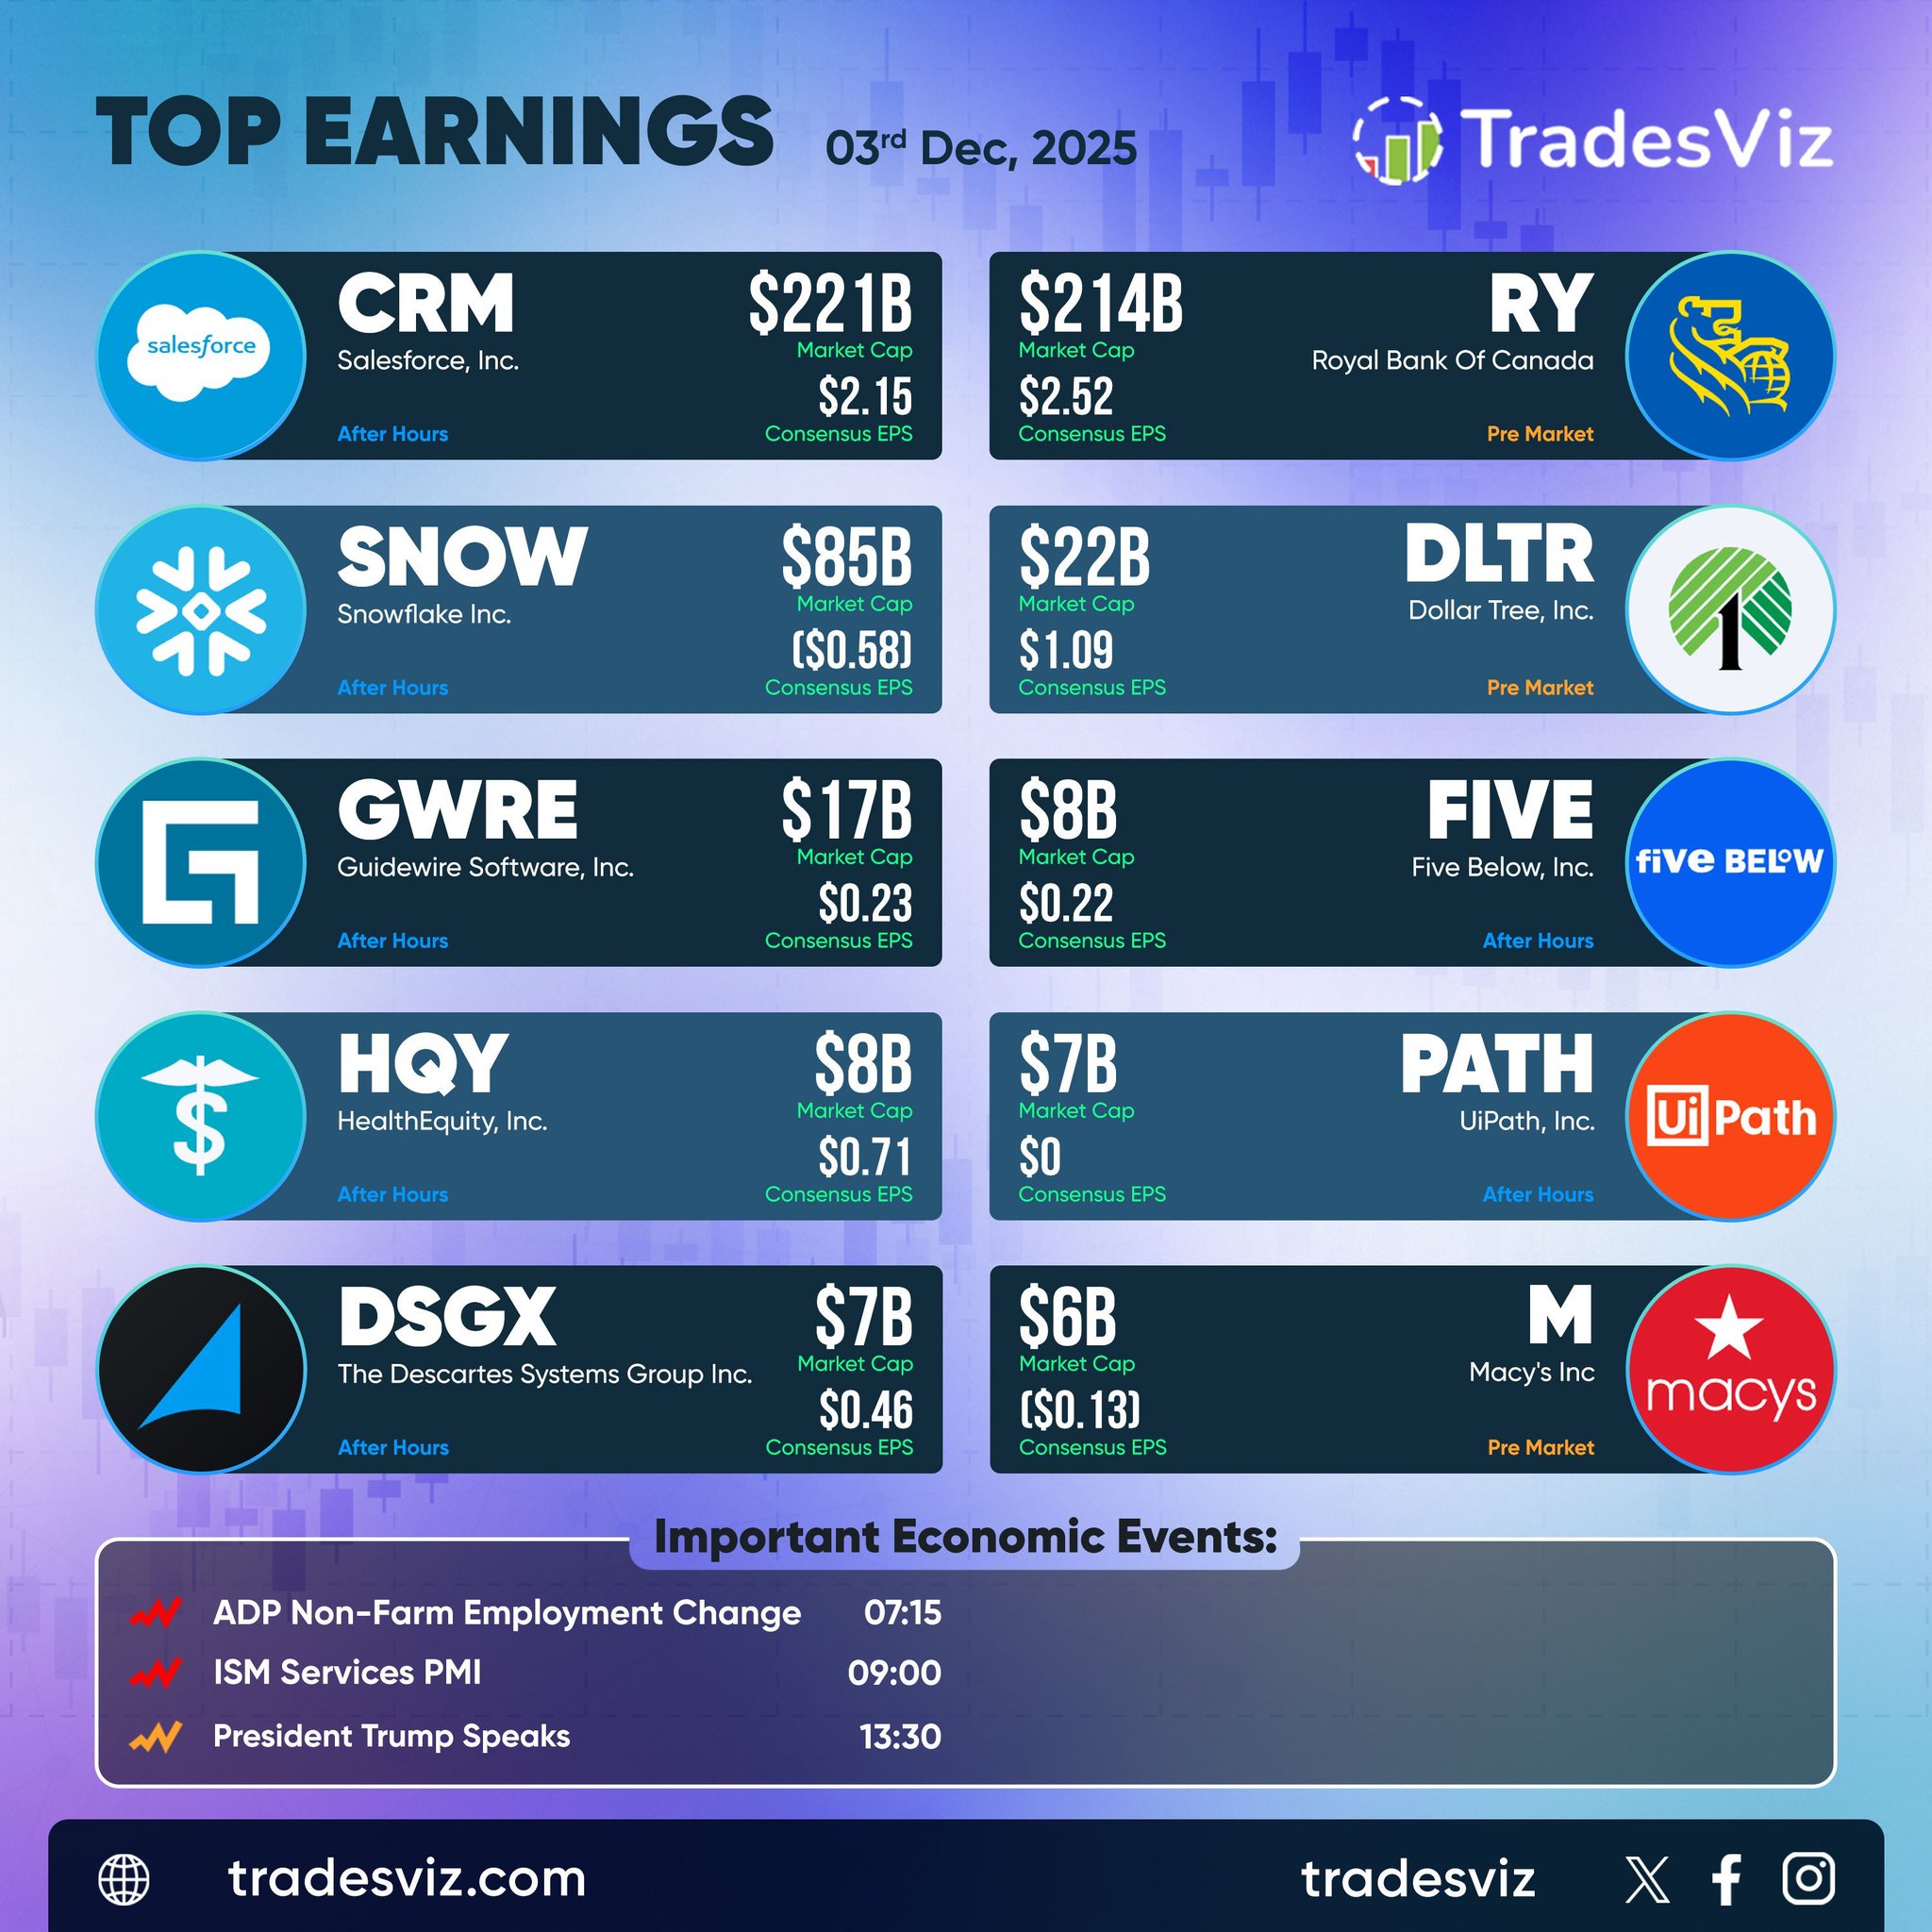
The top earnings schedule for December 3, 2025 features a mix of major reports from technology, retail, and financial names, providing key insights into multiple sectors heading into the final month of the year.
After hours, $CRM leads with a $221B market cap and a $2.15 EPS estimate, giving investors a look into enterprise software demand. $SNOW follows with an $85B cap and a ($0.58) EPS estimate, representing key data and cloud performance metrics. $GWRE at $17B with $0.23 EPS and $HQY at $8B with $0.71 EPS will also be closely watched, along with $DSGX at $7B and $0.46 EPS. $FIVE adds retail perspective with an $8B cap and $0.22 EPS estimate, and $PATH rounds out the group with a $7B cap and a $0 EPS estimate, reflecting automation software trends.
In the pre market lineup, $RY (Royal Bank of Canada) reports with a $214B market cap and $2.52 EPS estimate, offering a key read on the financial sector, while $DLTR (Dollar Tree) also reports with a $22B cap and $1.09 EPS, providing retail consumption insights. $M (Macy’s Inc.) joins the pre market reports with a $6B market cap and a projected ($0.13) EPS, potentially influencing sentiment in the retail space.
Important economic events include ADP Non-Farm Employment Change at 07:15, ISM Services PMI at 09:00, and a scheduled presidential address at 13:30.
Overall, December 3 presents a packed day dominated by tech and retail earnings plus critical economic updates that could drive significant market movement.
Your AI tools are only as smart as the data you feed them. 🤖
If your journal is just a wall of text like "felt confident, market looked strong," you are feeding your analytics noise.
To get real Alpha from AI, you need Signal.
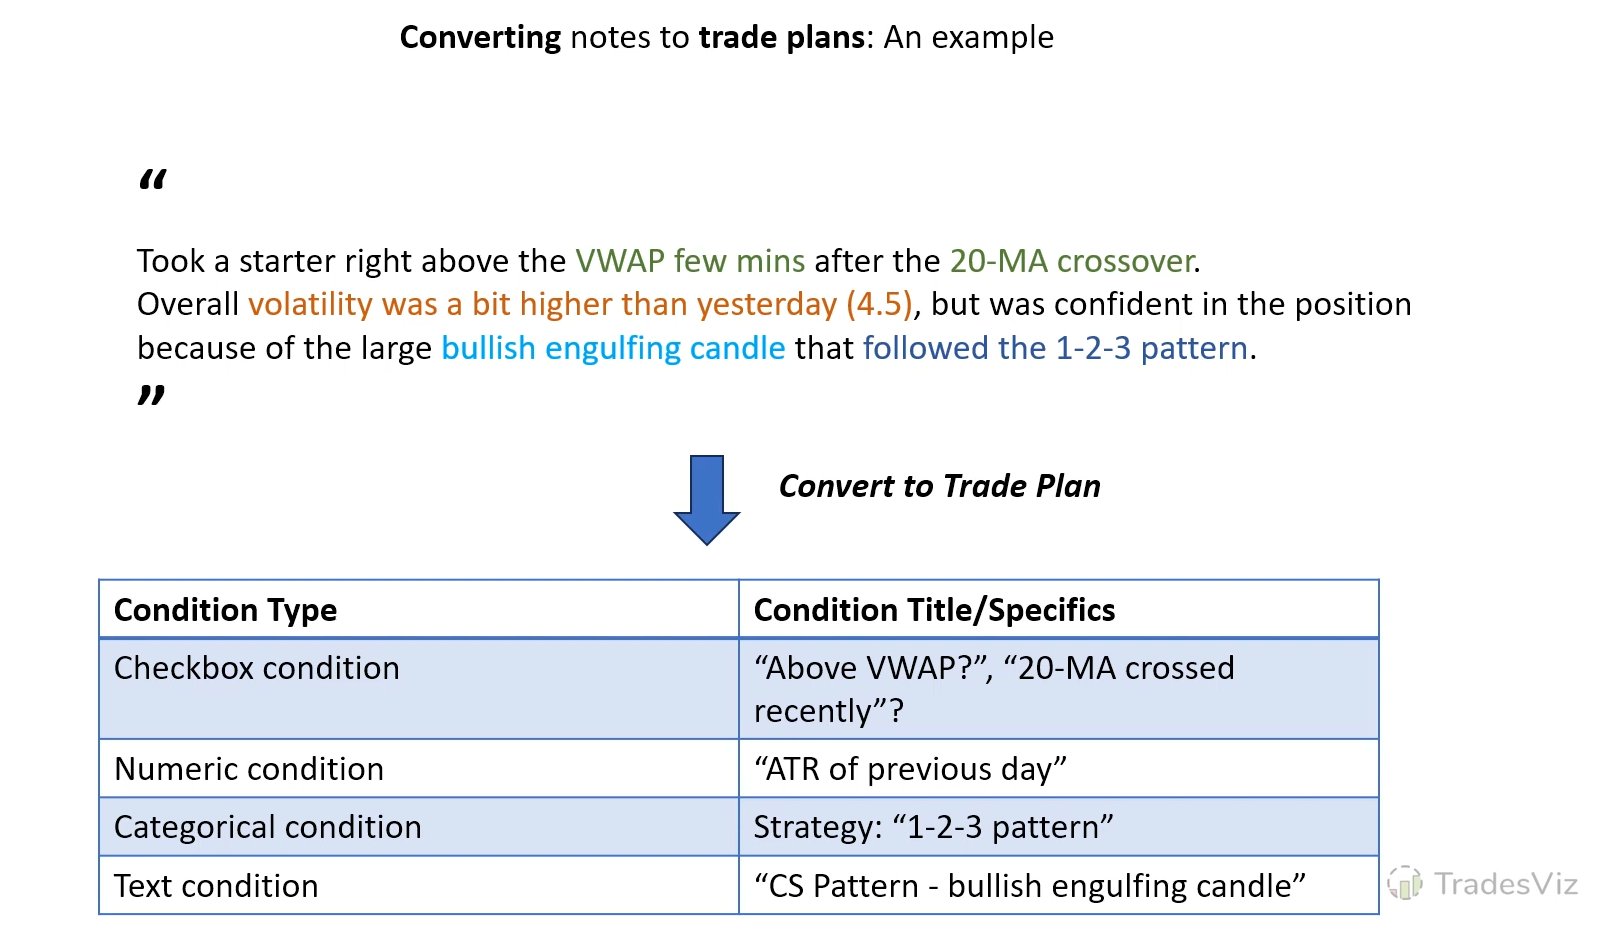
You must convert "stories" into "structured data" (see image).
"Above VWAP" ➡️ Boolean Check ✅
"High Volatility" ➡️ Numeric Value 🔢
"Bull Flag" ➡️ Categorical Tag 🏷️
This isn't just journaling anymore. It's Data Engineering for your PnL.