Train like you fight. 🥊
You wouldn't step into a ring without sparring first. Why step into the market without simulating?
The Trading Simulator allows you to replay any trading day in history as if it were happening live.
With a fully functional order entry panel-complete with Buy/Sell buttons, Market/Limit orders, and Quantity controls-you can practice your execution mechanics in a risk-free environment.
Sharpen your reflexes before you risk your capital.
Are your winners paying for your losers? ⚖️
Your "Win Rate" is vanity. Your "Risk/Reward Ratio" is sanity.
This dashboard exposes the mathematical truth of your strategy by comparing your Average Win against your Average Loss.
In this example, there is a critical leak: The "Average Losing PnL" (-$2,004.05) is significantly larger than the "Average Winning PnL" ($1,495.05).
This negative expectancy forces the trader to maintain a very high win rate just to break even.
Use this data to size down your losers and let your winners run.
The February 11 technical screener showed strong continuation in momentum names and expanding volume confirmation across breakout stocks.
In the **five‑day gainers group**, $CCHH led with a 221% price increase on explosive 175.8 million shares traded, up 38,000% in volume — clear evidence of major accumulation. $VAL‑WT and $VRSSF followed with 193% and 185% gains, supported by 7,200% and 890% volume jumps. $LIMN (+154%) and $FATBB (+121%) extended sustained strength while $UOKA (+85%) posted an 88,000% volume surge, confirming renewed small‑cap participation. $PLSE, $ENPX, and $PIII each returned 68–77% in five days with steady turnover — constructive multi‑session follow‑through.
The **Bollinger‑band group** highlighted expanding breakout breadth among mid‑ to large‑caps. $TERG gained 76% with volume up 1,175%, leading industrial names. $LITE (+63%), $GOLD (+46%), and $GLW (+39%) each pressed upper bands as sector rotation broadened from metals to semiconductors and tech hardware. $XPO, $RRX, and $TER added consistent 35–36% gains alongside ARW, POWL, and $IPGP, which sustained strong participation into weekly closes.
With synchronized price expansion and volume confirmation across both speculative and established stocks, the broader tone pointed to durable risk appetite and accumulation rather than short‑term volatility.
The Feb 11 options flow screener highlighted strong **positive divergences** on the 30‑minute timeframe across several key names, signaling underlying accumulation despite neutral or soft price action.
$ASML led with clear divergence between stabilizing price levels and rising call‑side premium inflows, suggesting quiet institutional buildup in semiconductors. $BMNR and $CRWV showed similar high‑threshold divergences, paired with expanding volume and tighter spreads across sessions.
Financials joined in as $JPM registered a consistent upward drift in call flow relative to flat pricing, while $GEV and $VRT both reflected supportive rotations in industrial and electrical equipment sectors.
$INTC, $SNDK, $STX, and $UBER rounded out the list, confirming cross‑sector participation and capital rotation across chips, storage, and mobility spaces.
The clustering of high‑intensity positive divergences within the same session typically signals institutional accumulation phases—conditions that often precede momentum expansion once price action realigns with growing options‑side conviction.
The Feb 11 options tape showed concentrated activity focused in retail, energy, and megacap tech, reflecting a methodical institutional positioning tone.
$TGT dominated with a sequence of large sell sweeps on Feb 20 2026 calls between the $100 and $105 strikes, each sized between 9 and 13 million in premium. Repeated prints over a short interval with matching structure signal disciplined profit‑taking or systematic premium selling rather than directional bearishness.
$SLB followed with a trio of Feb 20 2026 $37.50 call sells, each in the 7–13 million range, highlighting continued trimming across energy service names after recent strength.
$AMZN printed a $250 put sell sweep worth 17 million, showing confidence through downside exposure management. $NVDA logged a $180 call buy sweep for 7.7 million, reinforcing quiet accumulation in semiconductors.
Smaller but notable prints appeared in $MU (Mar 13 2026 $395 put split buy 7.1 million) and $TGT (May 15 2026 call buys 6.5–8.2 million), indicating both short‑term speculation and longer‑dated retail sector exposure.
Taken together, the day’s flow reflected refined positioning — call selling tied to profit‑taking in retailers and energy, balanced by selective accumulation in high‑growth tech and semiconductor names.
The Feb 11 earnings lineup features a high‑impact mix across technology, consumer, and energy sectors, positioned to move market sentiment ahead of macro data releases.
**After hours**, Cisco ($CSCO) anchors tech with a $342 billion market cap and $0.82 EPS estimate, alongside AppLovin ($APP) at $155 billion and $2.89 EPS, and Equinix ($EQIX) reporting $8.04 EPS at $84 billion. Together, these names provide a key read on network infrastructure, software demand, and data‑center capacity into Q1.
**Pre‑market**, the focus shifts to consumer, telecom, and energy. McDonald’s ($MCD) leads the Dow components at $231 billion with a $3.04 EPS forecast. T‑Mobile ($TMUS) follows with $2.03 EPS on $221 billion, offering visibility into carrier performance. TotalEnergies ($TTE) reports with a $161 billion value and $1.80 EPS consensus, while Shopify ($SHOP) and Vertiv ($VRT) release $0.41 and $1.29 EPS expectations, signaling activity across e‑commerce and industrial tech.
NetEase ($NTES) and Hilton ($HLT), at $78 billion and $72 billion market caps respectively, round out the list with $1.85 and $2.00 EPS forecasts, covering digital entertainment and global travel trends.
Important macro events at 07:30 — Average Hourly Earnings, Non‑Farm Employment Change, and Unemployment Rate — add to an already volatile setup, aligning major corporate results with labor‑market direction.
Here’s what "consistency" actually looks like in the trenches.
The main chart tracks the 10-trade EMA trend. Notice the volatility? The sharp drops? That’s just noise.
Now look at the Equity Curve below. It’s hitting all-time highs.
Takeaway: You can have ugly short-term streaks and still run a world-class system. Zoom out. 🔎
Do you thrive in chaos or calm? 🌪️
Some traders need wild price swings to make money; others get chopped up by them.
The Technical Analysis vs ATR (Average True Range) dashboard answers the question: "How volatile should the stock be for me to trade it?"
Stop trading stocks that don't move enough to pay you—or move too much for you to handle.
Don't row against the tide. 🌊
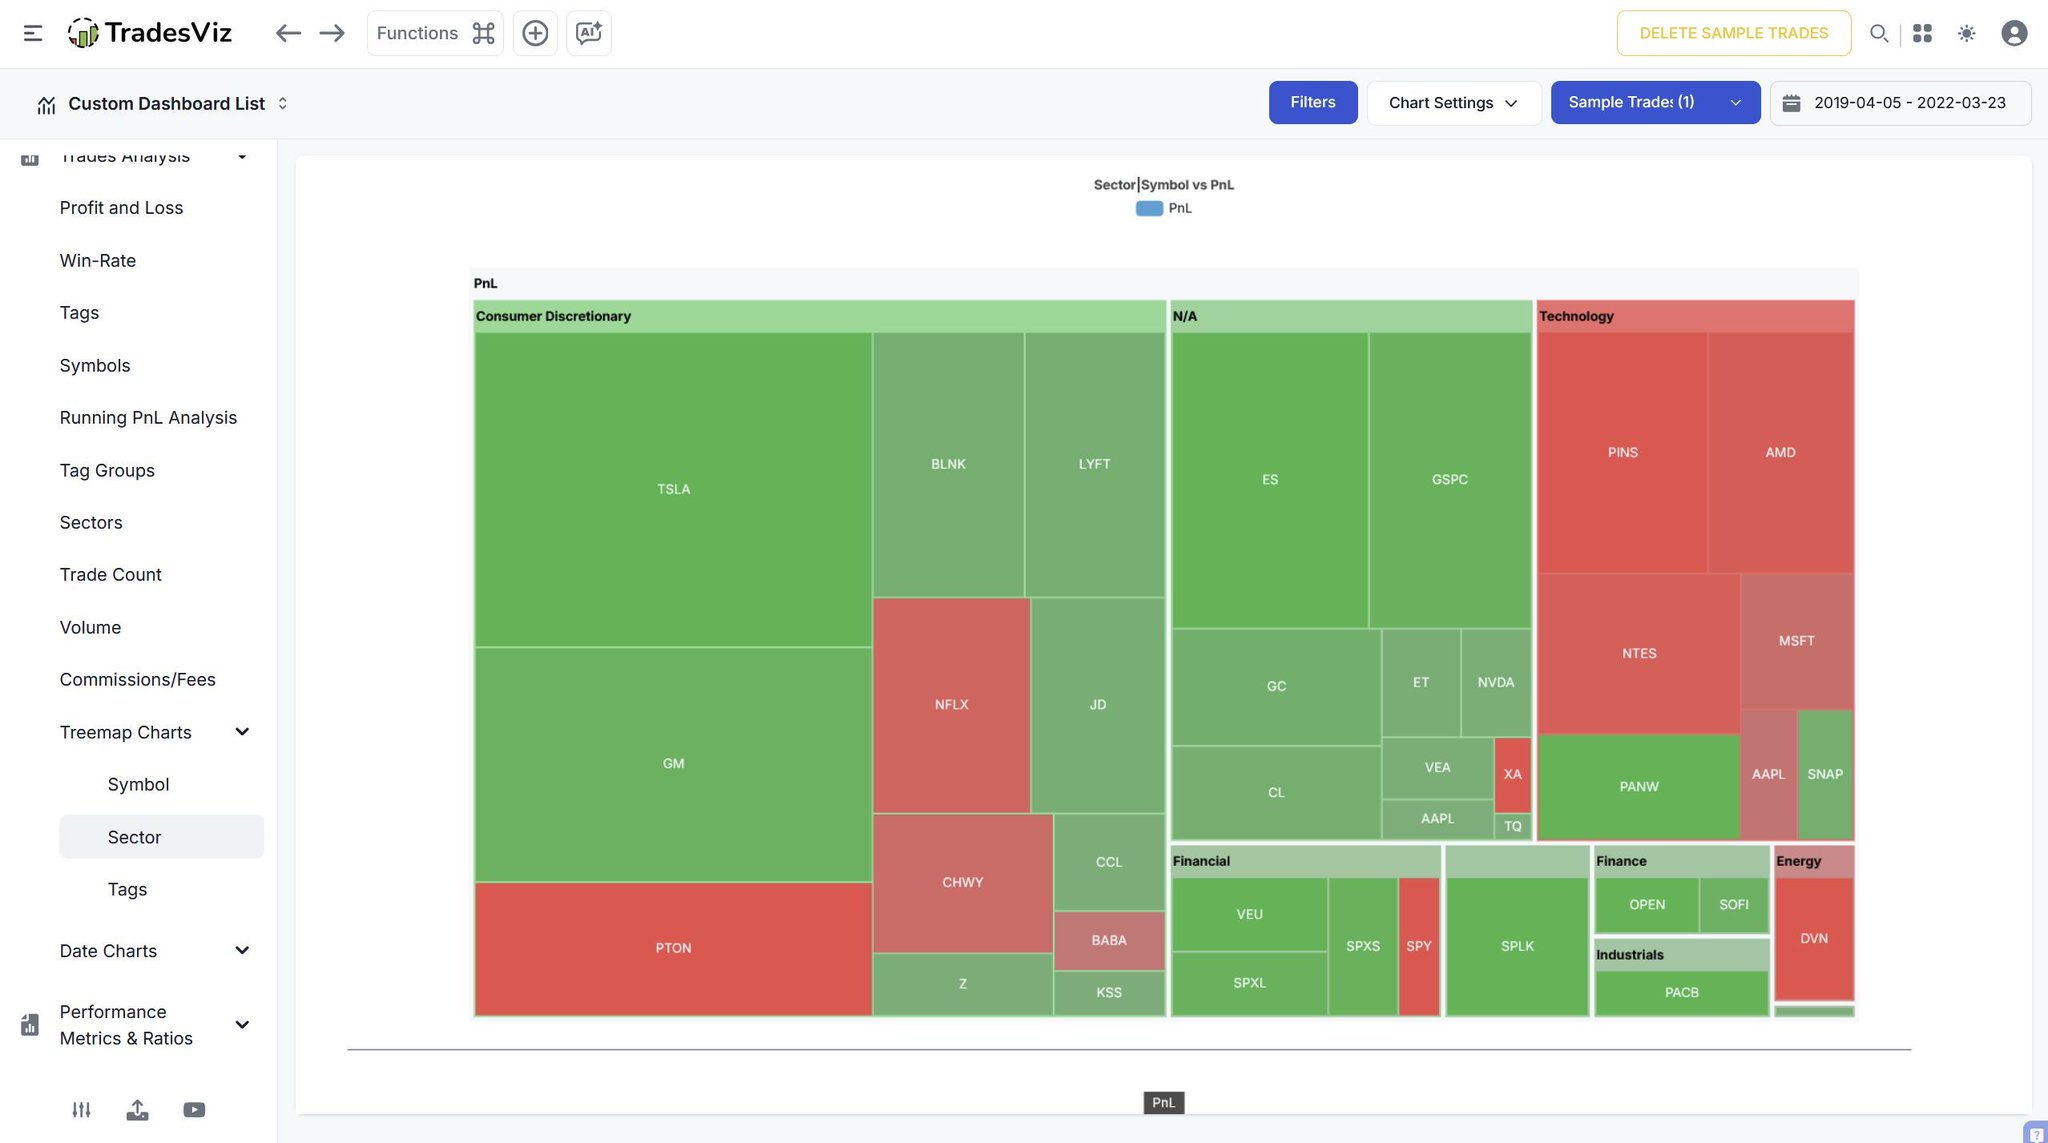
A stock doesn't move in a vacuum; it moves with its sector.
The Sector Treemap gives you a bird's-eye view of where the money is flowing in your portfolio.
In this visual audit, the Technology sector is a sea of red, with major losses in PINS and AMD. Meanwhile, Consumer Discretionary is powering the account with massive green blocks from TSLA and GM.
Identify the strong sectors. Cut the weak ones.
The price of the stock isn't the only thing that moves your PnL.
This feature lets you stress-test your position against the two silent killers of option value: Time and Volatility.
Using the "IV%" and "Date" sliders at the bottom, you can simulate exactly how "Theta Decay" or an "IV Crush" will impact your profitability.
Will holding through earnings destroy your premium? Drag the slider and find out before you commit capital.
Predict the future. Protect your account.