The Feb 10 options flow screen showed consistent strength in put‑side premium selling across major sectors, signaling steady institutional risk rotation rather than panic moves.
$TSM led the activity with a 103% increase in put premium sold, totaling 7.5 million in flow. The accompanying trend chart showed price stability through the session, confirming controlled selling pressure rather than directional weakness.
Behind it, $KD surged 14,966%, and $MAGS rose 12,268%, both reflecting sharp multi‑day expansions in put flow from minimal prior levels. $EEM and $NVDL recorded 5,244% and 2,443% jumps, showing broader engagement across international and derivative ETFs.
Mid‑range increases came from $HIMS (+625%), $BRKB (+797%), $BE (+460%), $GEV (+928%), and $NFLX (+60%), confirming the flow was market‑wide rather than sector‑specific.
The pattern — continuous two‑day rise in sold puts paired with price stability — indicates accumulation of short‑volatility exposure. Such coordinated selling generally reflects confidence in near‑term market resilience and institutional positioning for premium capture heading into mid‑February.
The Feb 10 options tape showed concentrated institutional rotations in metals, semiconductors, and megacap tech.
$SCCO dominated the session with a cluster of large sweeps on the $120C line expiring Feb 20 2026, totaling over $85 million in premium across multiple prints. Combined flow across $115C and $120C strikes suggests aggressive premium selling and repositioning around copper exposure, aligning with a broader materials unwind.
$TSLA followed with mixed two‑way activity on December 2028 $600P contracts, alternating buy and sell splits of $22 million, $14 million, and $12 million each. The sequence reflected delta and volatility adjustment rather than new directional bets. Smaller but notable trades hit the $340C line at $5.9 million and June 2027 $120P at similar sizing.
$SHOP printed heavy sell‑side sweeps on the $135P and $140P expiries (April and May 2026), totaling roughly $22 million, signaling institutional profit‑taking or structured premium capture after strong downside runs.
$LMT logged a $6.8 million split‑side call buy on the March 2026 $570C, maintaining steady defense‑sector participation. $SLV and $XOM each added mid‑sized trades—around $6 million per print—keeping metals and energy active in hedge rotation.
The Feb 10 earnings lineup features a heavyweight mix of healthcare, consumer, energy, and industrial leaders.
AstraZeneca ($AZN) opens the pre‑market slate with a $595 billion market cap and $2.18 EPS estimate, setting the tone for global pharma. Coca‑Cola ($KO) follows at $339 billion and $0.56 EPS, providing a read on global consumer demand.
S&P Global ($SPGI) adds a key financial data component with a $133 billion valuation and $4.32 EPS forecast, while BP ($BP) brings energy exposure at $101 billion and $0.57 EPS. CVS Health ($CVS) contributes healthcare‑retail visibility with $0.99 EPS on a $99 billion market cap, and Duke Energy ($DUK) rounds out the utility side with $1.51 EPS expected.
After hours, Gilead ($GILD) reports with $1.83 EPS on $189 billion, and Welltower ($WELL) at $1.44 EPS on $134 billion, both providing clarity on biotech and healthcare real‑estate trends.
Marriott ($MAR) at $89 billion and Spotify ($SPOT) at $86 billion finish the pre‑market roster, offering insights into travel recovery and digital streaming margins.
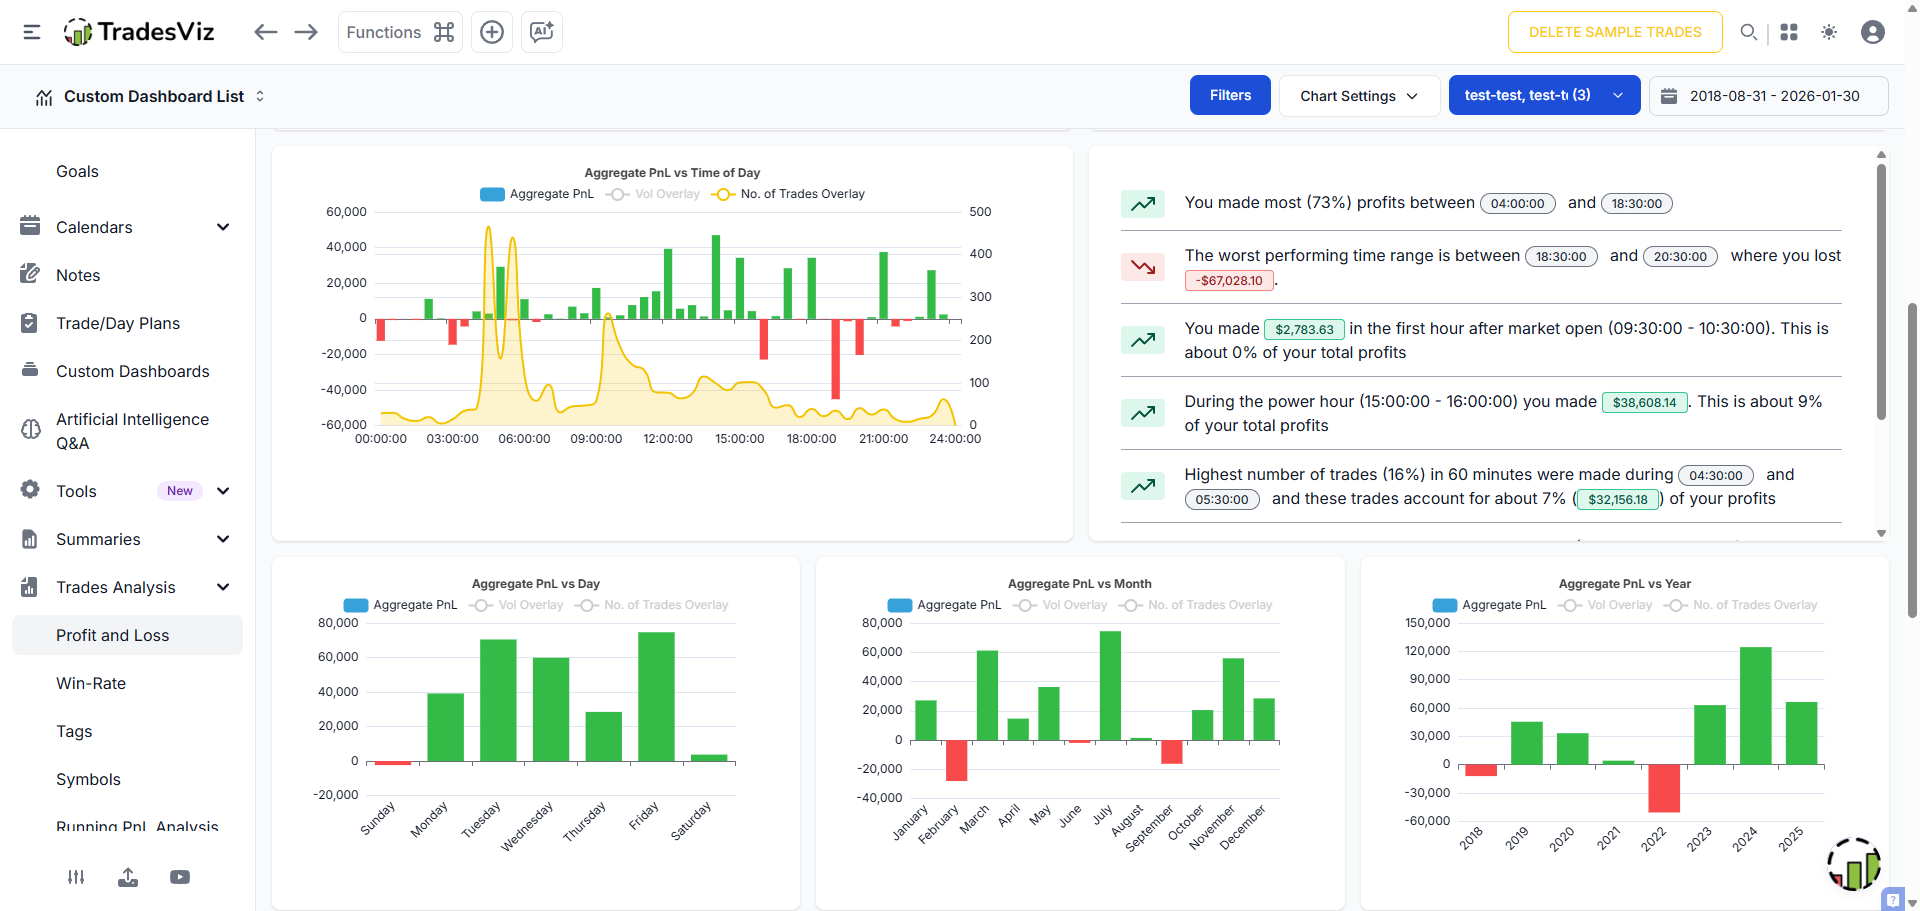
Here's something no journal will tell you.
Many of these metrics can be misleading without proper context and depth.
Other journals/gurus: "Red pnl from 10:30-11:30? stop trading that hr" 🤡
Reality: Actually, 95% of losses came from 2 trades out of 20... 🤓
TradesViz helps you get exactly the insight you need and makes you understand it :)
The journal that grows with you. 🚀
You might switch brokers, but you shouldn't have to switch journals.
TradesViz is built to handle the entire industry ecosystem. We already support the vast majority of major platforms, but we don't stop there.
If you don't see your specific platform listed, simply contact us and we will add it for you.
We are committed to ensuring your trading history remains intact, regardless of who facilitates your orders.
Your data. Your terms.
Are you capturing the move, or just a fraction of it? 🤏
The gap between your "Actual PnL" and the "Best Possible PnL" is your room for growth.
The Best Exit Dashboard calculates the theoretical maximum profit for every trade you took, allowing you to compare your performance against perfection.
The "Best Exit PnL vs Time of Day" chart (top left) helps you spot patterns: Are you consistently selling too early in the morning session while the trend continues to rip?
Don't just be profitable. Be efficient.
Stop switching tabs to do your homework. 📚
A complete trading plan requires more than just a chart. You need to know the engine under the hood.
The Fundamental Data dashboard integrates institutional-grade research directly into your workflow.
From Valuation & TTM metrics like PE Ratios and EBITDA to critical Share Structure details like Float and Short Interest, everything is accessible on a single screen.
You even get direct links to SEC 10K and 10Q Filings so you can verify the source without leaving the platform.
Streamline your research. execute with confidence.
The Feb 9 technical screen reflected sustained momentum and expanding participation across both small‑cap and mid‑cap names.
In the five‑day gainers group, $PBM led with a 388% increase and nearly 100 K shares traded, underscoring speculative strength despite lower volume change. $LIMN and $VRSSF followed with 234% and 144% gains as turnover spiked 63,000% and 11,000%, pointing to aggressive inflows. $AZN and $LITX each advanced more than 80%, the latter supported by 718 K shares, highlighting steady institutional interest. $LBTYB and $KELYB added 63% and 59% respectively, both backed by multi‑million‑percent volume explosions — clear signs of sudden liquidity expansion.
In the “continuous higher highs + green for three days" group, $FATBB drove leadership with a 96% gain, followed by $ASPS up 35%, and $FLXS at 33%. $POWL and $NVST printed 29% and 28%, maintaining consistent multi‑session uptrends. $RRX, $CING, and $LVWR added steady follow‑through with healthy volume growth.
The broad mix of names from speculative to industrials shows expanding market breadth. When such diverse price and volume acceleration persist for several sessions, it typically signals sustained momentum supported by active accumulation rather than short‑term volatility.
The Feb 9 flow screen highlighted a strong defensive rotation, with sharp increases in put‑side premiums across multiple sectors.
$RIO posted the largest move, up 27,155%, indicating heavy downside hedging in materials. $DVA and $NVS followed closely at 4,750% and 4,756%, both showing consistent three‑day build‑ups in protective flow within healthcare. $MCHP and $UUUU printed 4,771% and 2,048%, confirming similar caution in semiconductors and uranium‑linked names.
Consumer discretionary exposure also tightened, with $XLY up 504% as investors layered protection into sector ETFs. $AGQ, $PAAS, and $AVAV each showed four‑digit increases, rounding out broad defensive behavior in metals and industrials.
The $DVA trend chart showed spot strength through the session even as put intensity climbed, a textbook sign of institutional hedging rather than directional selling.
When protective premiums rise steadily over several days across unrelated sectors, it underscores portfolio‑level risk adjustments ahead of potential volatility rather than a single‑sector unwind.
The Feb 9 options flow screen showed concentrated institutional activity across commodities, energy, and semiconductors.
$GLD dominated early flow with two matched sweeps on Feb 20 $450C and $460C lines, totaling roughly $100 million in combined premium. The pairing of large buy and sell orders within seconds indicates rotational hedging around gold exposure rather than directional positioning.
$ET followed as the session’s most active single‑name, with a sequence of call sweeps on Jan 15 2027 $13C trades ranging from $11 million to $21 million each and an aggregate premium over $180 million. The repetition and uniform sizing suggest systematic accumulation by long‑dated buyers.
In semiconductors, $MU printed a $16 million Mar 20 2026 $350P sweep, while $ALB logged two $11 million put sales on Sep 18 2026 $185P, signaling adjustments in materials and tech hedges.
$TSLA’s $22 million split on Mar 6 2026 $430P showed balanced risk management after recent volatility, while $SLV and $NOW added $9–12 million in mid‑range flows, rounding out cross‑sector exposure in silver and software.