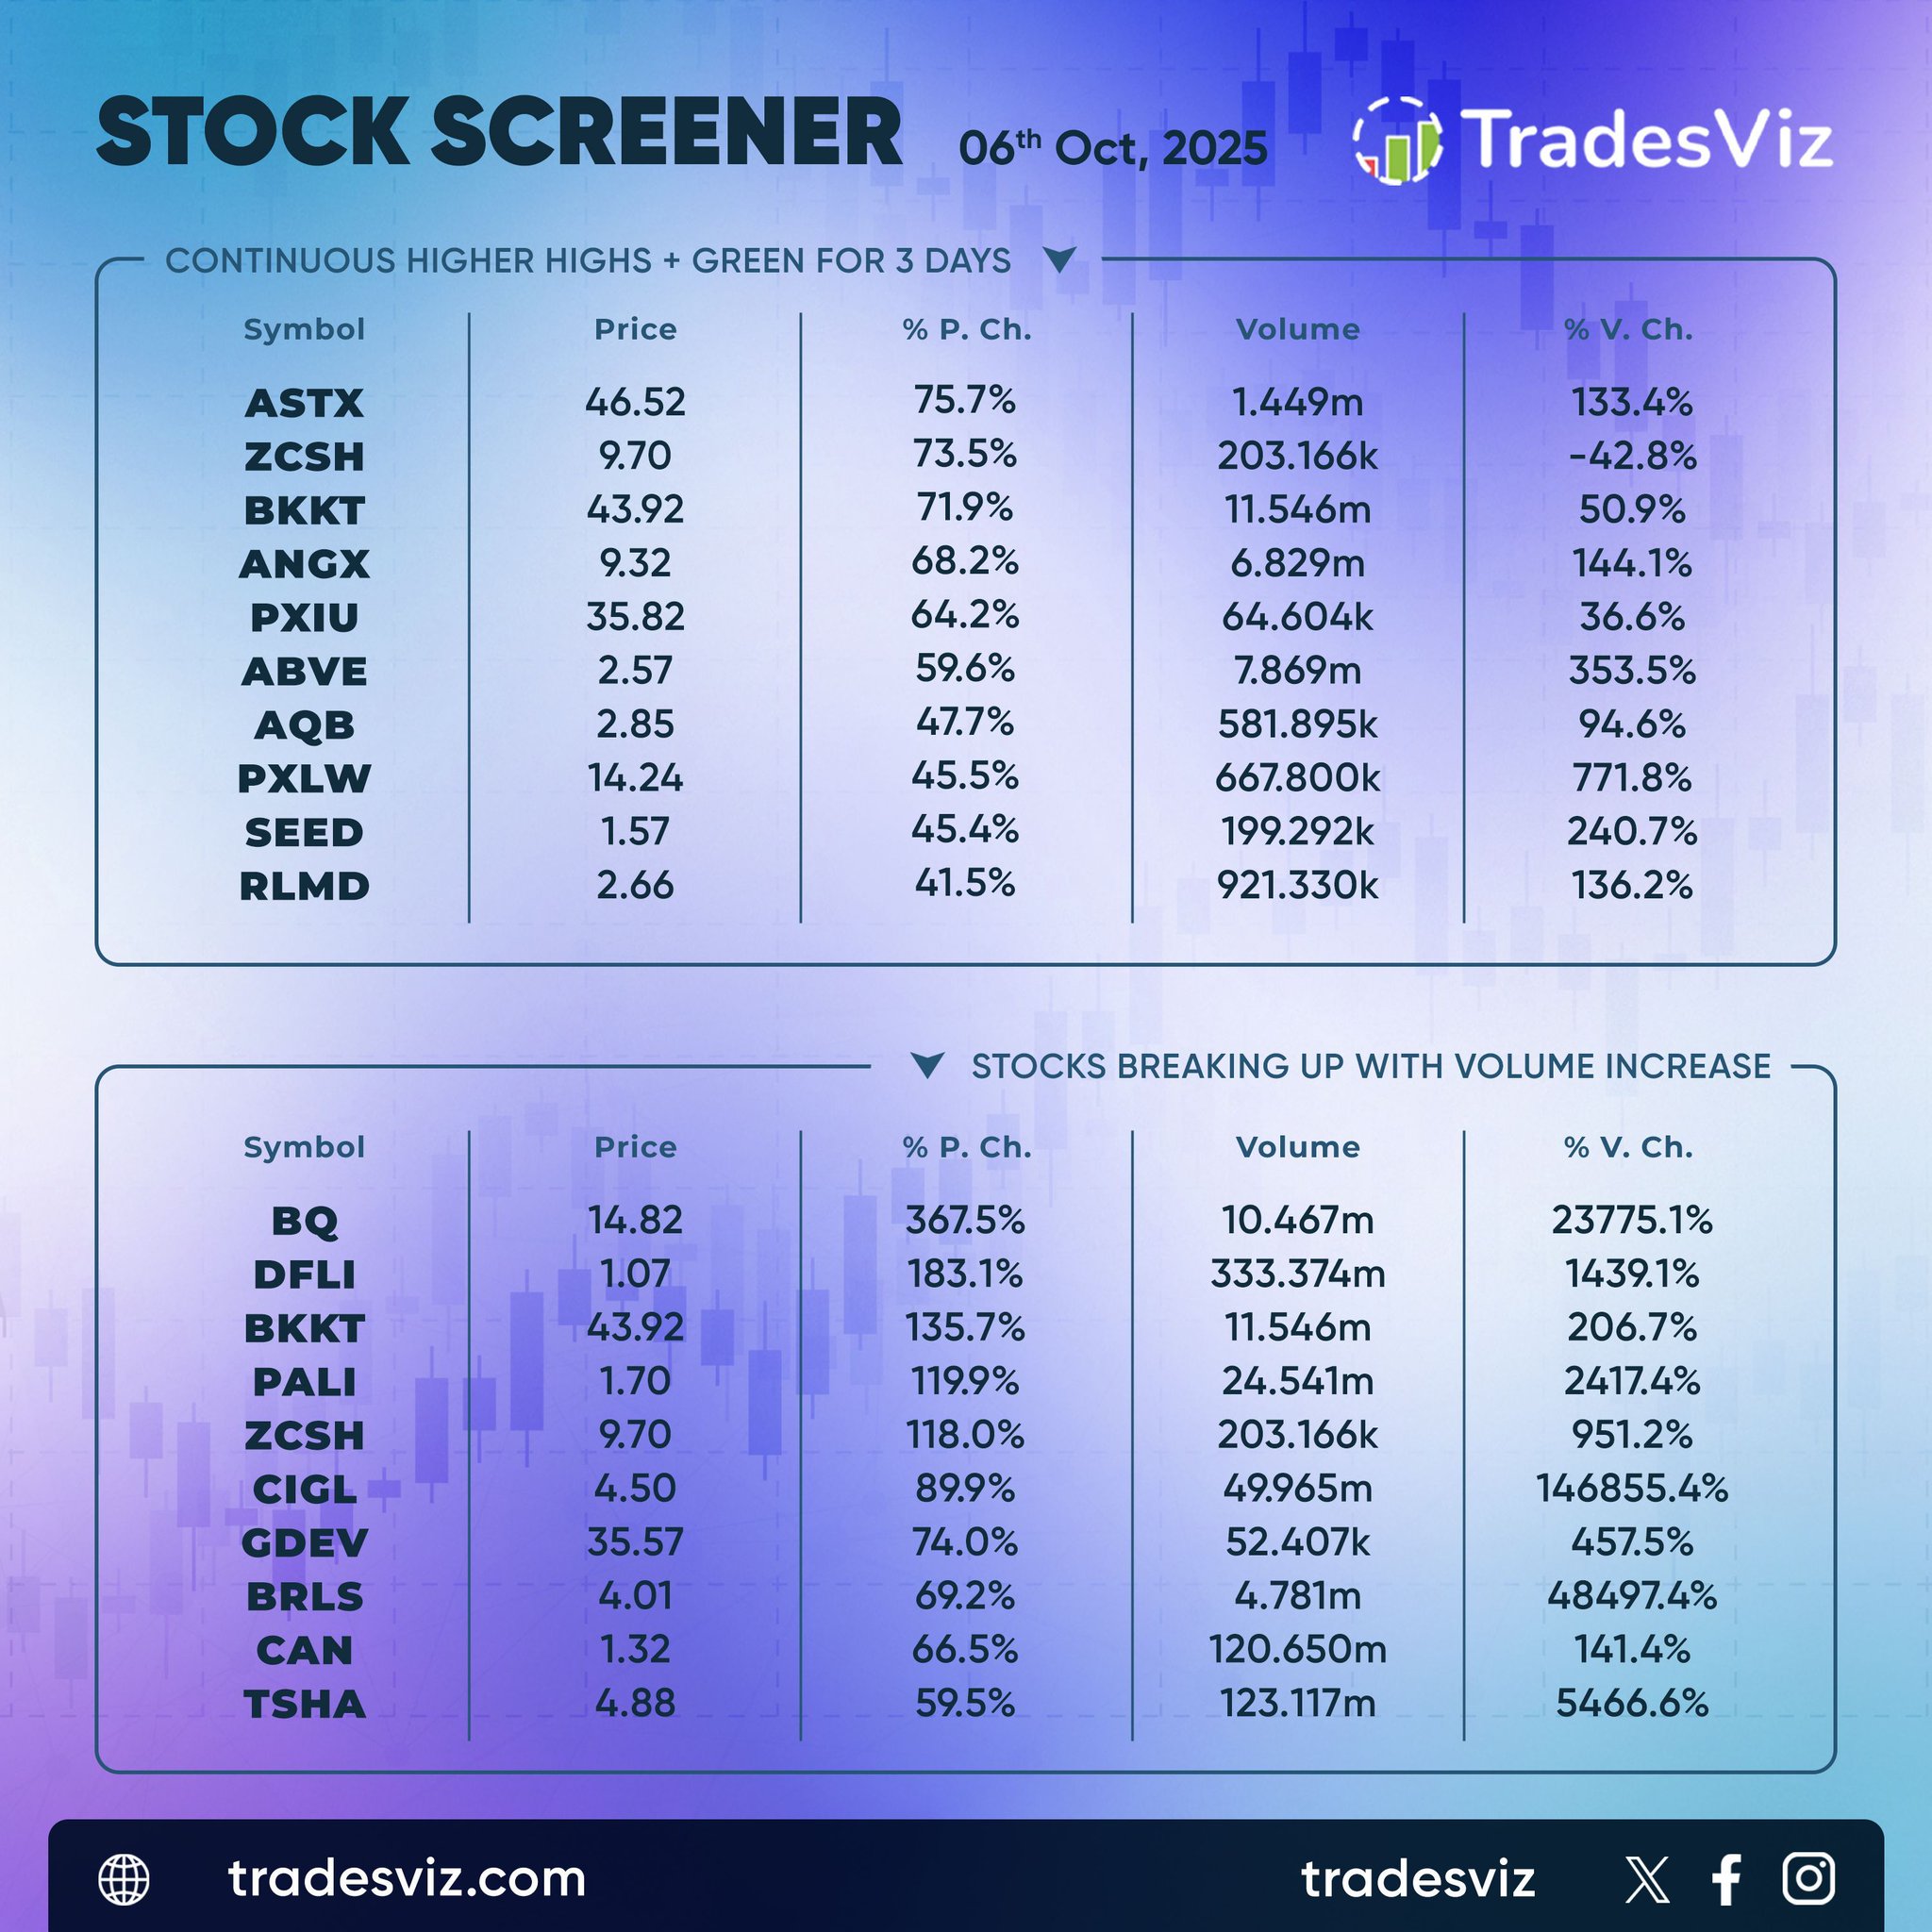
Momentum dominated the tape on Oct 6. $ASTX, $ZCSH, and $BKKT led with three consecutive green sessions and steep price extensions, confirming sustained follow‑through backed by strong volume trends.
Breakout action was concentrated in $BQ and $DFLI, which exploded with gains of over 300% and 180% respectively as volume surged at extreme multiples of prior averages.
When price and volume expand in tandem, it reflects conviction rather than short‑term noise. These setups remain firmly on the radar as strength clusters in momentum names.
Weekly reminder not to get confused between the 3:
These are ALL available in TradesViz - the only journal to have all of this under one roof!
Backtesting: Fixed automated strategy testing on one or many symbols at once
Simulation: Manual execution of trades in historical charts (bar by bar/second-by-second)
Replay: No-action replay of all your executions
Are you prepared for the coming week? 🤓
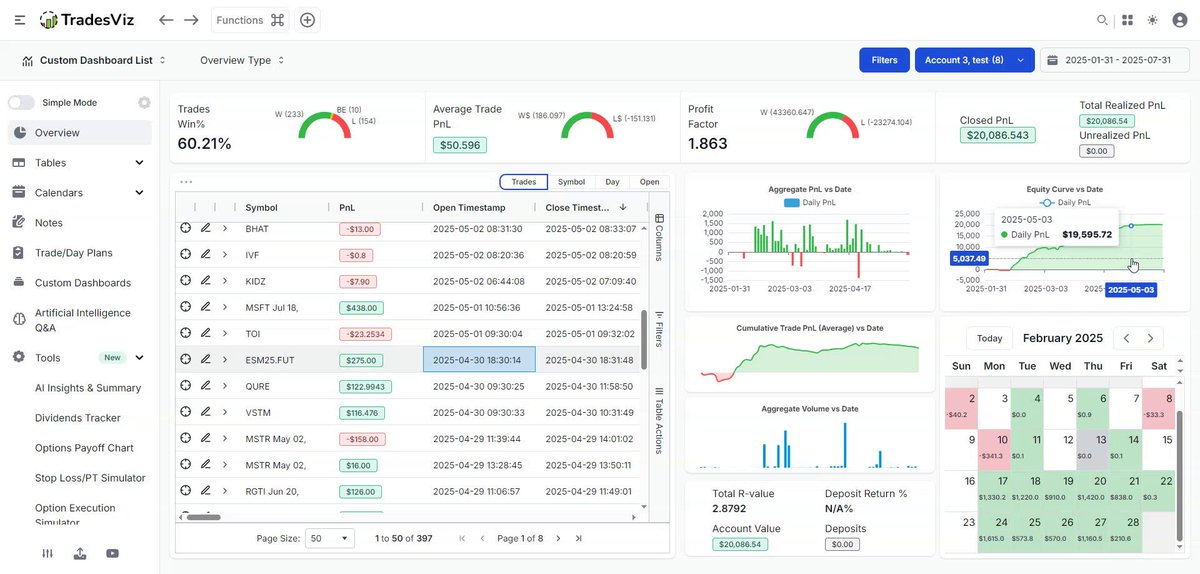
This video shows a quick list of things you can do on TradesViz trading journal to up your prep:
1. Visit day explore
2. Add tags on what type of day you think it's going to be
3. Check screener
4. Add charts/watchlist
5. Create trade plans
All this in less than 90 seconds ⏲️
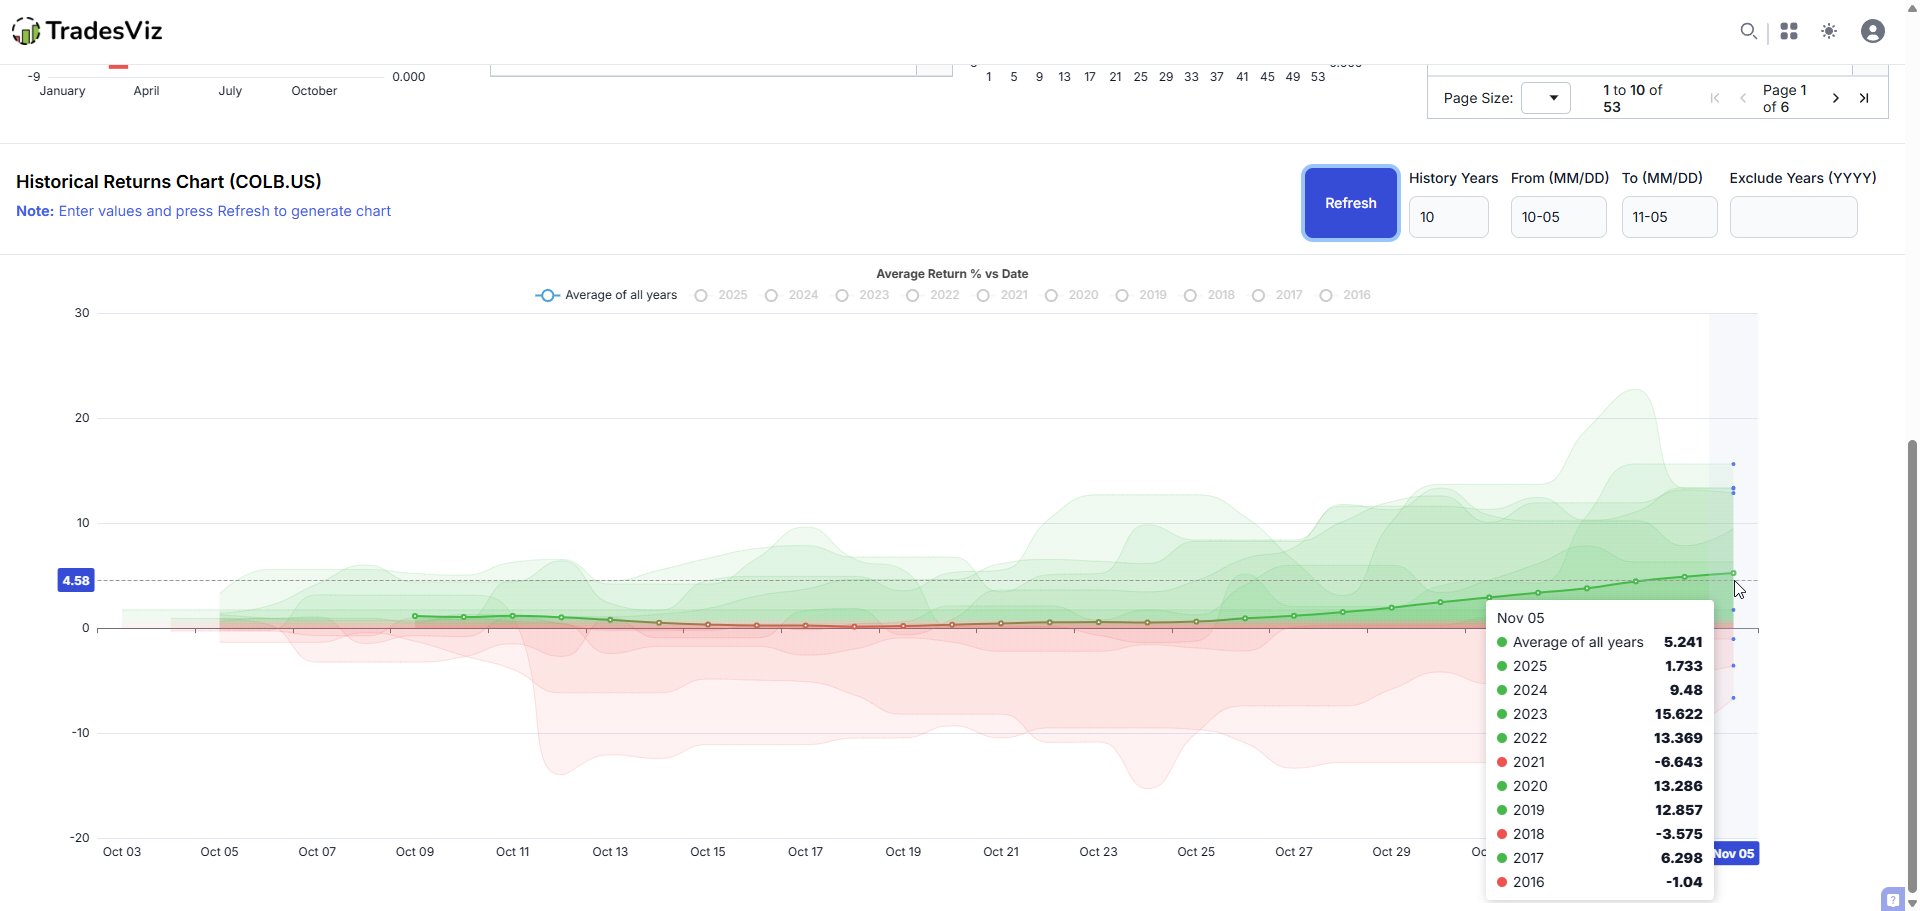
That's one very interesting seasonality returns chart.
Check the average return in dark green in the middle 👀
$COLB: Columbia Banking System Inc
Where'd we find this? TradesViz's seasonality practice mode.
There's also practice mode for fundamentals and trading simultor 🎲
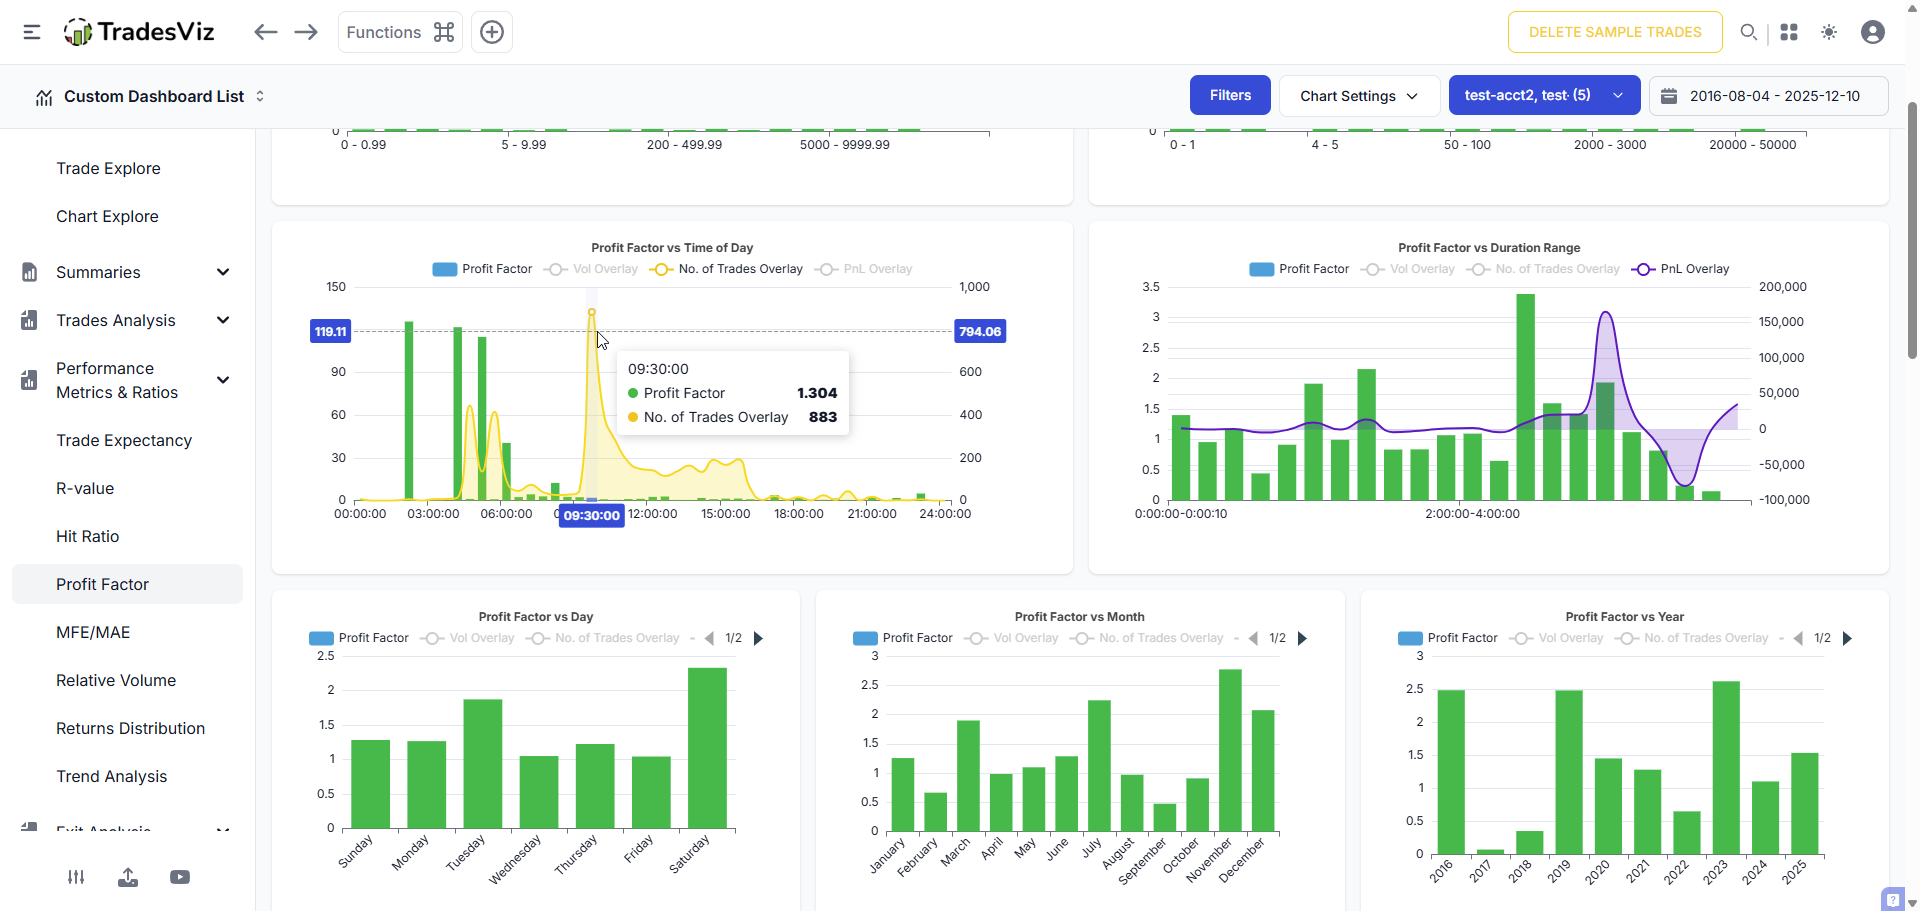
TradesViz chart of the day: R-value charts w/ no. of trades and pnl overlay.
❓ Why is this useful?
1. A higher R-value is nice, but at what cost?
2. Is your trade volume focused on the right time?
3. Are your highest effort trades yielding max effort?
Chk this screenshot👇
Notes vs Tags vs Plans
When do you use what in a trading journal?
1. Notes: When your focus is on offloading your thoughts
2. Tags: When you want to segregate content for easy analysis
3. Plans: When you want in-depth analytics on custom conditions
Examples in TradesViz 👇
What trading metric matters to you the most?...
SQN? KC? Profit factor? Std. dev?
or.. something specific and custom?
Have you adjusted the importance of KPIs as you gained more experience?
Don't ignore these. They are not complex.
They work, and they definitely will help.
Looking for new dashboard ideas?
First, check the new chart types we have on TradesViz! 📊
Write down your ideas in your notes and create 100% custom-crafted widgets to add to your custom dashboard.
Personalized trade journaling made possible with AI - only on TradesViz 👇
This one screenshot from TradesViz holds more useful info than more journals' entire dashboards. 😁
1. Win-rate vs pnl/vol/tc correlation
2. Click to explore chats
3. Automated Quick insights. Example:
"The highest number of trades (27%) in 60 minutes was made during 14:30:00 and 15:30:00, with the total average winrate being 47% and these trades account for about 14% ($14,509) of your profits"
Still not on TradesViz? The world of real, professional trade journaling and analysis awaits you...