TradesViz

TradesViz

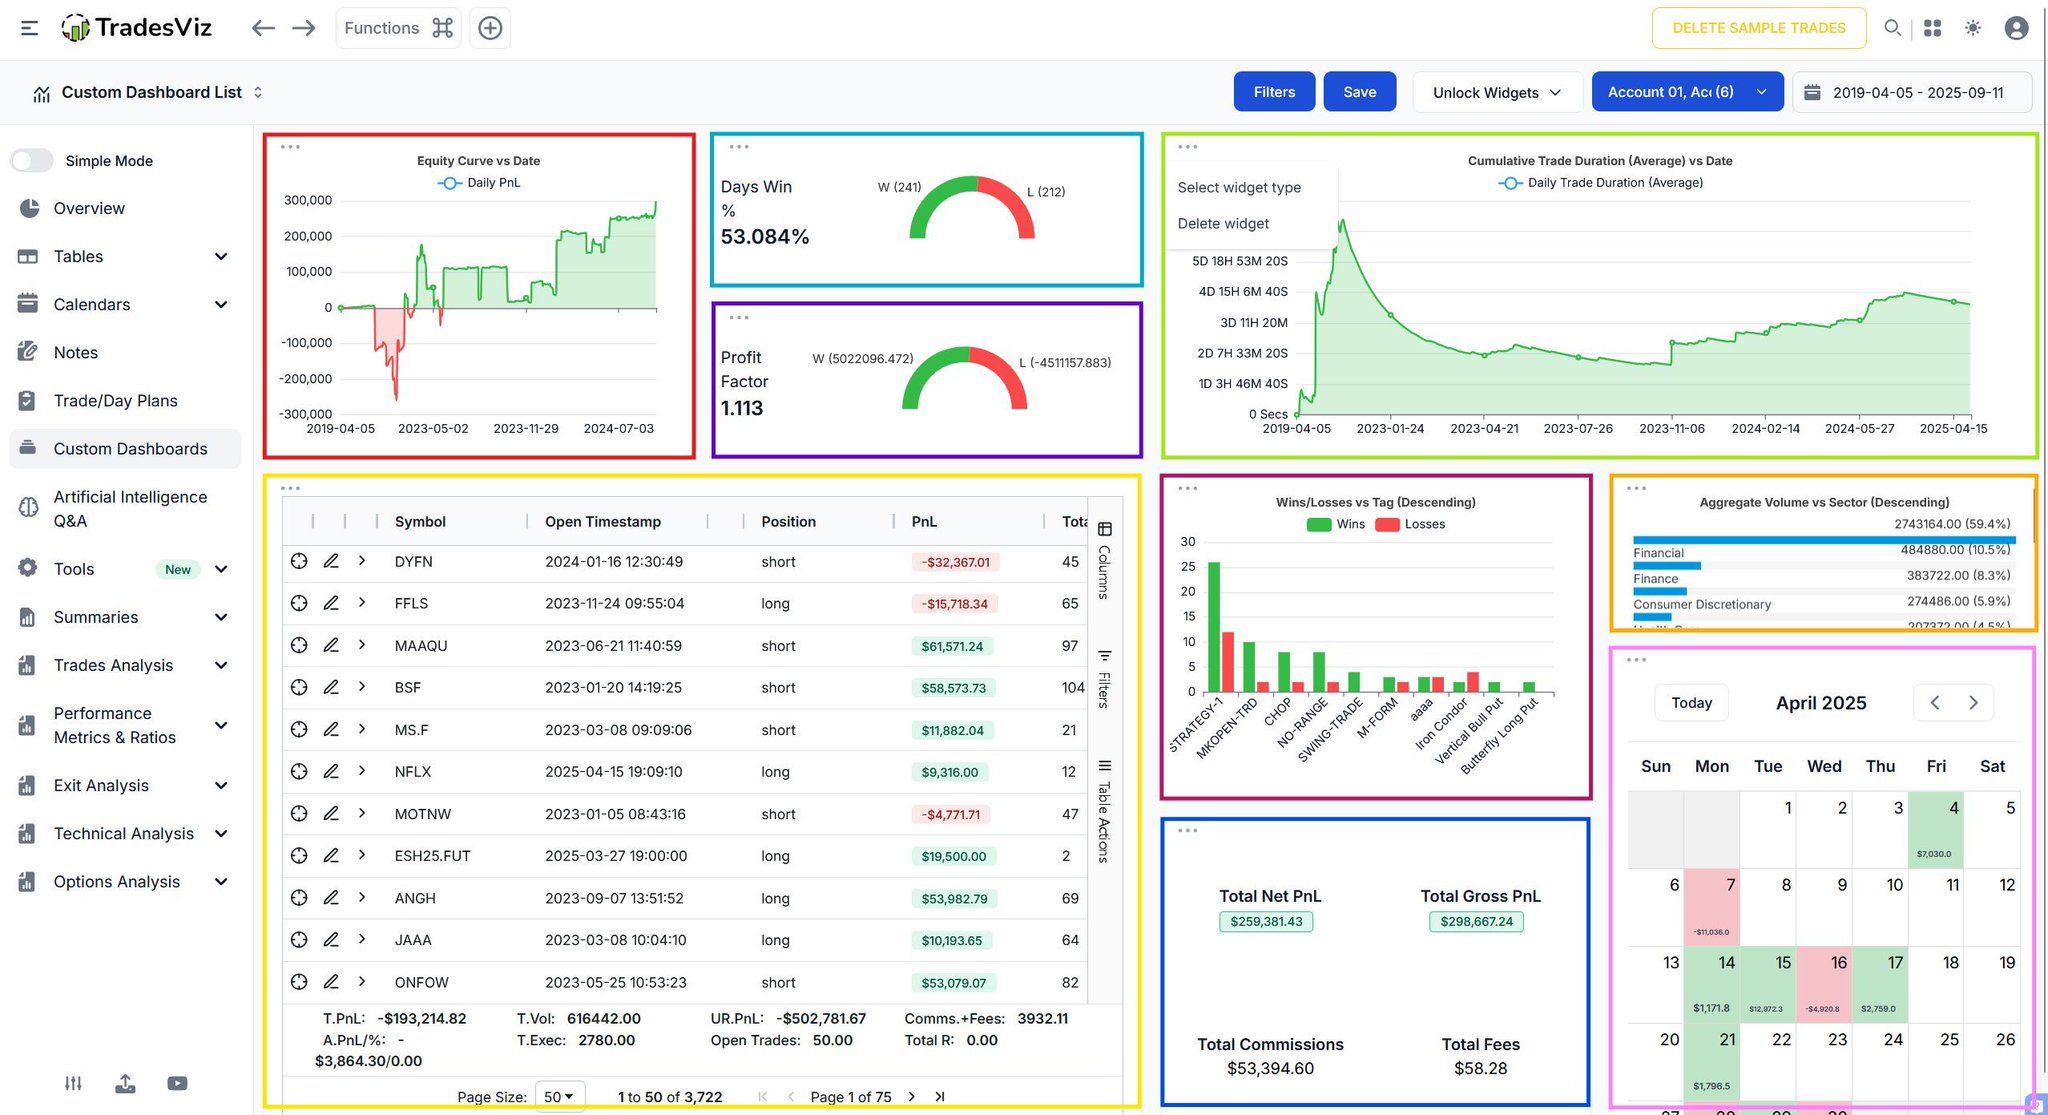
Your trading. Your layout. 🎨 The Custom Dashboard lets you build a fully personalized layout that puts everything in one place — charts, metrics, tables, calendars, performance widgets and much more! No fixed templates. No limitations. Just drag, drop, and organize the way you want to see your data. This layout? Just one example of a bento grid style in TradesViz. 💯
User-posted image
View original post
TradesViz

TradesViz

Planning your trades cannot get smoother than this! ✅ TradesViz lets you use Multi-Select conditions in your Trade Plans — so you can log multiple strategies, setups, or tags under a single item without limits. Plus, with Headers and Separators, everything stays clean, structured, and easy to follow — even on longer checklists. If you haven't updated your trade plans in a while, now’s a good time to take a look. It’s all about making the process fit your workflow. 📈

User-posted image
View original post
TradesViz

TradesViz

🎉 Update: MFE/MAE are now available for options on TradesViz trading journal! Account settings > Toggle Options MFE/MAE > Recalculate trades! This is the first time in a journal options OHLC is data is used for MFE/MAE instead of underlying! More updates coming! 👀

User-posted image
View original post
TradesViz

TradesViz

📈 Stock Screener – Sept 12th, 2025 Momentum is everywhere today 👇 $VCICW,  $PTNM, and  $RZLVW are holding 3-day streaks of higher highs with massive % gains and explosive volume spikes — some hitting 2000%+ in volume change. On the breakout side,  $WLDS,  $JBDI, and  $CAMP are lighting up with fresh highs backed by aggressive volume surges. This is the kind of flow that can signal real trend continuation. Time to take a closer look.

User-posted image
View original post
TradesViz

TradesViz

Strong sweep activity lighting up the flow screen over the past 2 days 👀 Names like  $OPEN,  $ADBE, and  $ORCL showing massive % increases in premium flow — with  $TSLA leading in total volume at 33K. Most of these trades? Bought sweeps. Aggressive and intentional. The  $TSLA chart below says it all — steady bullish premium flow lining up with price action. Keep an eye on follow-through.

User-posted image
View original post
TradesViz

TradesViz

Big moves on the tape for Sept 12th 👀 Top sweeps flowing into  $DKS,  $GFI, and  $SE — all with $14M+ premiums stacking up around near-term expiries. $PLTR continues to show steady split flow, while  $TSLA and  $FXI attract chunky orders with both size and frequency. This isn’t noise — it's positioning. And the TradesViz options flow tracker makes it easy to see who's leaning in, and where.

User-posted image
View original post
TradesViz

TradesViz

Trading correlations that just *click* are a click away on TradesViz. This is how traders are getting ahead in 2025. 🛠️ Options enhancement update launching tomorrow! TradesViz is THE choice if you need extensive journaling, anlaysis, simulation and more in ONE package 👇

User-posted image
View original post
TradesViz

TradesViz

Variation of risk-taking capability and the outcome based on time of day is shown here 👇 A very clear trend... 👀 What happens as the time of day progresses?... TradesViz is the only journal that is capable of showing you useful stats no matter what level of trader you are

User-posted image
View original post
TradesViz

TradesViz

Ever wanted to practice options trading without the risk? The Options Chain Simulator in TradesViz lets you build, place, and manage virtual options trades inside a real-time market replay—just like you would on a live platform. Watch the price action unfold, place paper multi-leg orders, test strategies, and see how they play out over time. No pressure. Just pure learning—with real data and full control. Great tool if you're learning options... even better if you're testing edge.

User-posted image
View original post
TradesViz

TradesViz

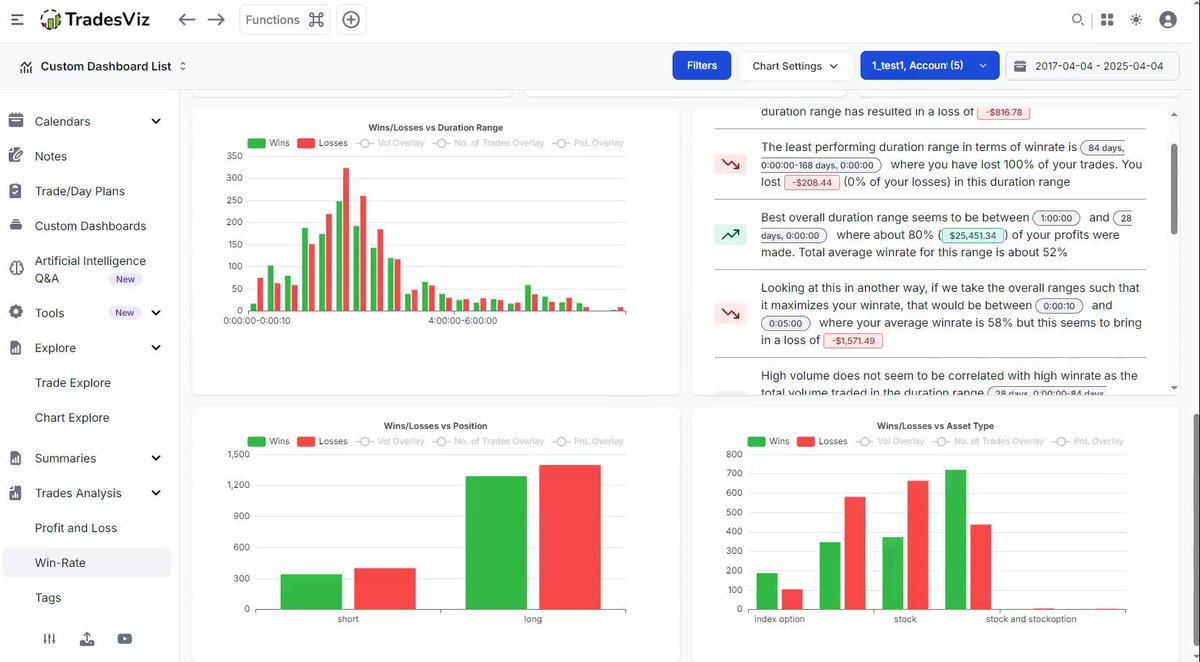
Ever wonder where your trades are really working? The Trades Analysis section in TradesViz breaks it all down — by price range, volume range, time of day, and more. You’ll see detailed stats alongside clear visuals: best and worst performing zones, profit concentrations, and loss-heavy conditions. No need to guess anymore. These charts tell you when and where you're making (or losing) money — and they do it with your actual data. It’s not just performance tracking. It’s actionable, pattern-driven insight.

User-posted image
View original post