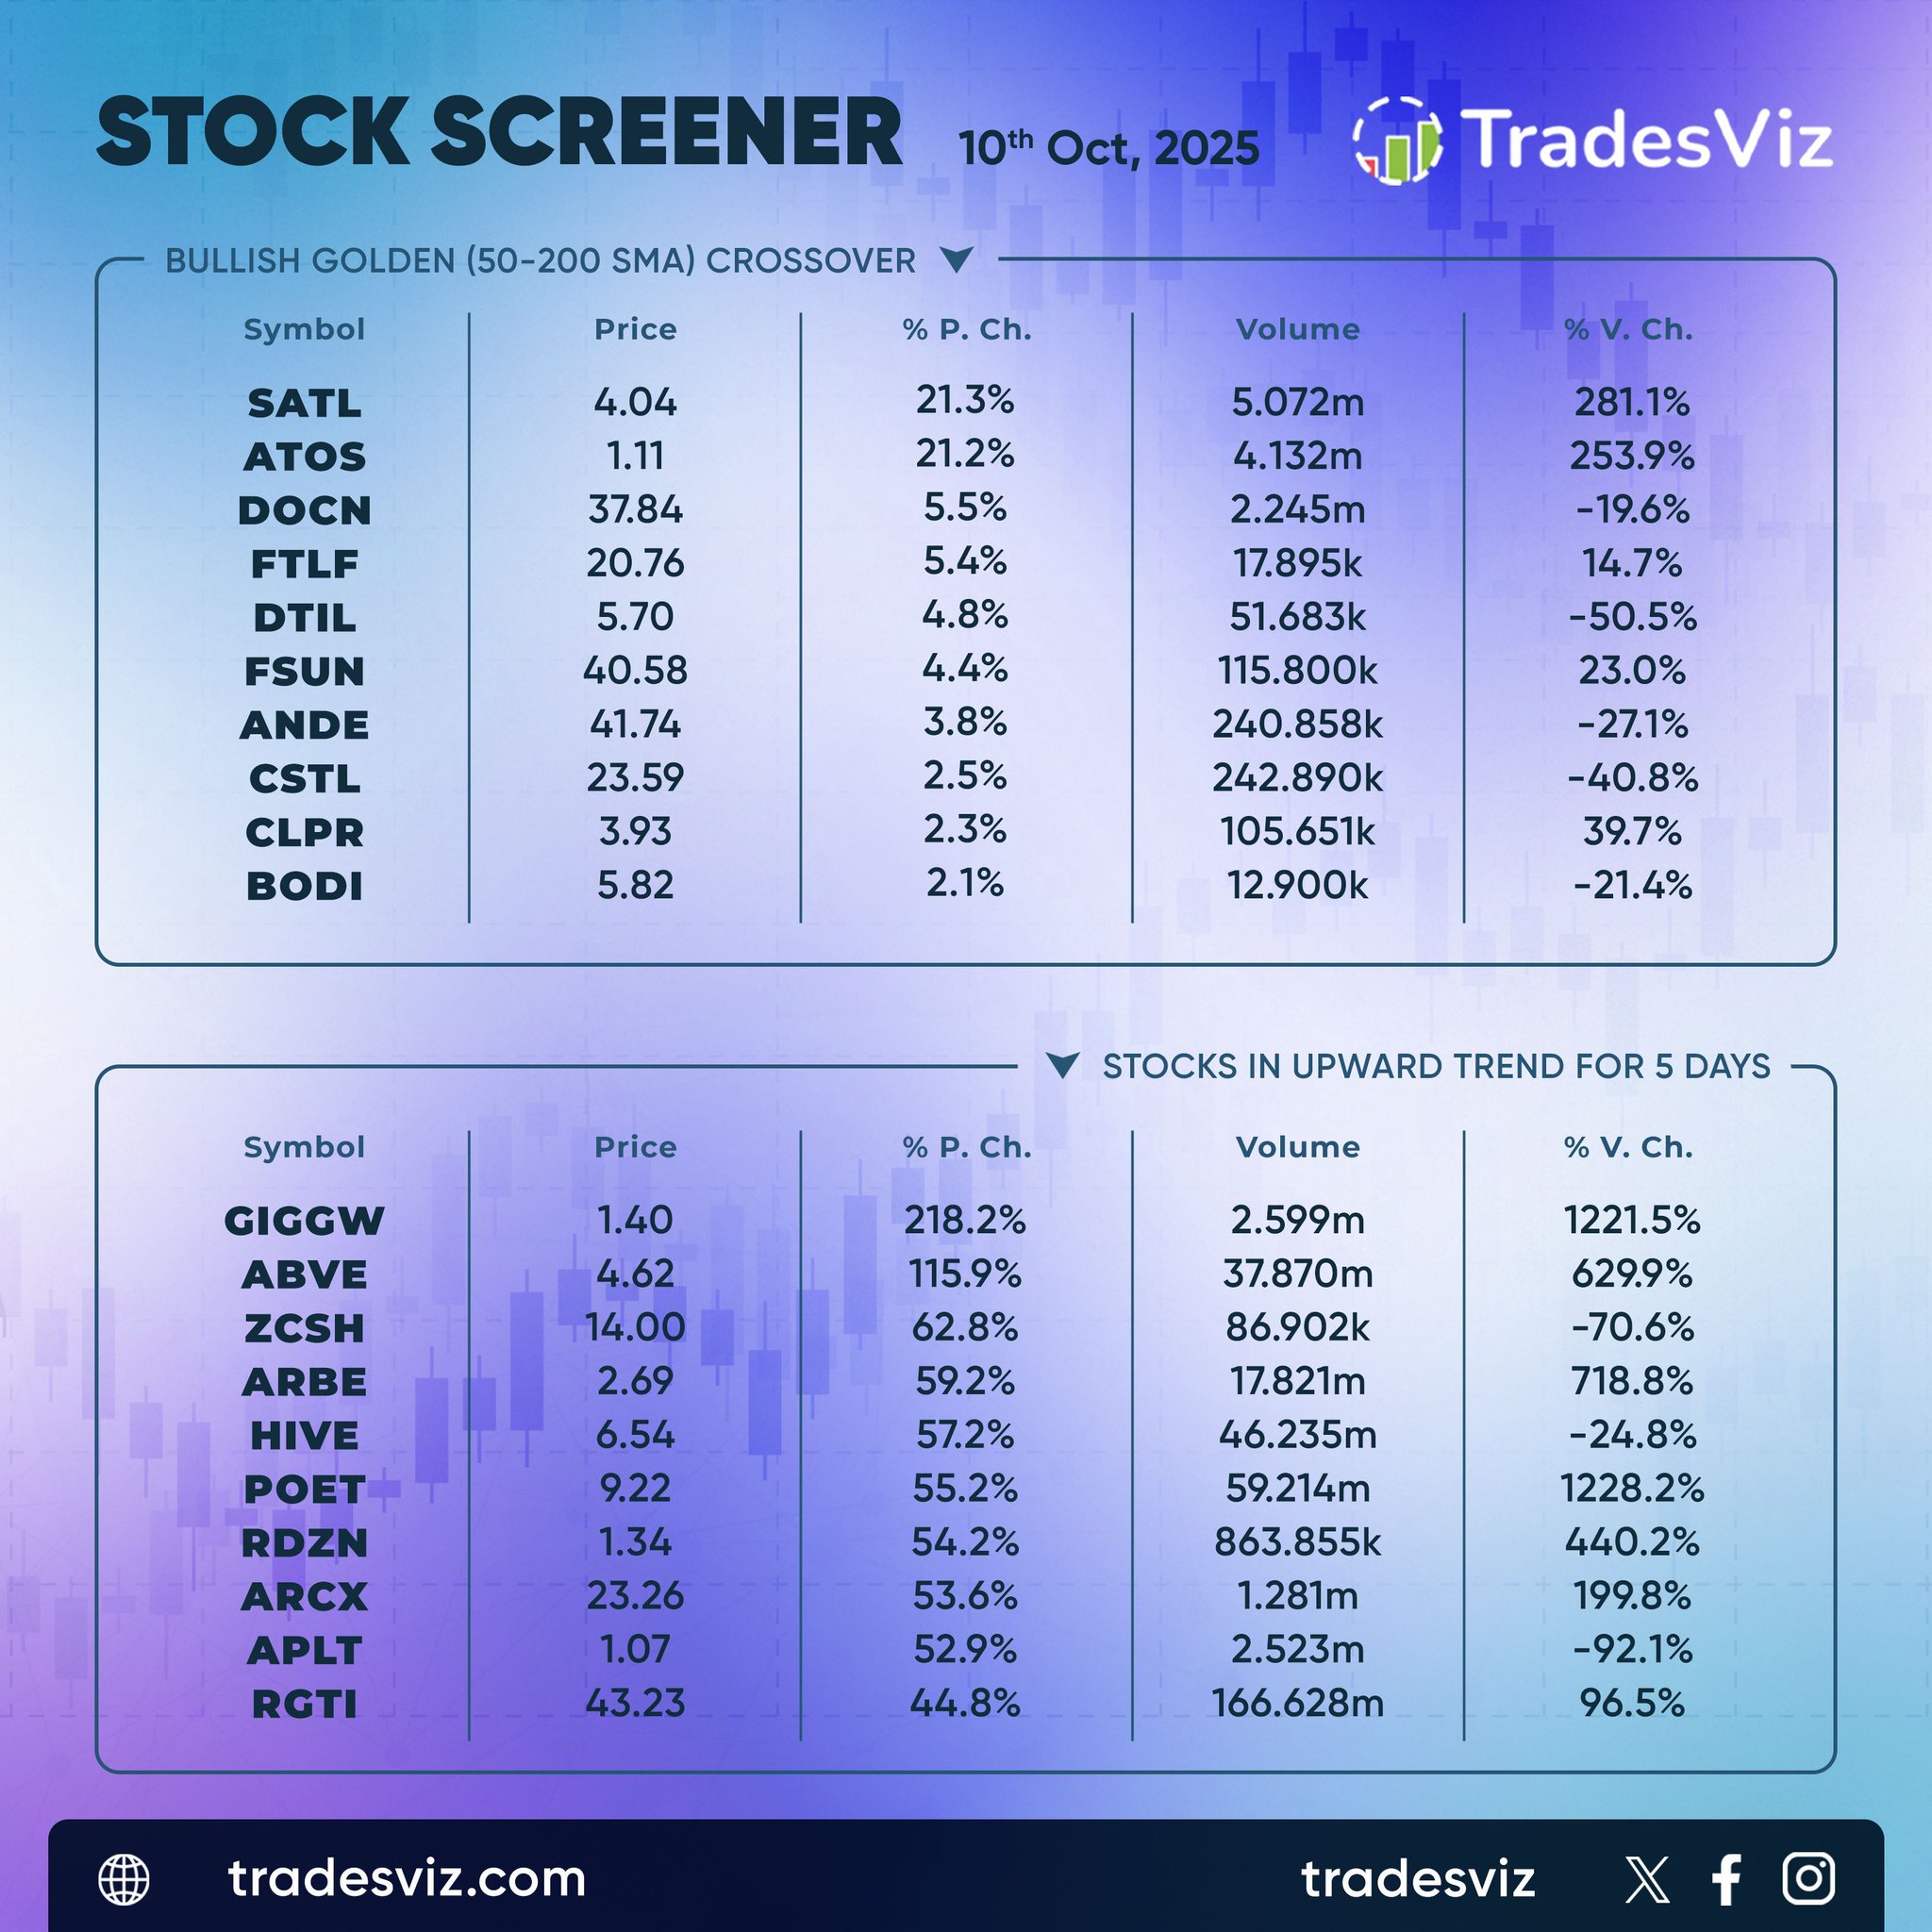
Momentum names dominated the Oct 10 tape as multiple small‑caps triggered bullish 50/200 SMA crossovers. $SATL and $ATOS led with over 21% gains apiece and volume surging more than 250%.
while $DOCN and $FTLF followed with steady continuation patterns. Rising volume alongside clean moving‑average alignment signals sustained demand building beneath these setups.
In sustained uptrends, $GIGGW and $ABVE exploded with triple‑digit percentage gains, up 218% and 115% respectively, alongside 600–1200% volume expansions. $ZCSH, $ARBE, and $HIVE also showed extended five‑day rallies supported by heavy turnover.
When short‑term crossovers align with multi‑session momentum clusters, it often reflects accumulation cycles establishing early leadership into the next leg higher. The tape remains decisively risk‑on.
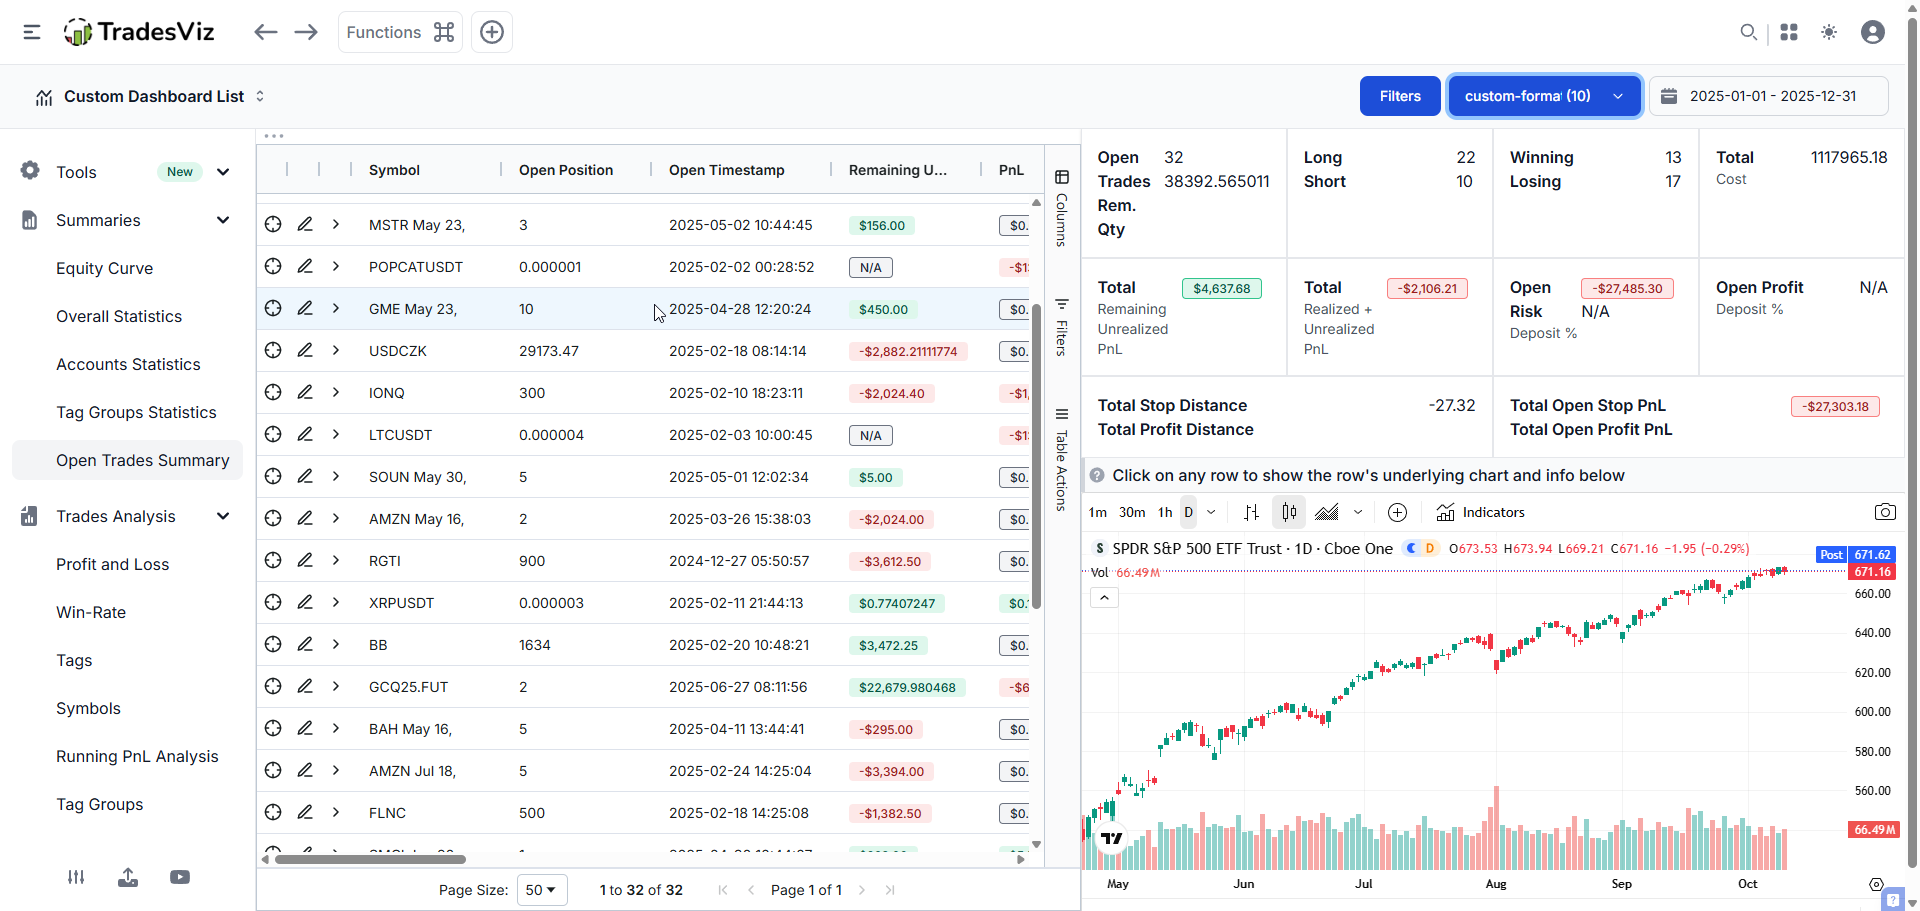
Important feature for ALL swing traders: Open summary
This tab in TradesViz shows you ALL your open positions, unrealized pnl, total pnl, distance to stop/profit, etc., along with the delayed chart.
+ Easy to search & manage positions
+ Quick to add notes
Every tab has dozens of uses in TradesViz.
If you think it's complex, well... all we can say is, it's really not 😅 and it's *highly* worth it to learn it😁
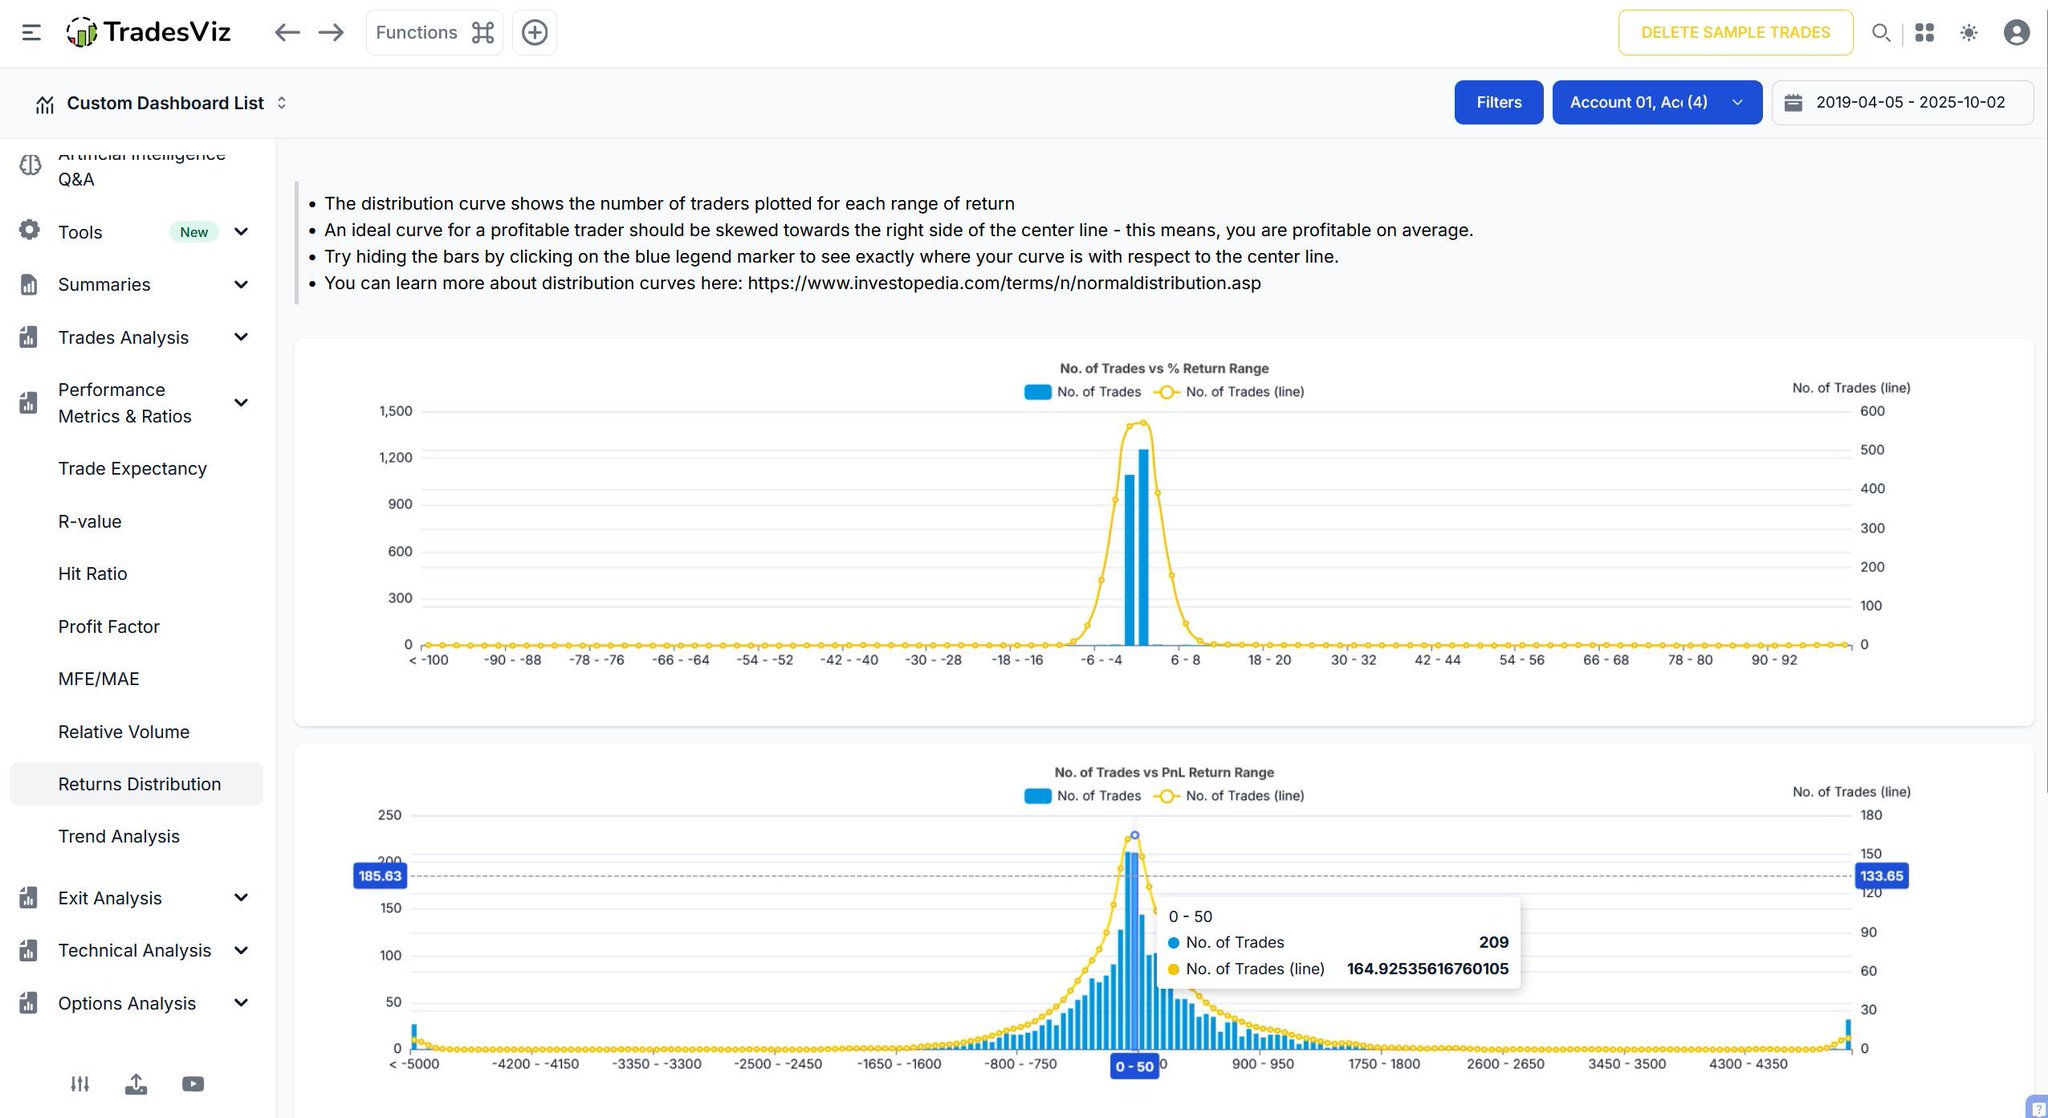
The Returns Distribution view in TradesViz visualizes how your trade outcomes cluster around performance ranges with precision 📊
Each curve highlights where conviction concentrated — whether profits piled in on the right of the center line or drawdowns weighed the tape to the left.
It’s a clear snapshot of balance, consistency, and skew in your execution outcomes 📈
By isolating ranges and comparing account groups, you can see how your edge behaves across time and instruments, keeping PnL stability and opportunity firmly on the radar 🔎
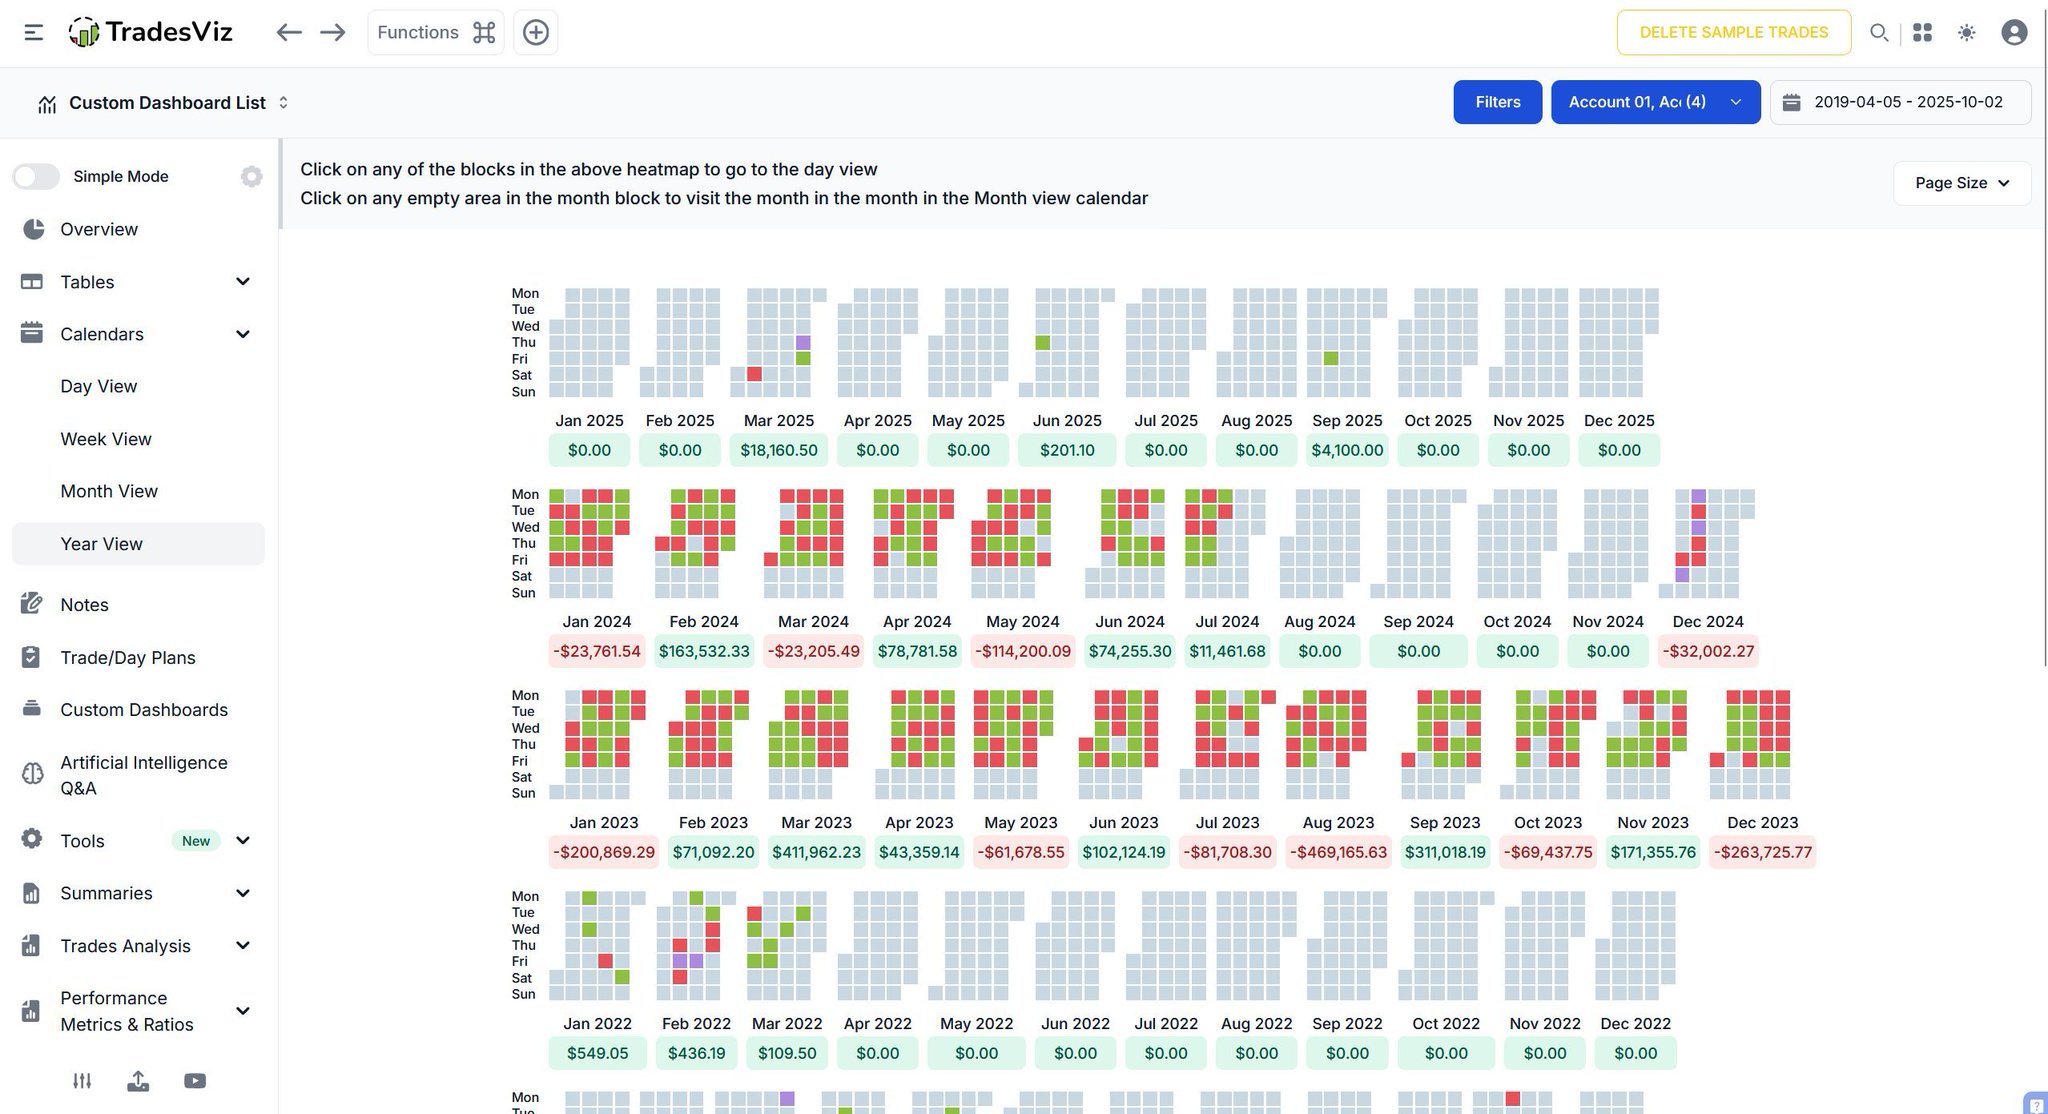
The Calendar Year View in TradesViz turns months of trading history into a clean, visual performance map 📊
Each block represents a day — lighting up in green or red to show how the tape evolved over time, from strong conviction runs to quieter stretches of consolidation.
With a single glance, you can trace performance streaks, PnL trends, and positioning across multiple years 📈
It’s a powerful way to keep long-term rhythm and consistency on the radar, turning raw results into a structured story of market engagement and discipline 🔎
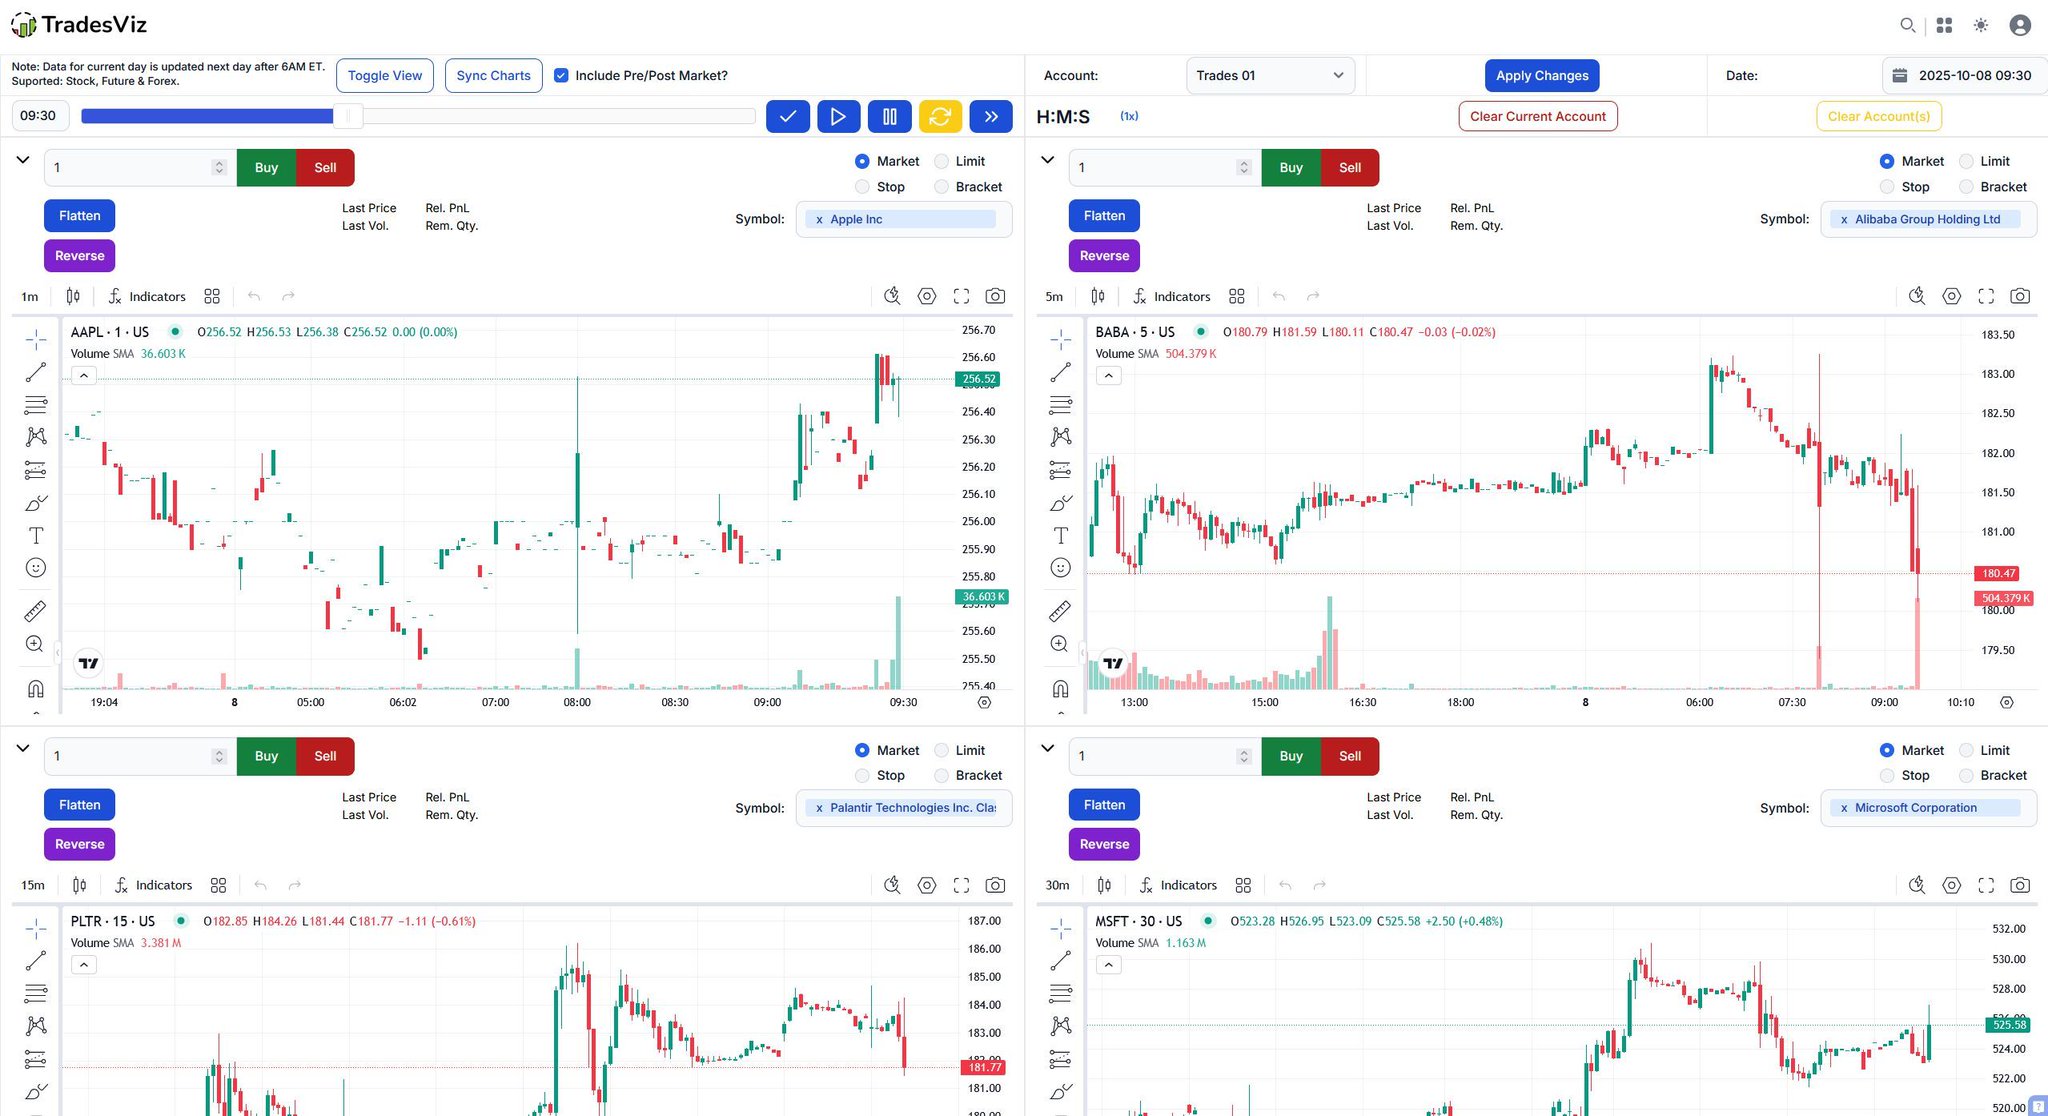
The Multi Simulator in TradesViz brings powerful comparative insight to trade testing and scenario analysis 📊
Run multiple simulations side by side — adjusting stop levels, profit targets, and market conditions — to see how conviction and positioning would have evolved across symbols.
The tape lights up with clarity as each panel reveals variations in flow, recovery, and execution efficiency 📈
It’s a structured way to explore risk and reward dynamics without guesswork, helping you refine strategy parameters and keep every possible outcome on the radar 🔎
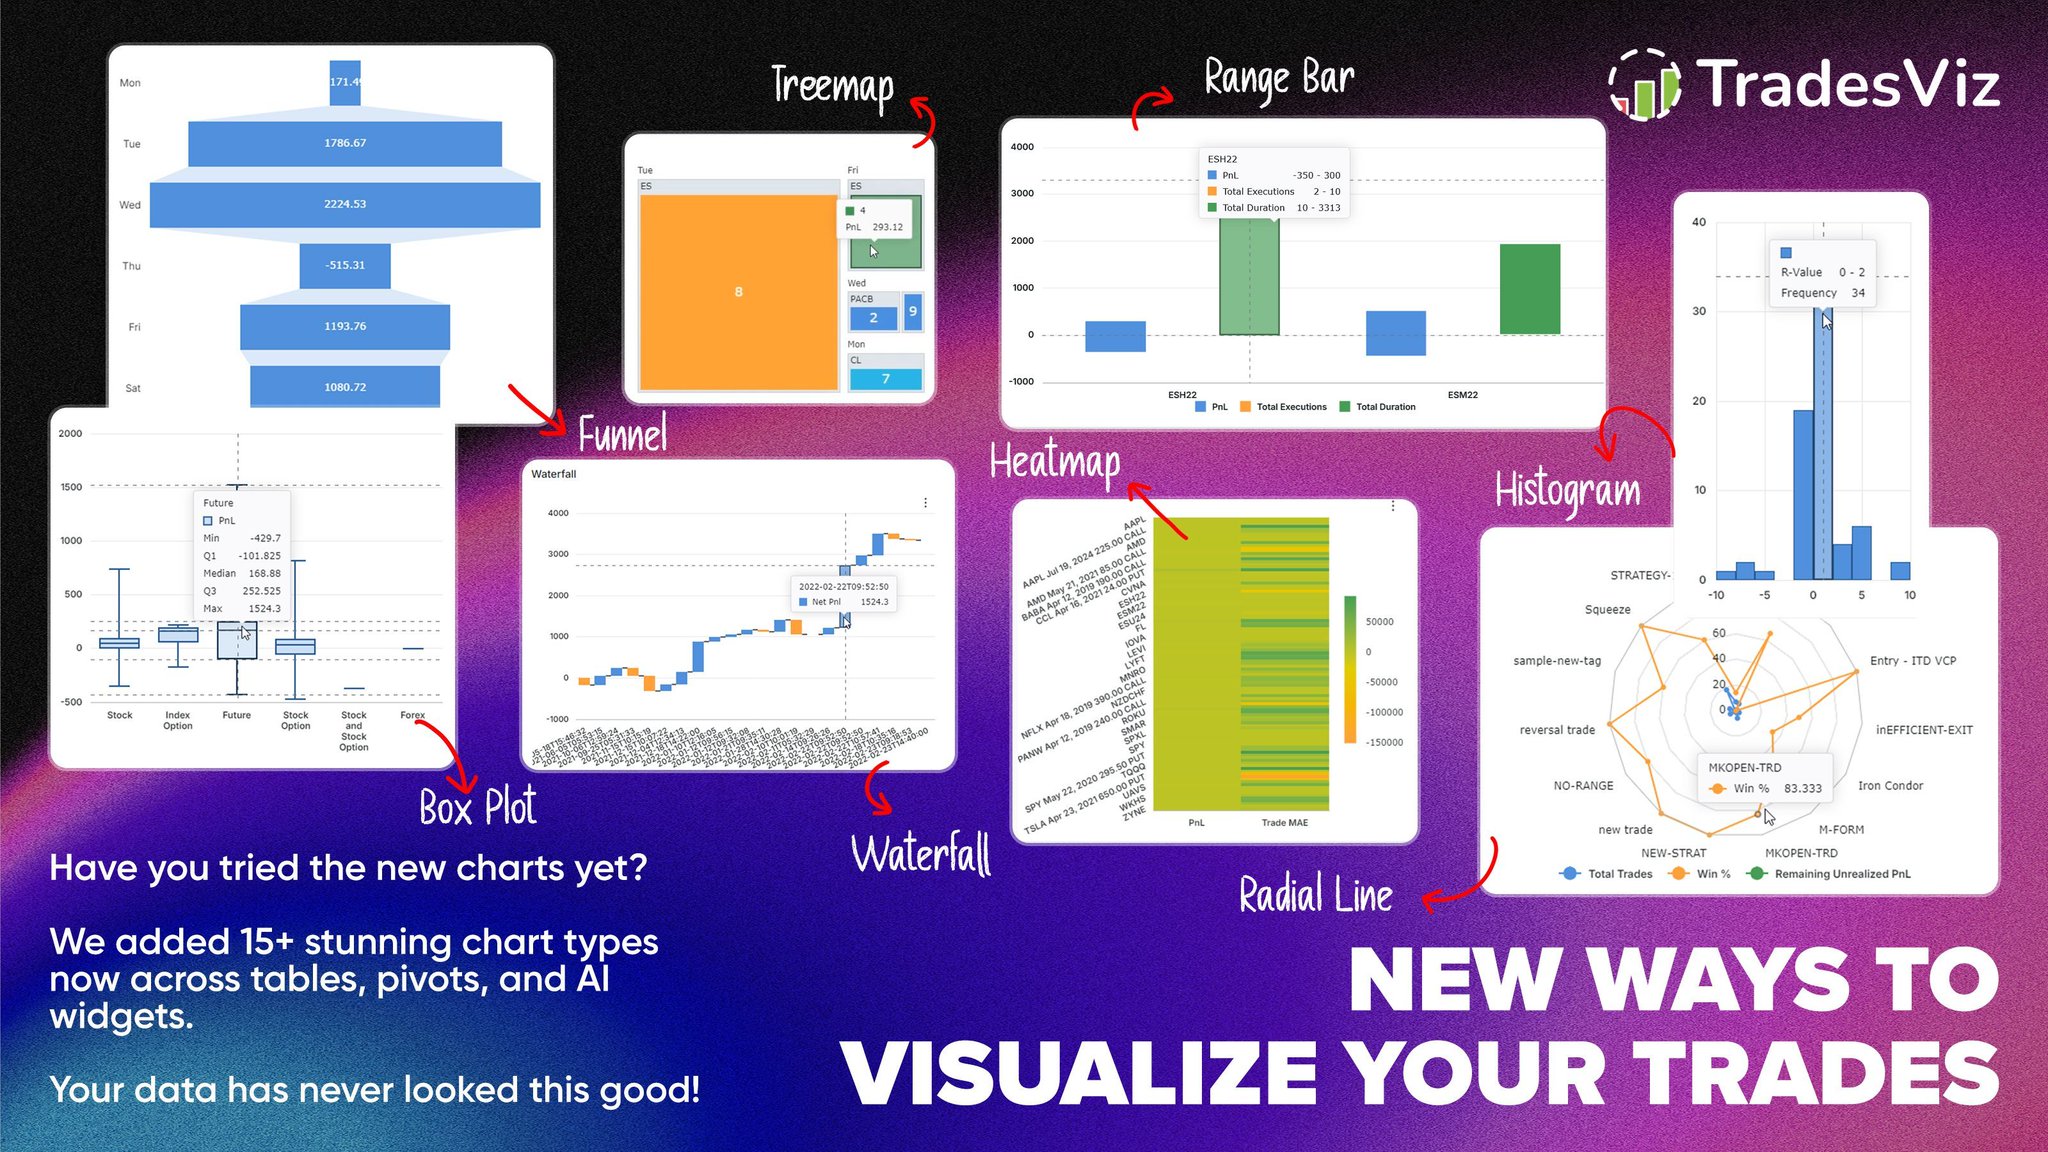
TradesViz introduced a new dimension to trade visualization with over 15 advanced chart types available across tables, pivots, and AI widgets 📊
From box plots to treemaps, heatmaps, funnels, and radial charts, every format brings a fresh lens to performance analysis.
The tape lights up with clarity when data is visualized in forms that capture conviction, scale, and flow with precision 📈
It’s not just about new charts — it’s about turning every metric into a story of positioning, efficiency, and momentum. Your trades have never looked this insightful 🔎
A new comprehensive blog post on R-value, profit factor, and how you can use and benefit from them.
➕ Includes plenty of examples using the TradesViz trading journal.
✅ Real-world problem examples with step-by-step solutions and clear explanations.
Read now 👇
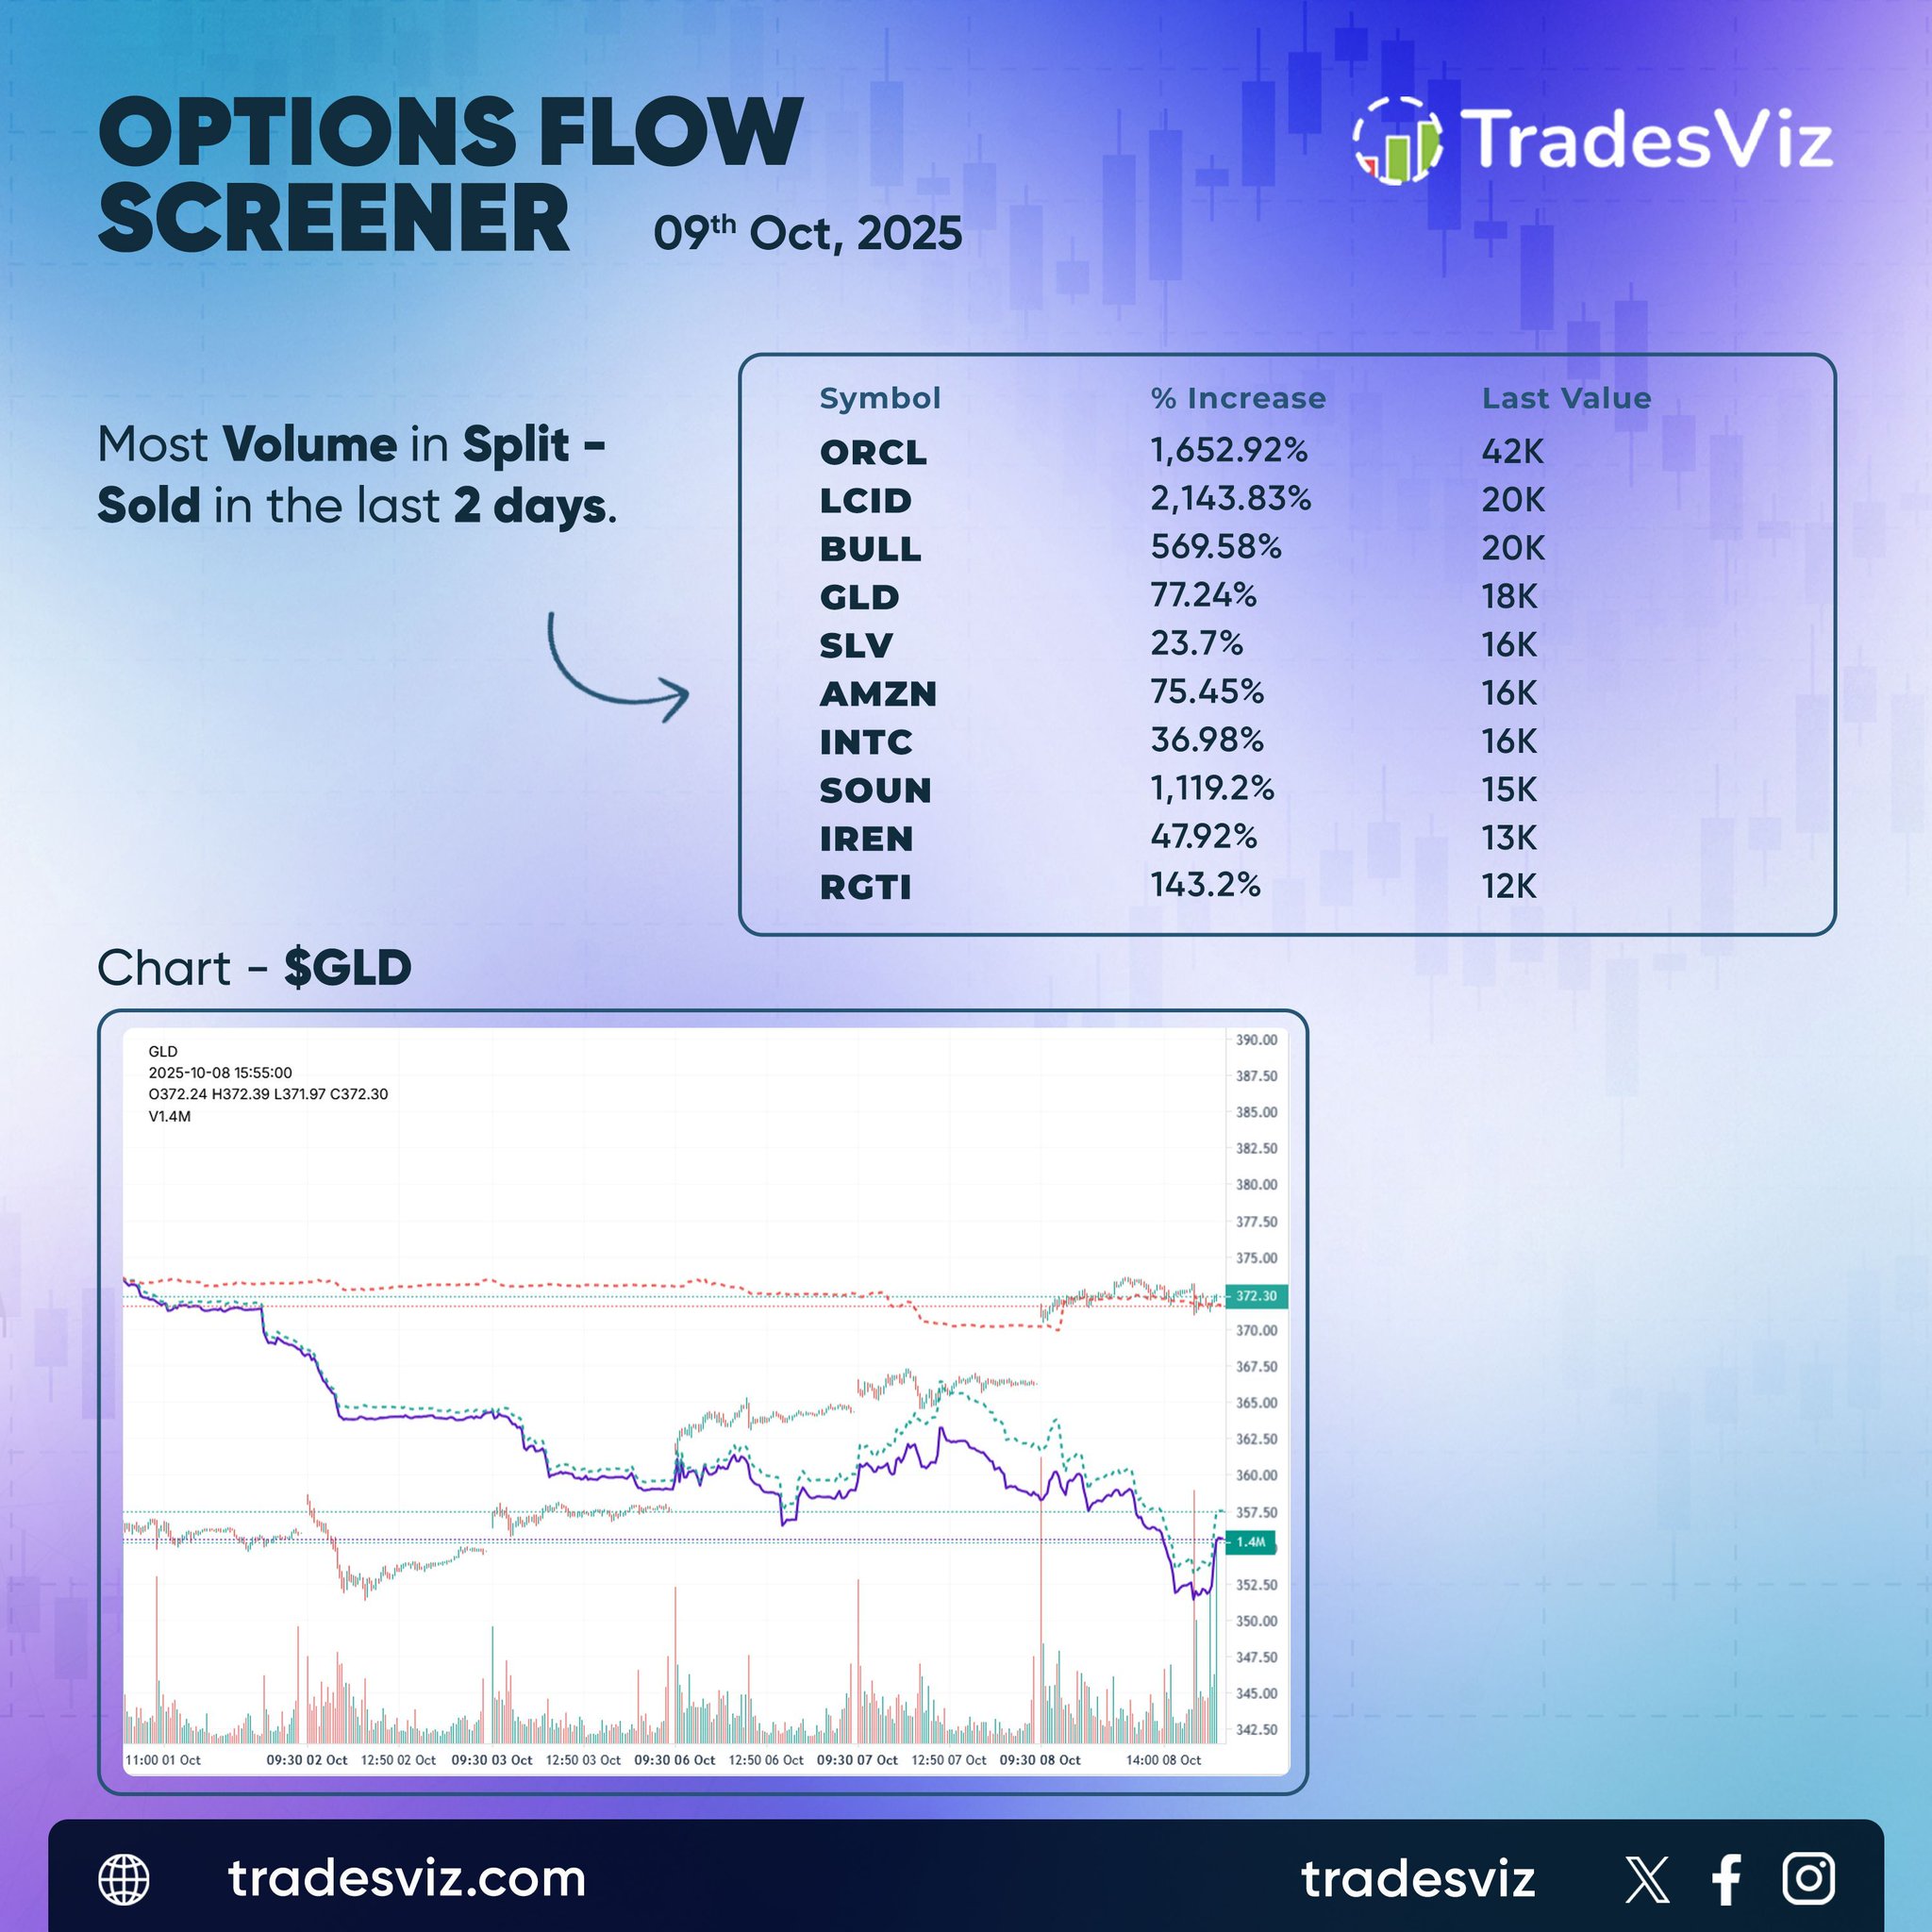
Split‑side flow surged into Oct 9 with volume rising sharply across several large‑cap names. $ORCL and $LCID dominated with increases of 1,652% and 2,143% respectively, marking the heaviest sell‑side activity of the past two sessions.
$SOUN and $IREN also posted multi‑hundred‑percent spikes, showing capital rotation out of high‑beta tech.
$GLD showed quieter but steady flow with a 77% increase, while price weakened into the afternoon before stabilizing, hinting at tactical profit‑taking rather than full liquidation. $AMZN and $INTC rounded out the list with modest but consistent participation.
When split volume builds this aggressively across sectors, it often signals systematic rebalancing rather than reactive selling. The tape points to rotation, not capitulation.
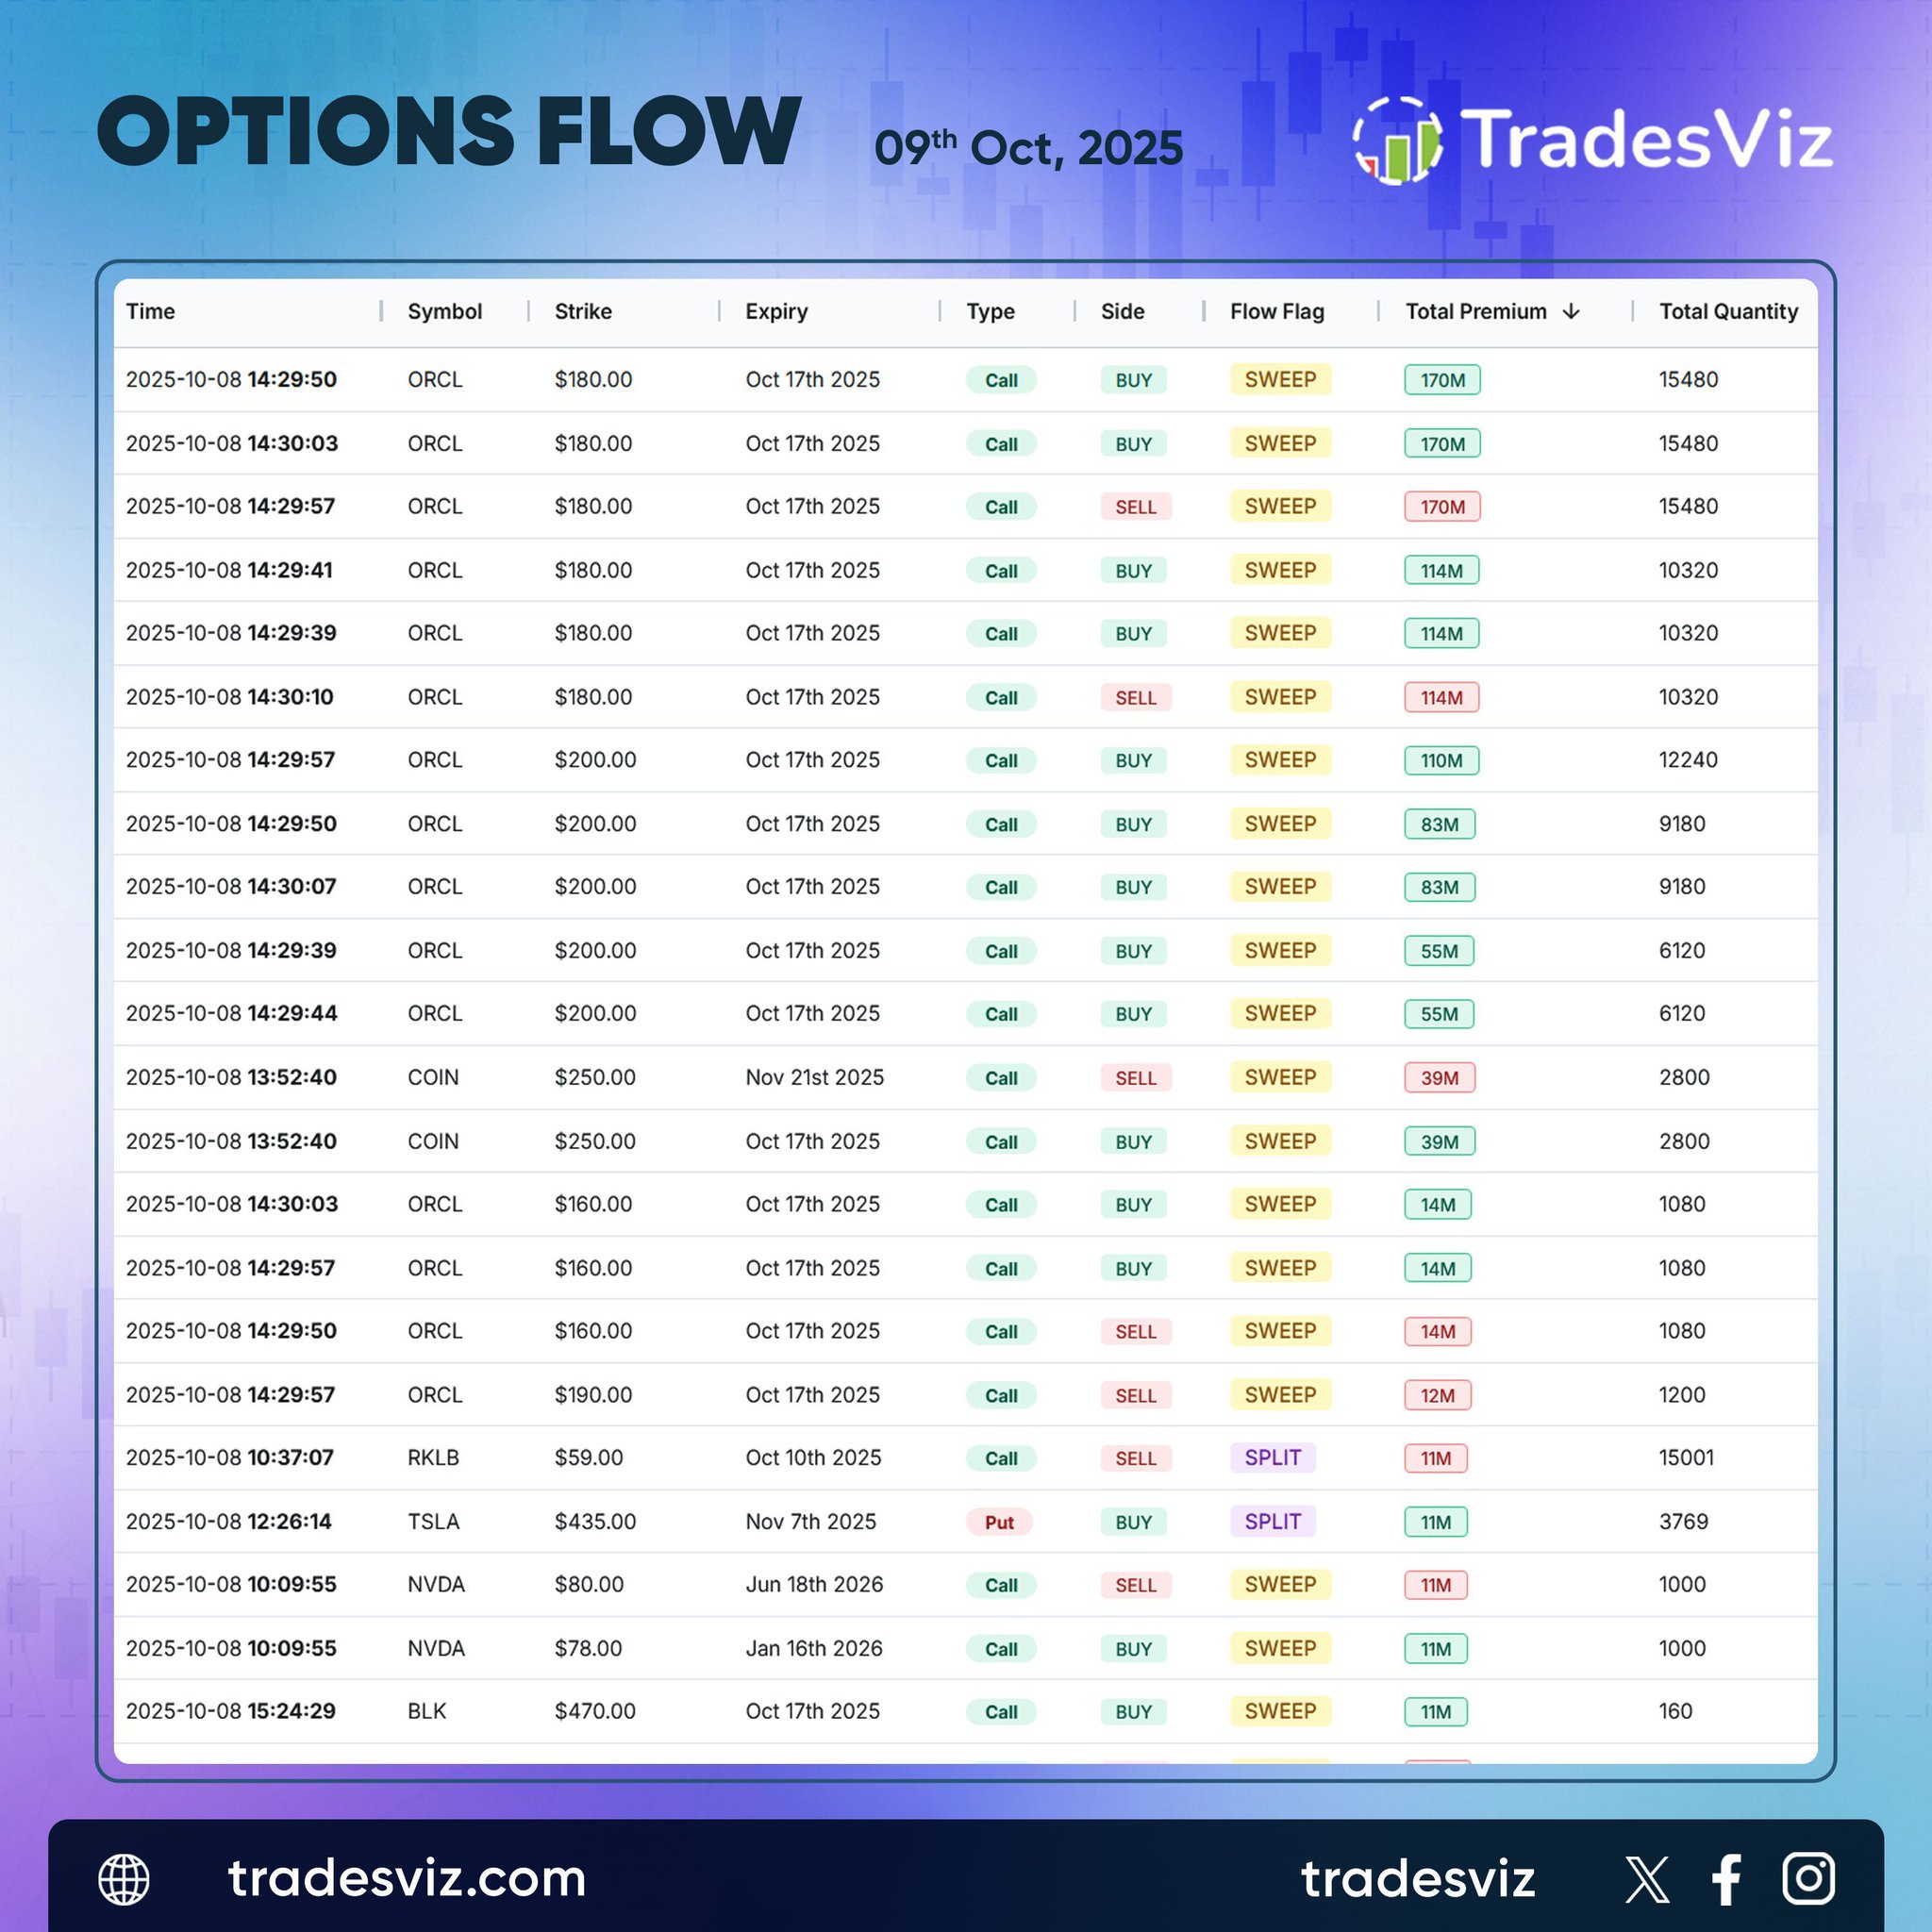
Heavy flow lit up the Oct 9 tape, dominated by concentrated activity in $ORCL. The name saw a relentless series of large sweeps across multiple strikes, led by $180 and $200 calls expiring Oct 17, 2025.
Repeated high‑notional prints in the $55M–$170M range point to aggressive accumulation and clear conviction.
Secondary presence came from $COIN and $NVDA, each showing smaller but still notable sweep interest, while $TSLA surfaced with a $450 put split, suggesting selective two‑way positioning among high‑beta names.
When a single ticker absorbs that level of volume across consecutive strikes and expiries, it typically signals structured positioning rather than noise. $ORCL stays firmly on the radar.
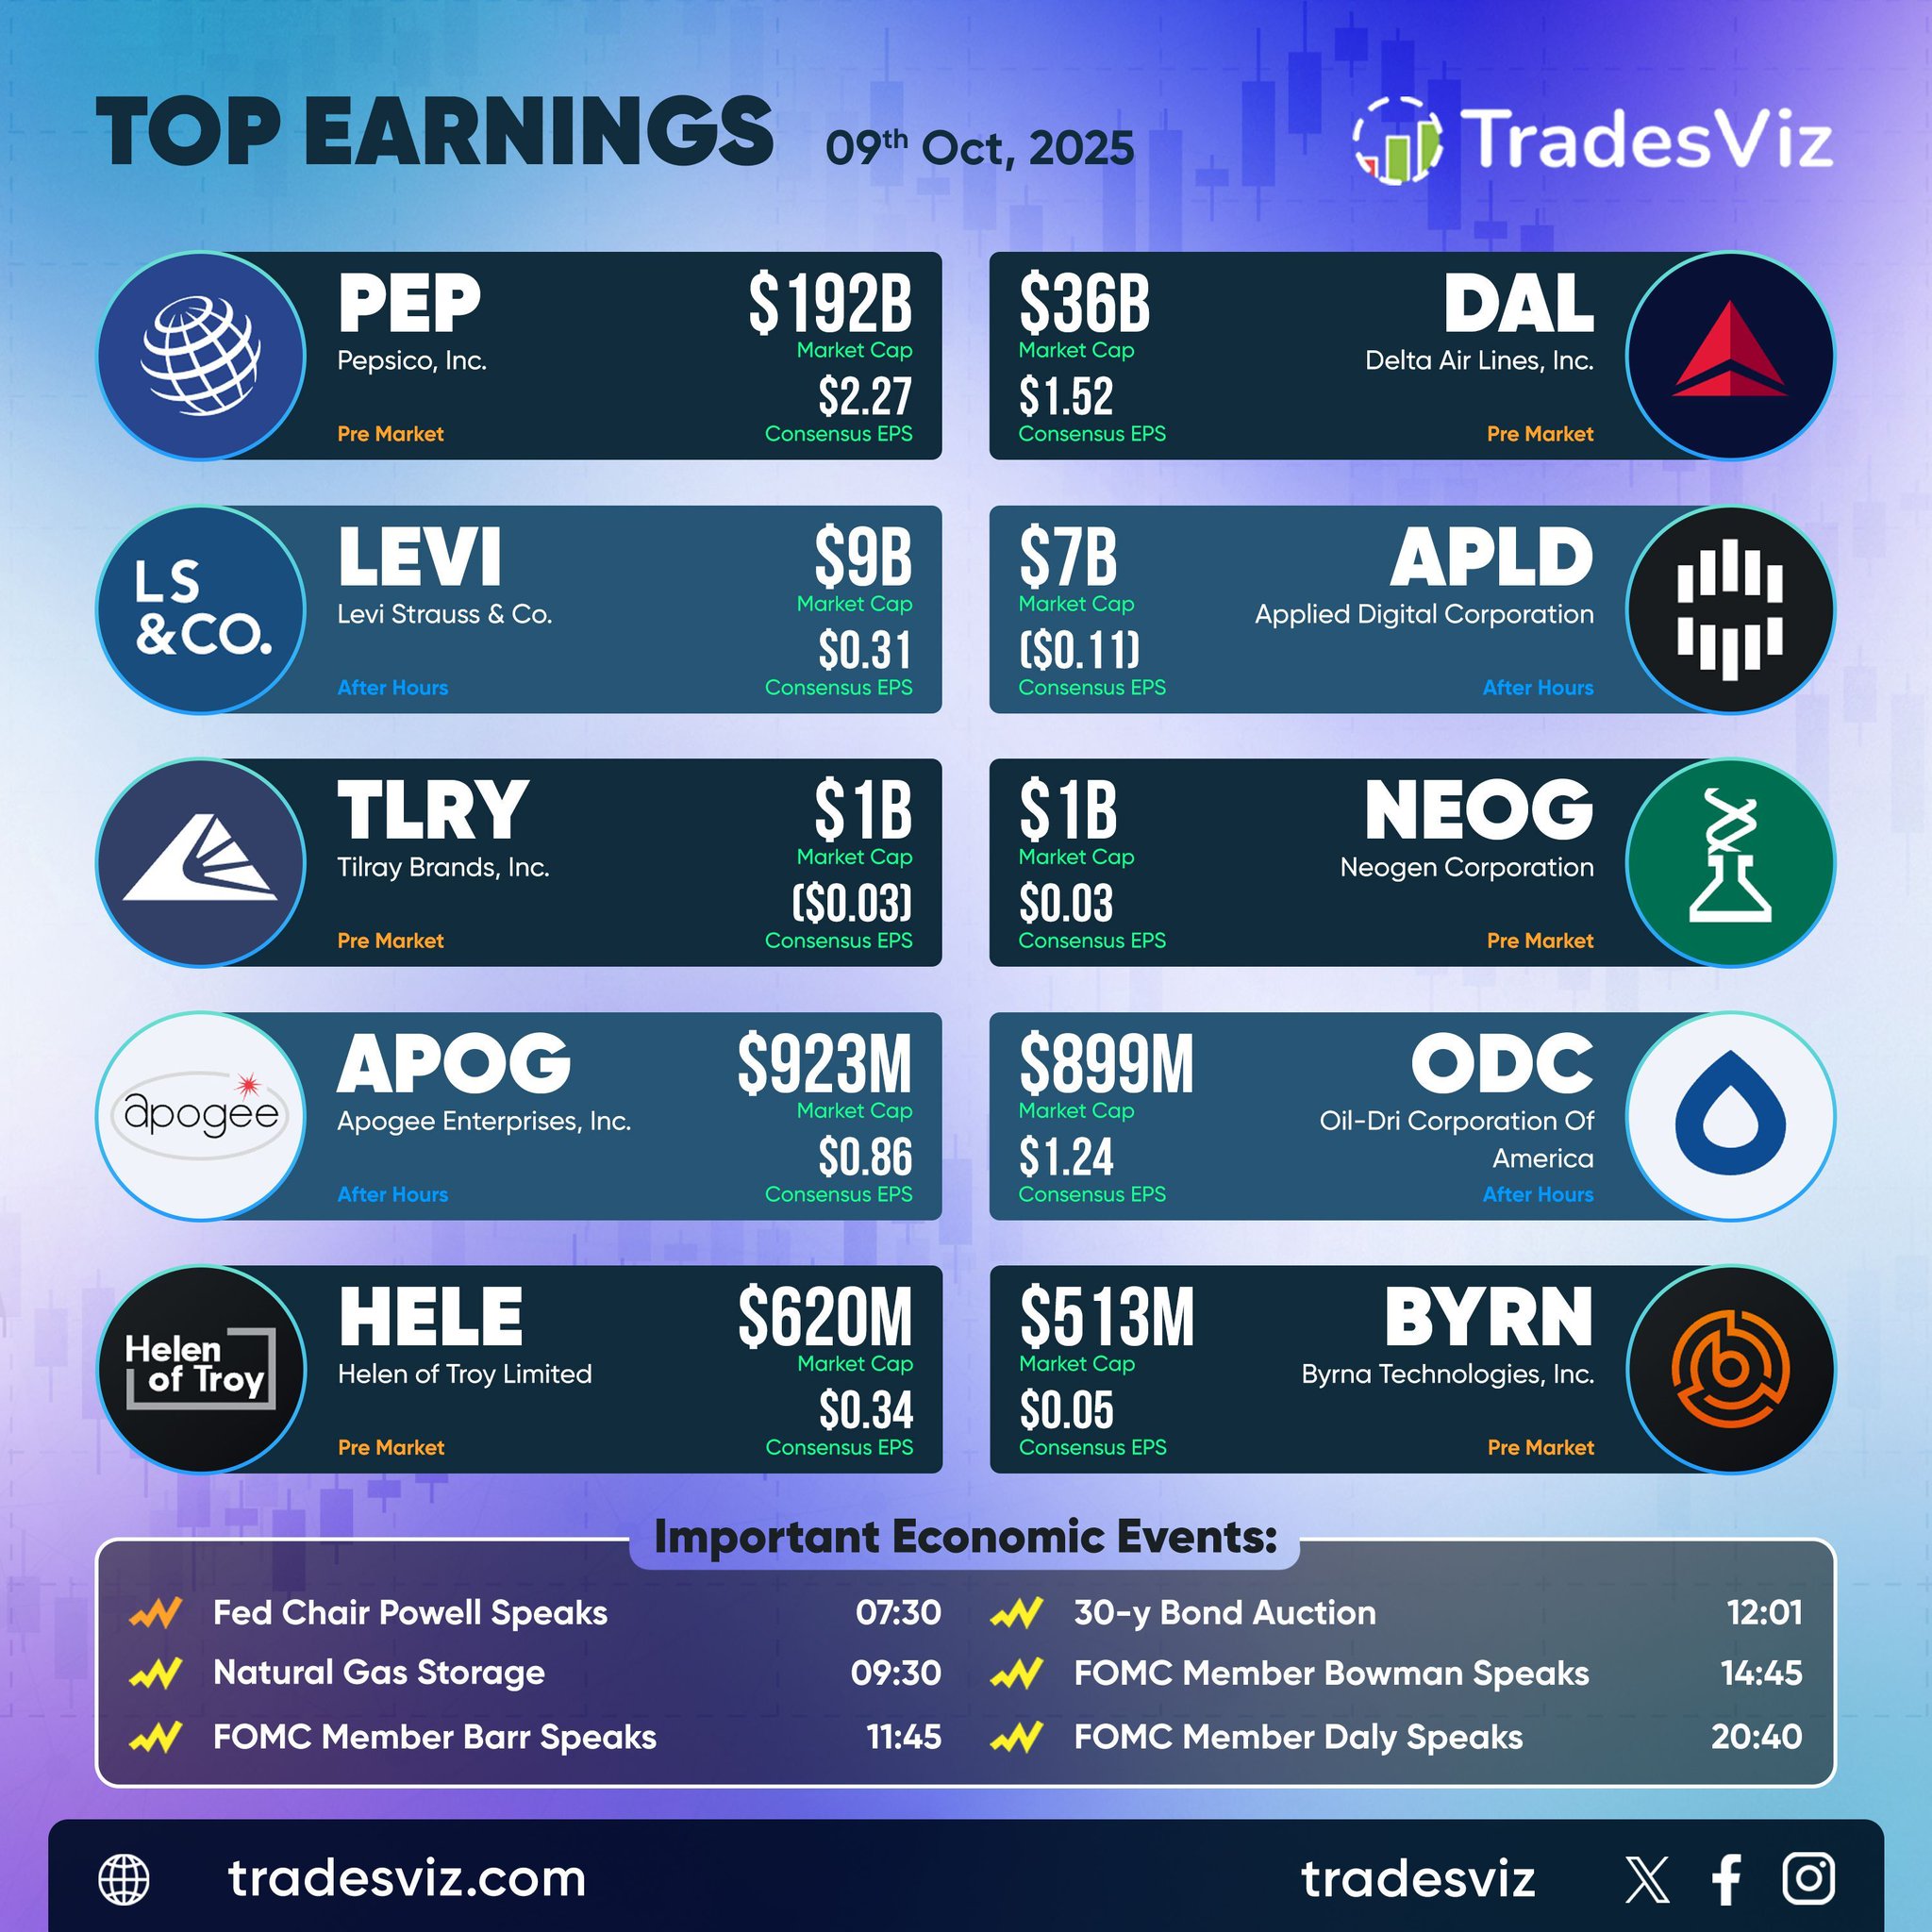
Earnings lineup for Oct 9 features a mix of large‑caps and niche industrials on deck.
$PEP leads pre‑market with a $192B market cap and $2.27 EPS estimate, alongside $DAL at $36B with $1.52 expected.
$TLRY, $NEOG, and $HELE round out the early session with small‑cap consumer and biotech coverage.
After hours, focus shifts to $LEVI, $APLD, $APOG, and $ODC. $LEVI reports on modest $9B capitalization, while $APLD and $APOG bring tech‑industrial exposure with steady EPS outlooks of ($0.11) and $0.86, respectively.
Macro catalysts are dense, with Fed Chair Powell at 07:30 and multiple FOMC speakers through the afternoon, followed by the 30‑year bond auction at midday. Plenty of data and earnings risk clustered ahead of Friday’s session.