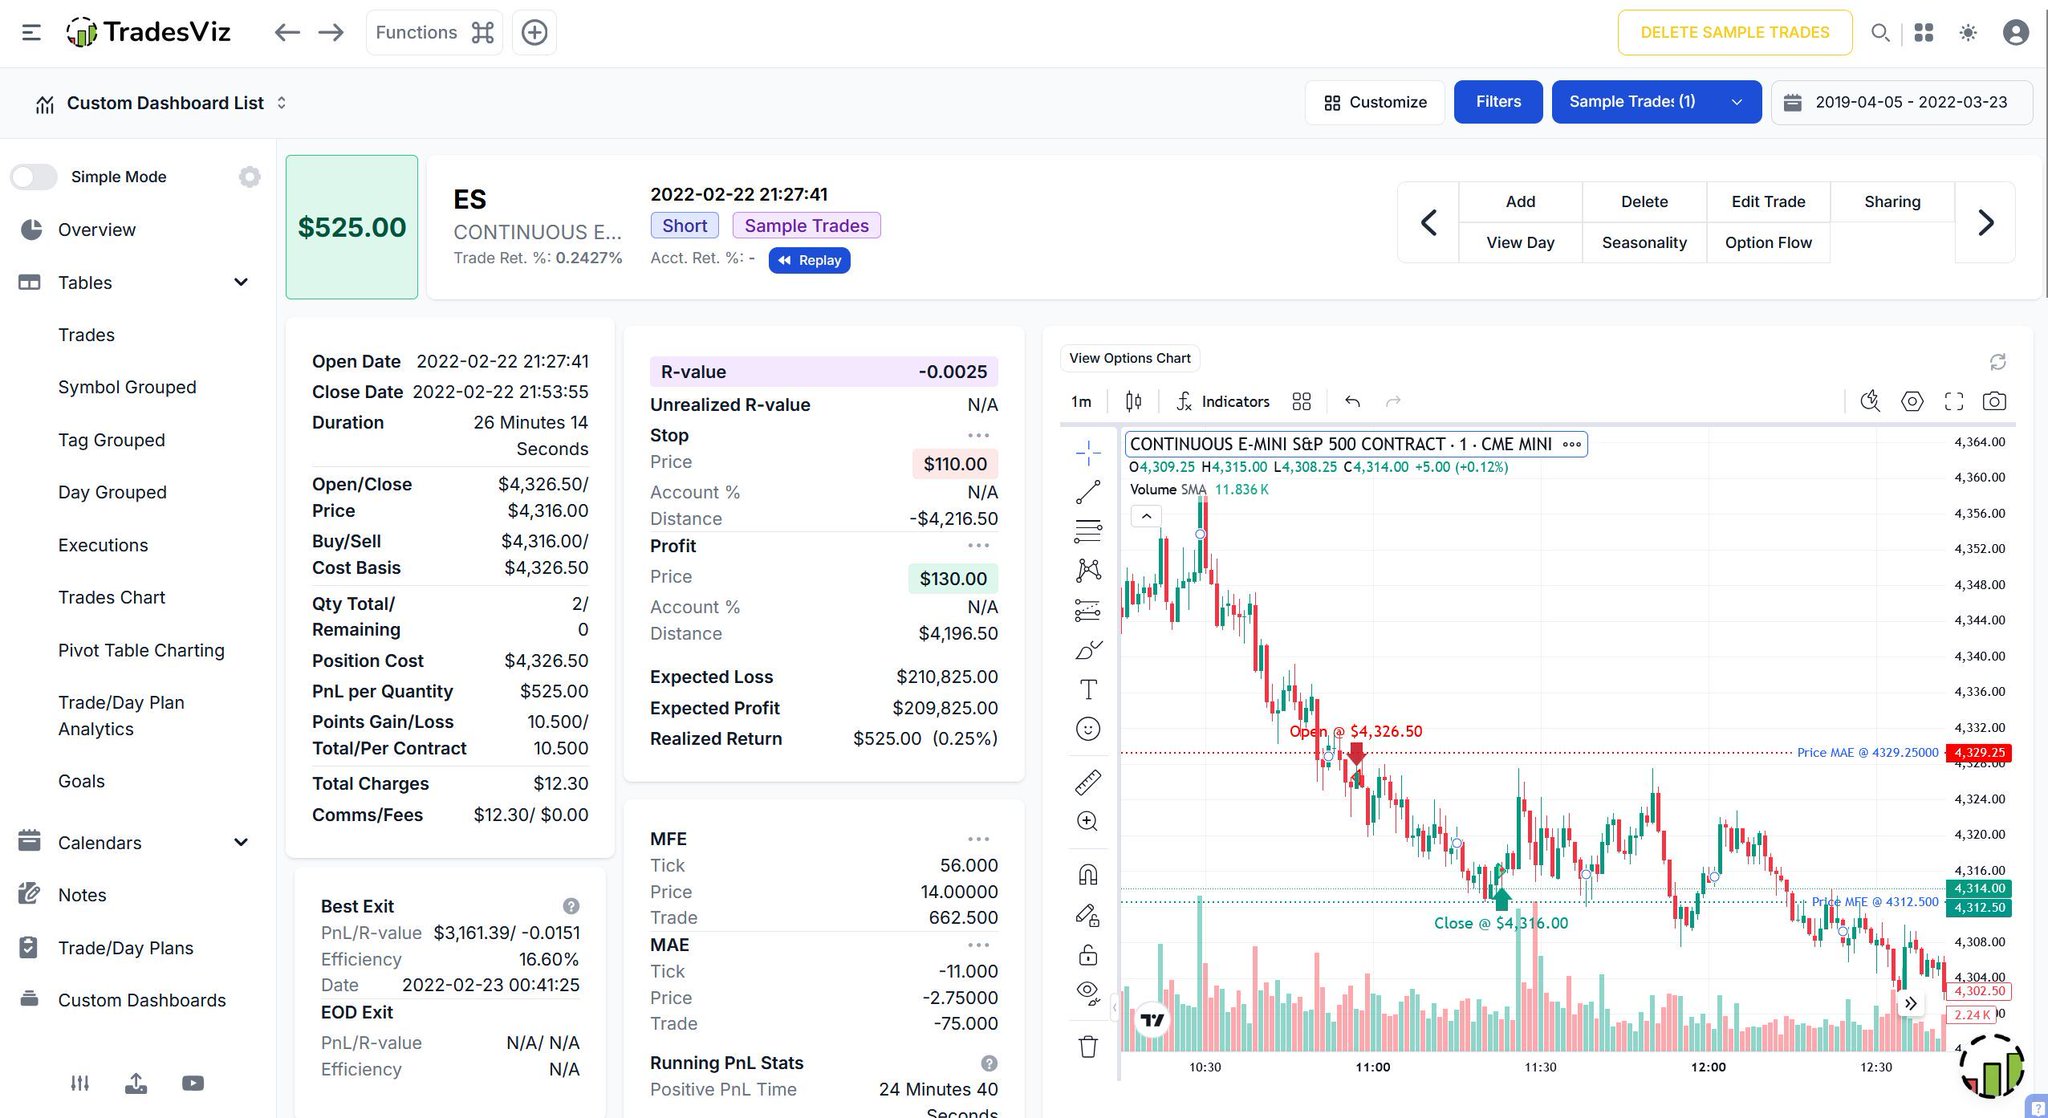
The Trade Explore tab in TradesViz breaks down each position into a clear sequence of data and tape context.
Here, $ES reflects structured insight — entry, exit, R‑value, and efficiency all aligned beside a chart that shows exactly where conviction built and where the move faded.
Every detail unfolds in one frame, linking performance metrics directly to trade behavior.
It’s precision built for reflection, letting you replay the flow of each trade and keep execution discipline and positioning efficiency firmly on the radar .
Tracking your edge, one trade at a time. ⚡
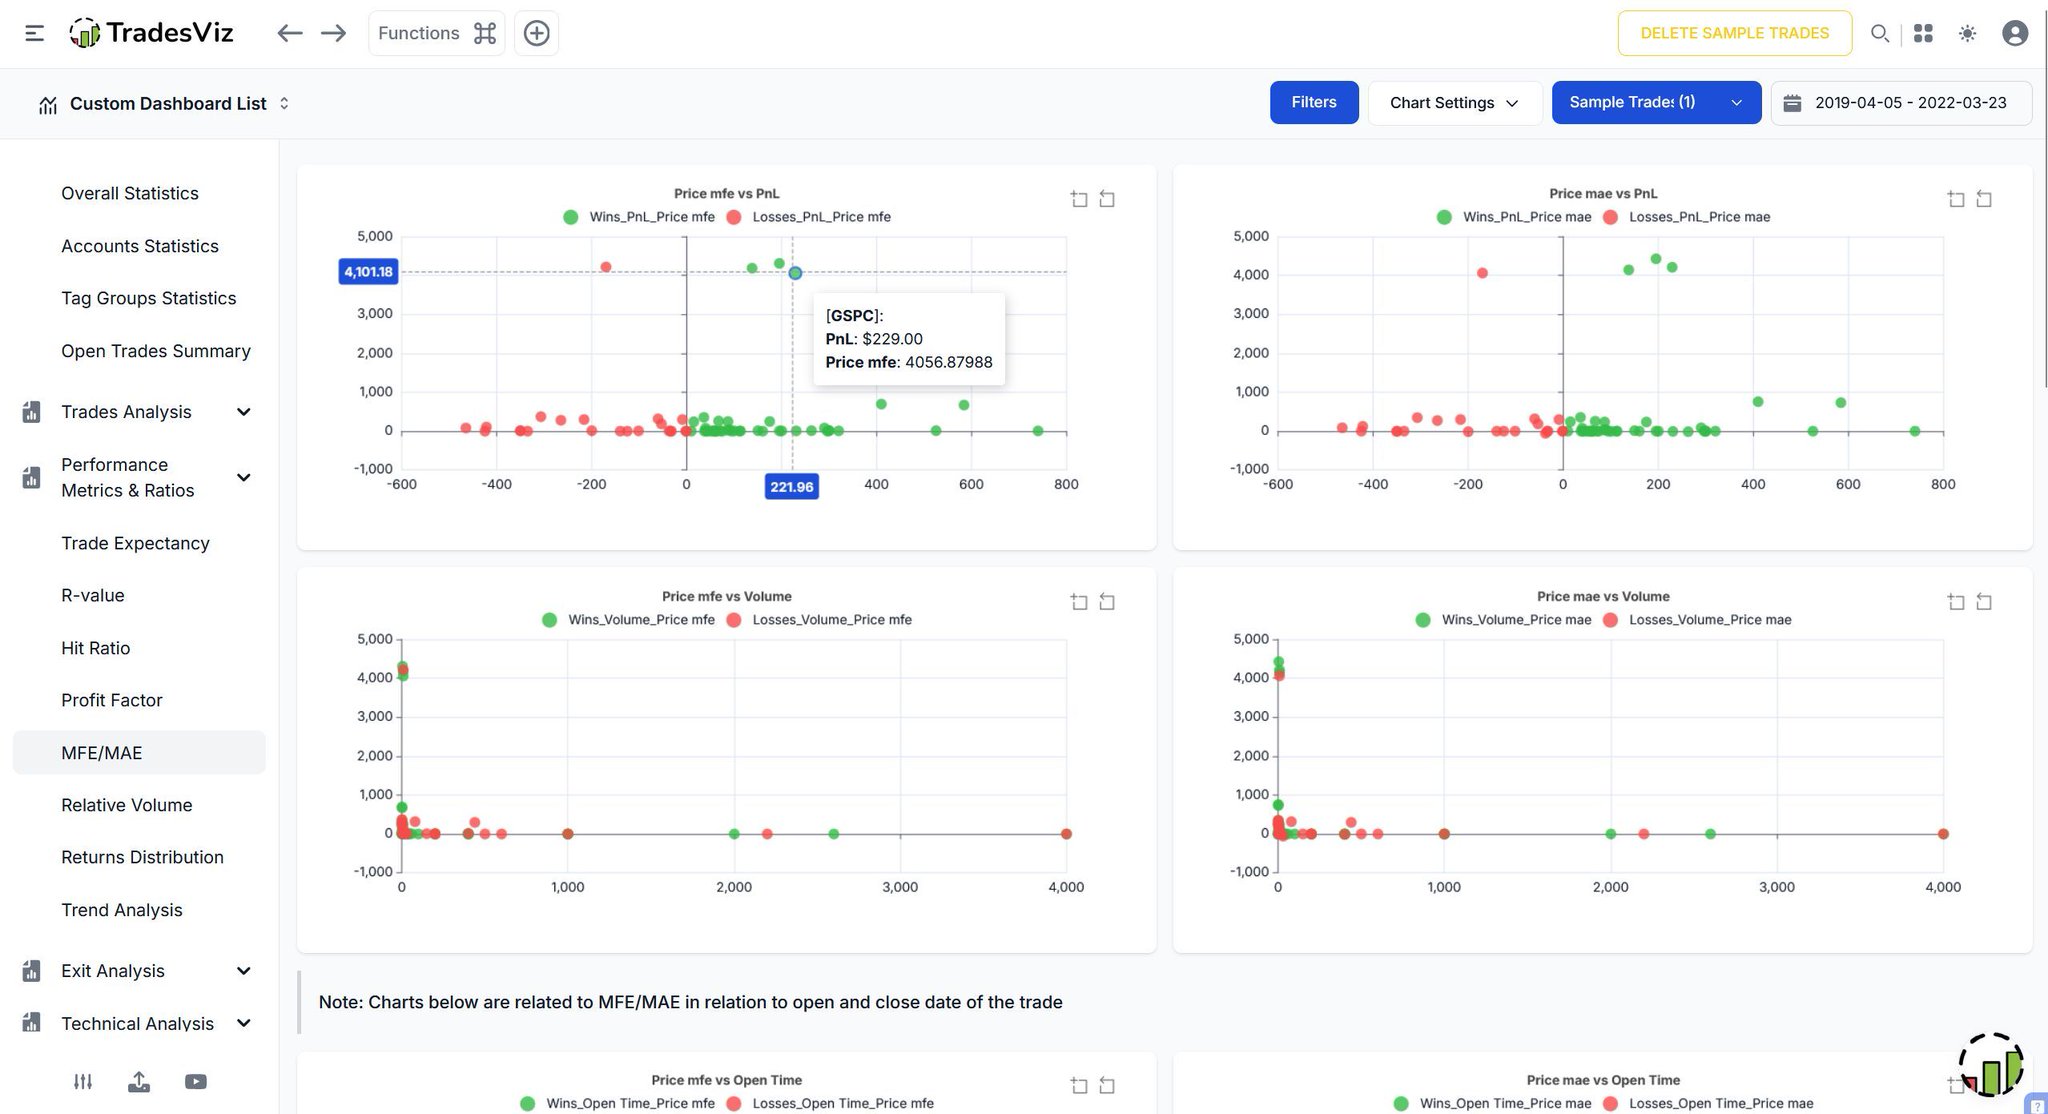
The MFE/MAE dashboard in TradesViz breaks down every trade by maximum favorable and adverse excursion, helping you see:
How far trades move in your favor before reversing 📈
Where losses expand beyond control 📉
And how PnL, volume, and timing all tie together for better trade management.
Visualize risk, refine your exits, and turn every insight into precision.
With TradesViz Performance Metrics & Ratios, you’re not just logging trades — you’re mastering your strategy. 💡
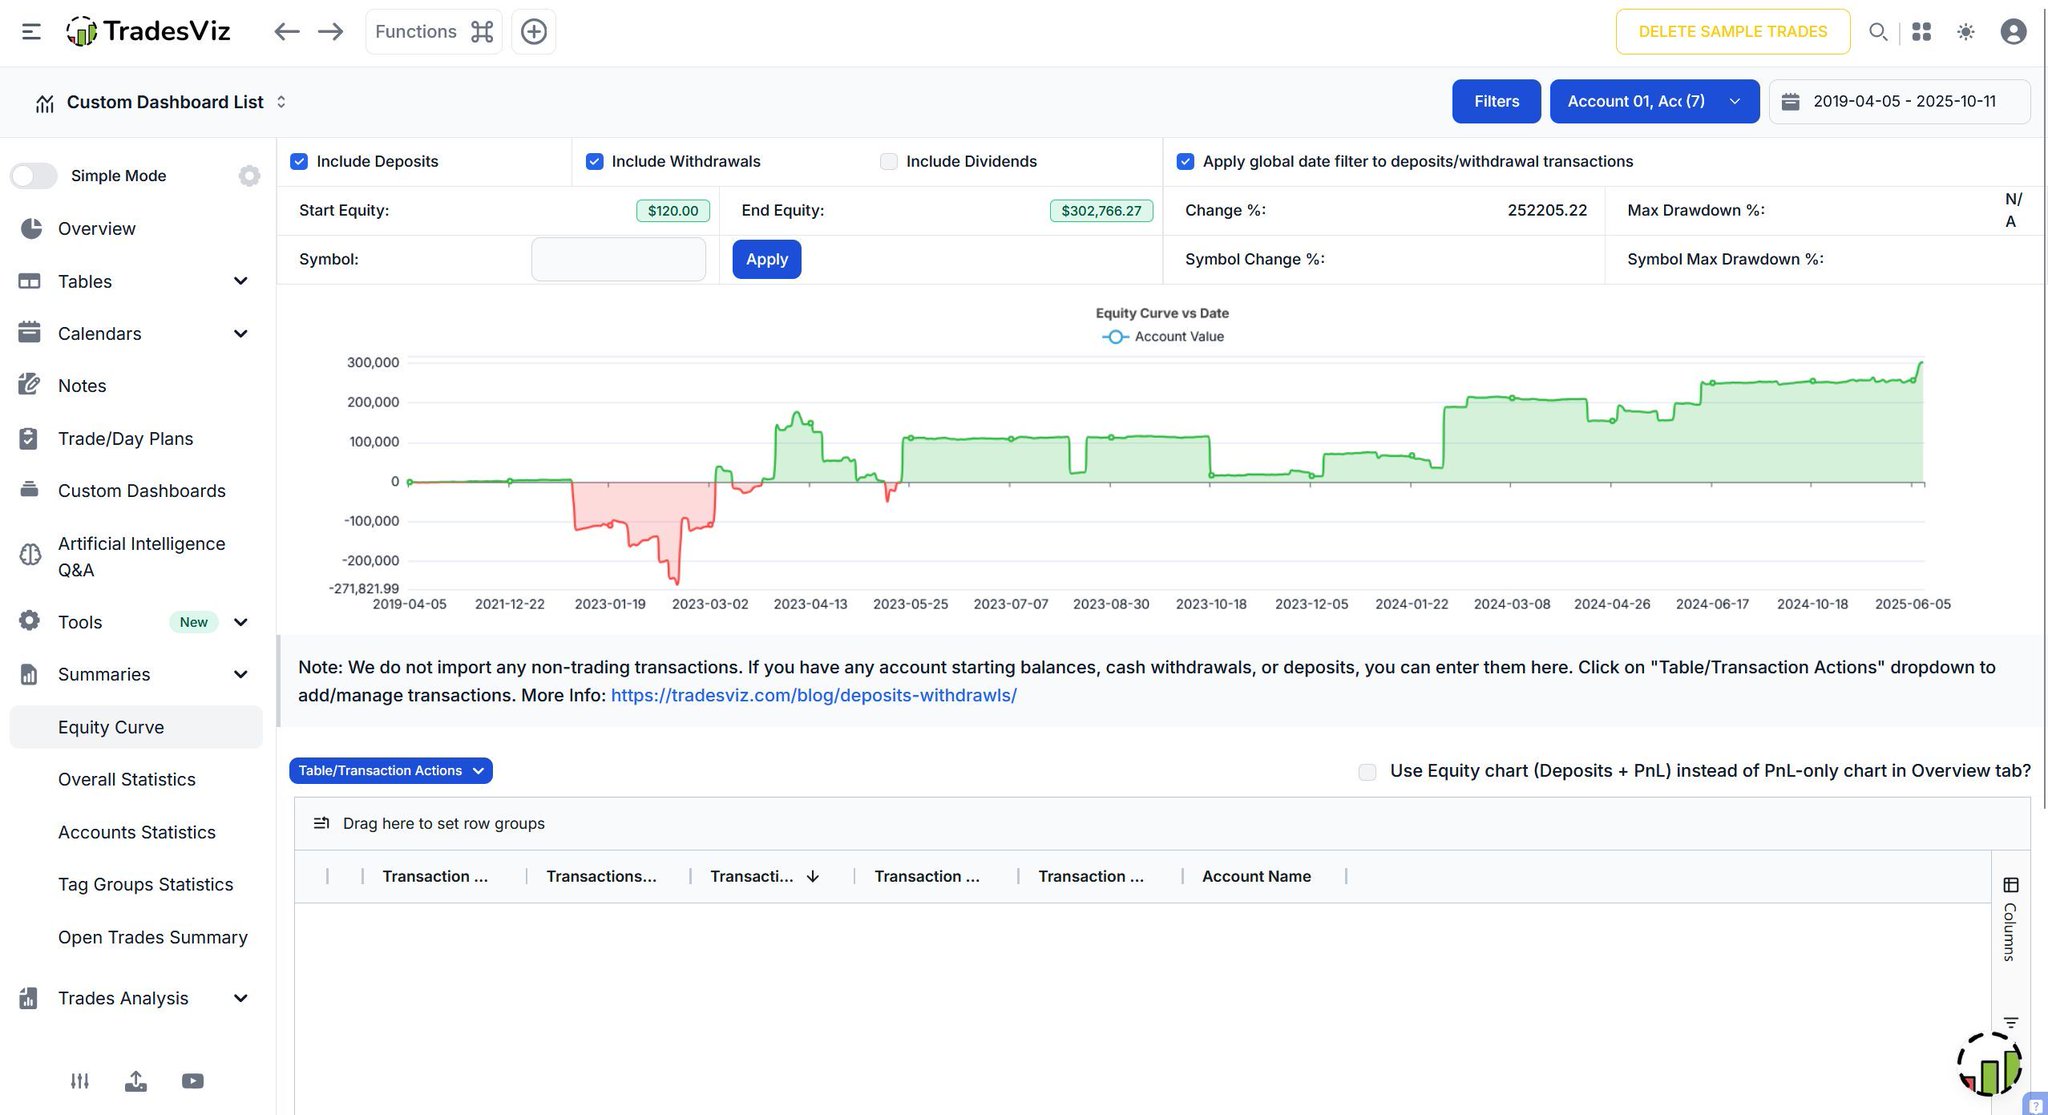
The Equity Curve view in TradesViz presents a precise record of performance, showing how conviction evolved across time 📊
Each shift on the curve reflects periods where positioning built momentum and where the tape softened.
Drawdowns and recoveries stand clearly apart, allowing the progression of account value to tell its own story ⚙️
It’s a calm visual of growth and risk — structure that turns data into perspective, keeping long‑term consistency and stability firmly on the radar 📈
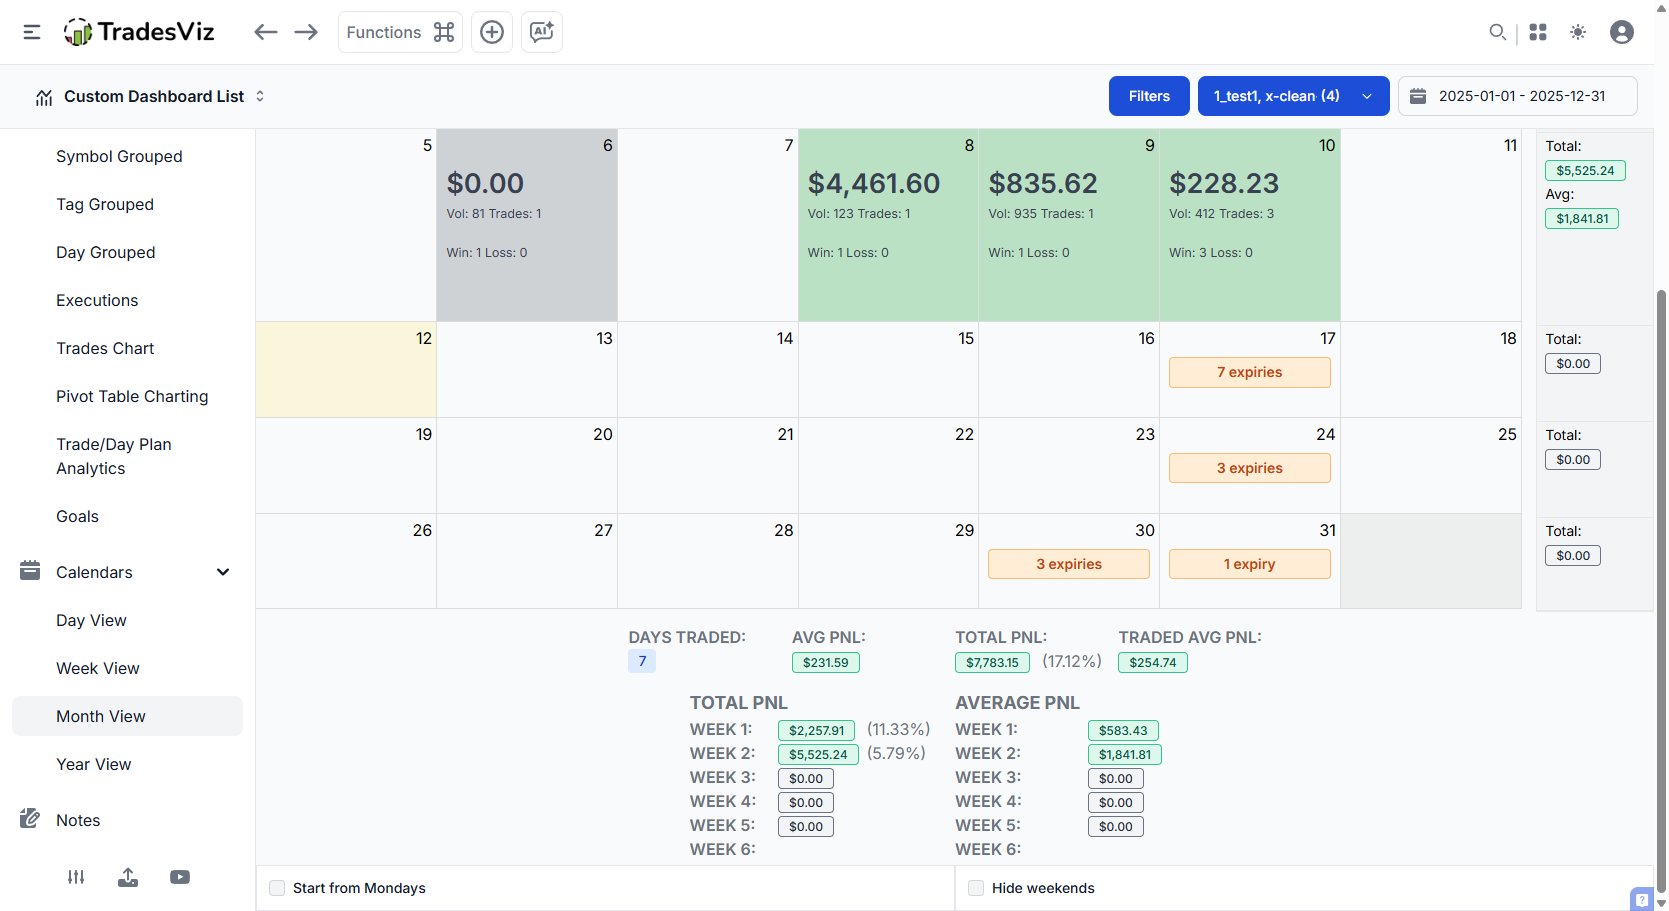
🎉 New calendar update: You can now view your expiries in the calendar with a single toggle.
➕ Also new: upon exploring the day, if there are any expiries for that day, you will see a new table with the trades that are expiring that day!
📅 Check your TradesViz calendars 👇
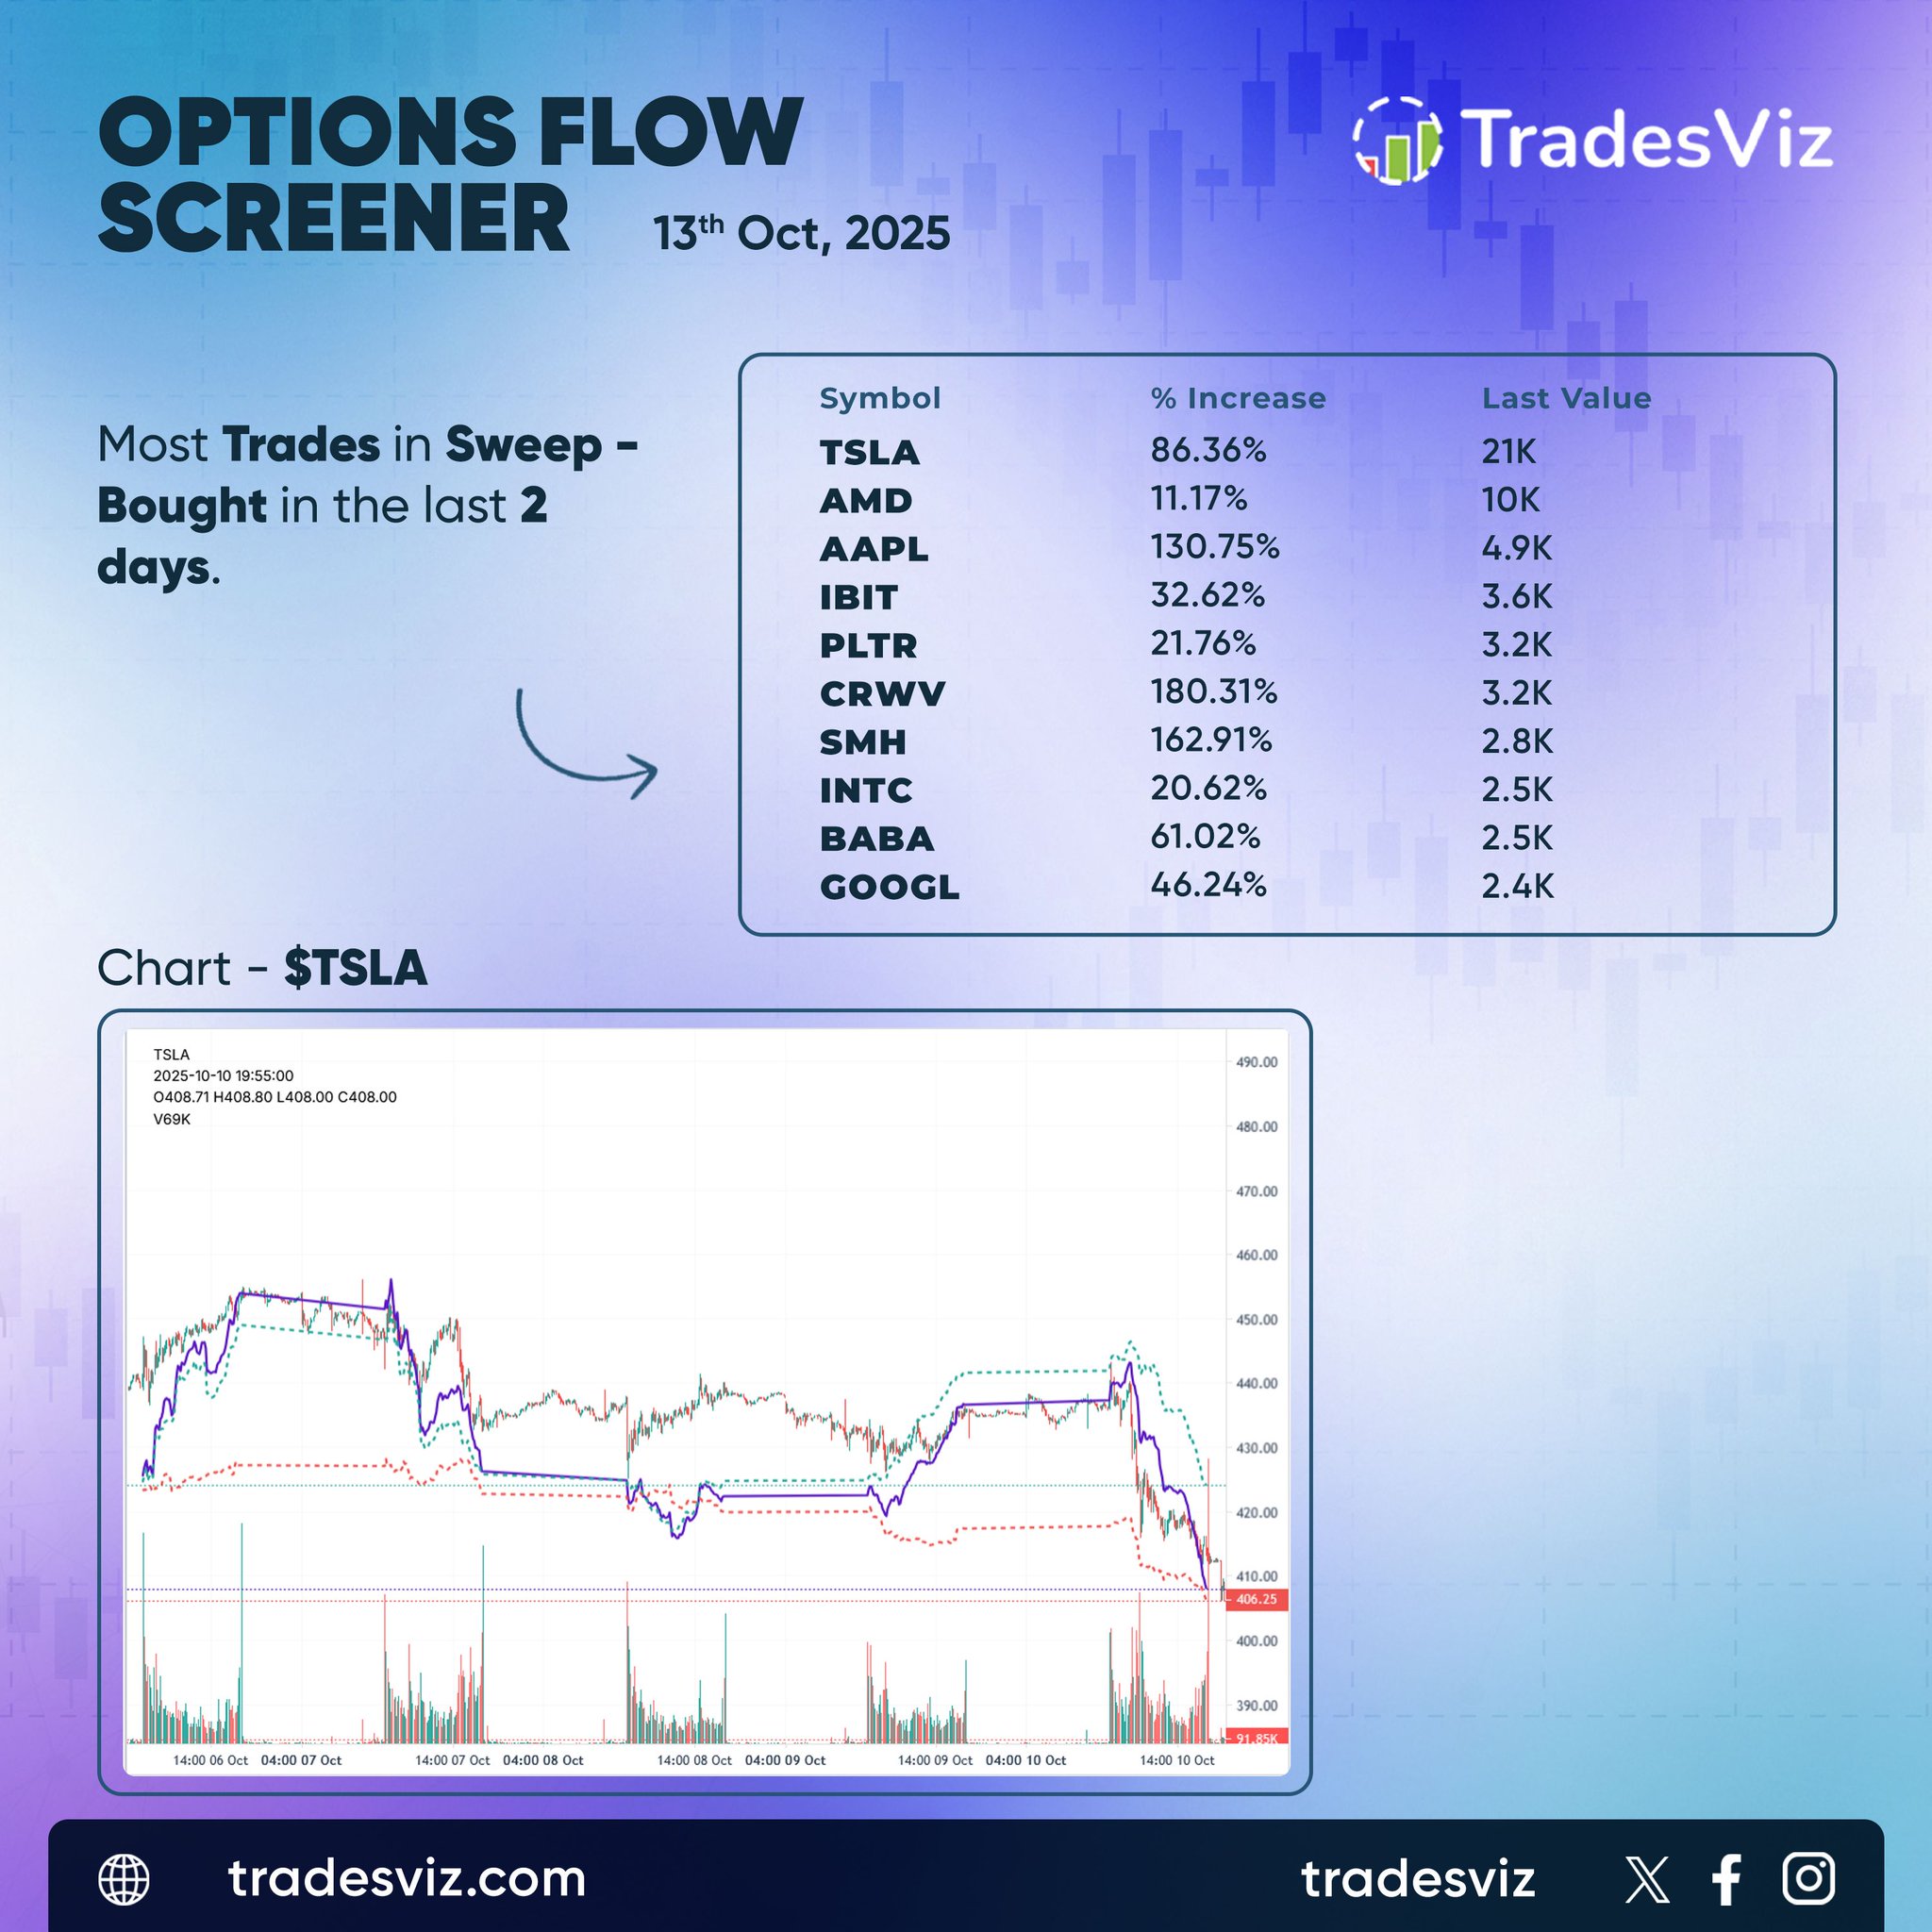
Sweep flow concentrated heavily in large‑cap tech on Oct 13. $TSLA led with an 86% spike in sweep trades over the past two sessions, totaling more than 21K contracts, while $AAPL surged 130% as call volume accelerated into Friday’s close.
$CRVW and $SMH followed with sharp gains of 180% and 163% respectively, showing strong rotation into semiconductors and high‑beta momentum names.
$BABA and $GOOGL also saw notable call accumulation, each posting 40–60% increases in flow.
When sweeps build this rapidly across multiple mega‑caps, it typically reflects institutional conviction chasing strength rather than short‑term noise. The tape remains decisively risk‑on heading into mid‑month positioning.
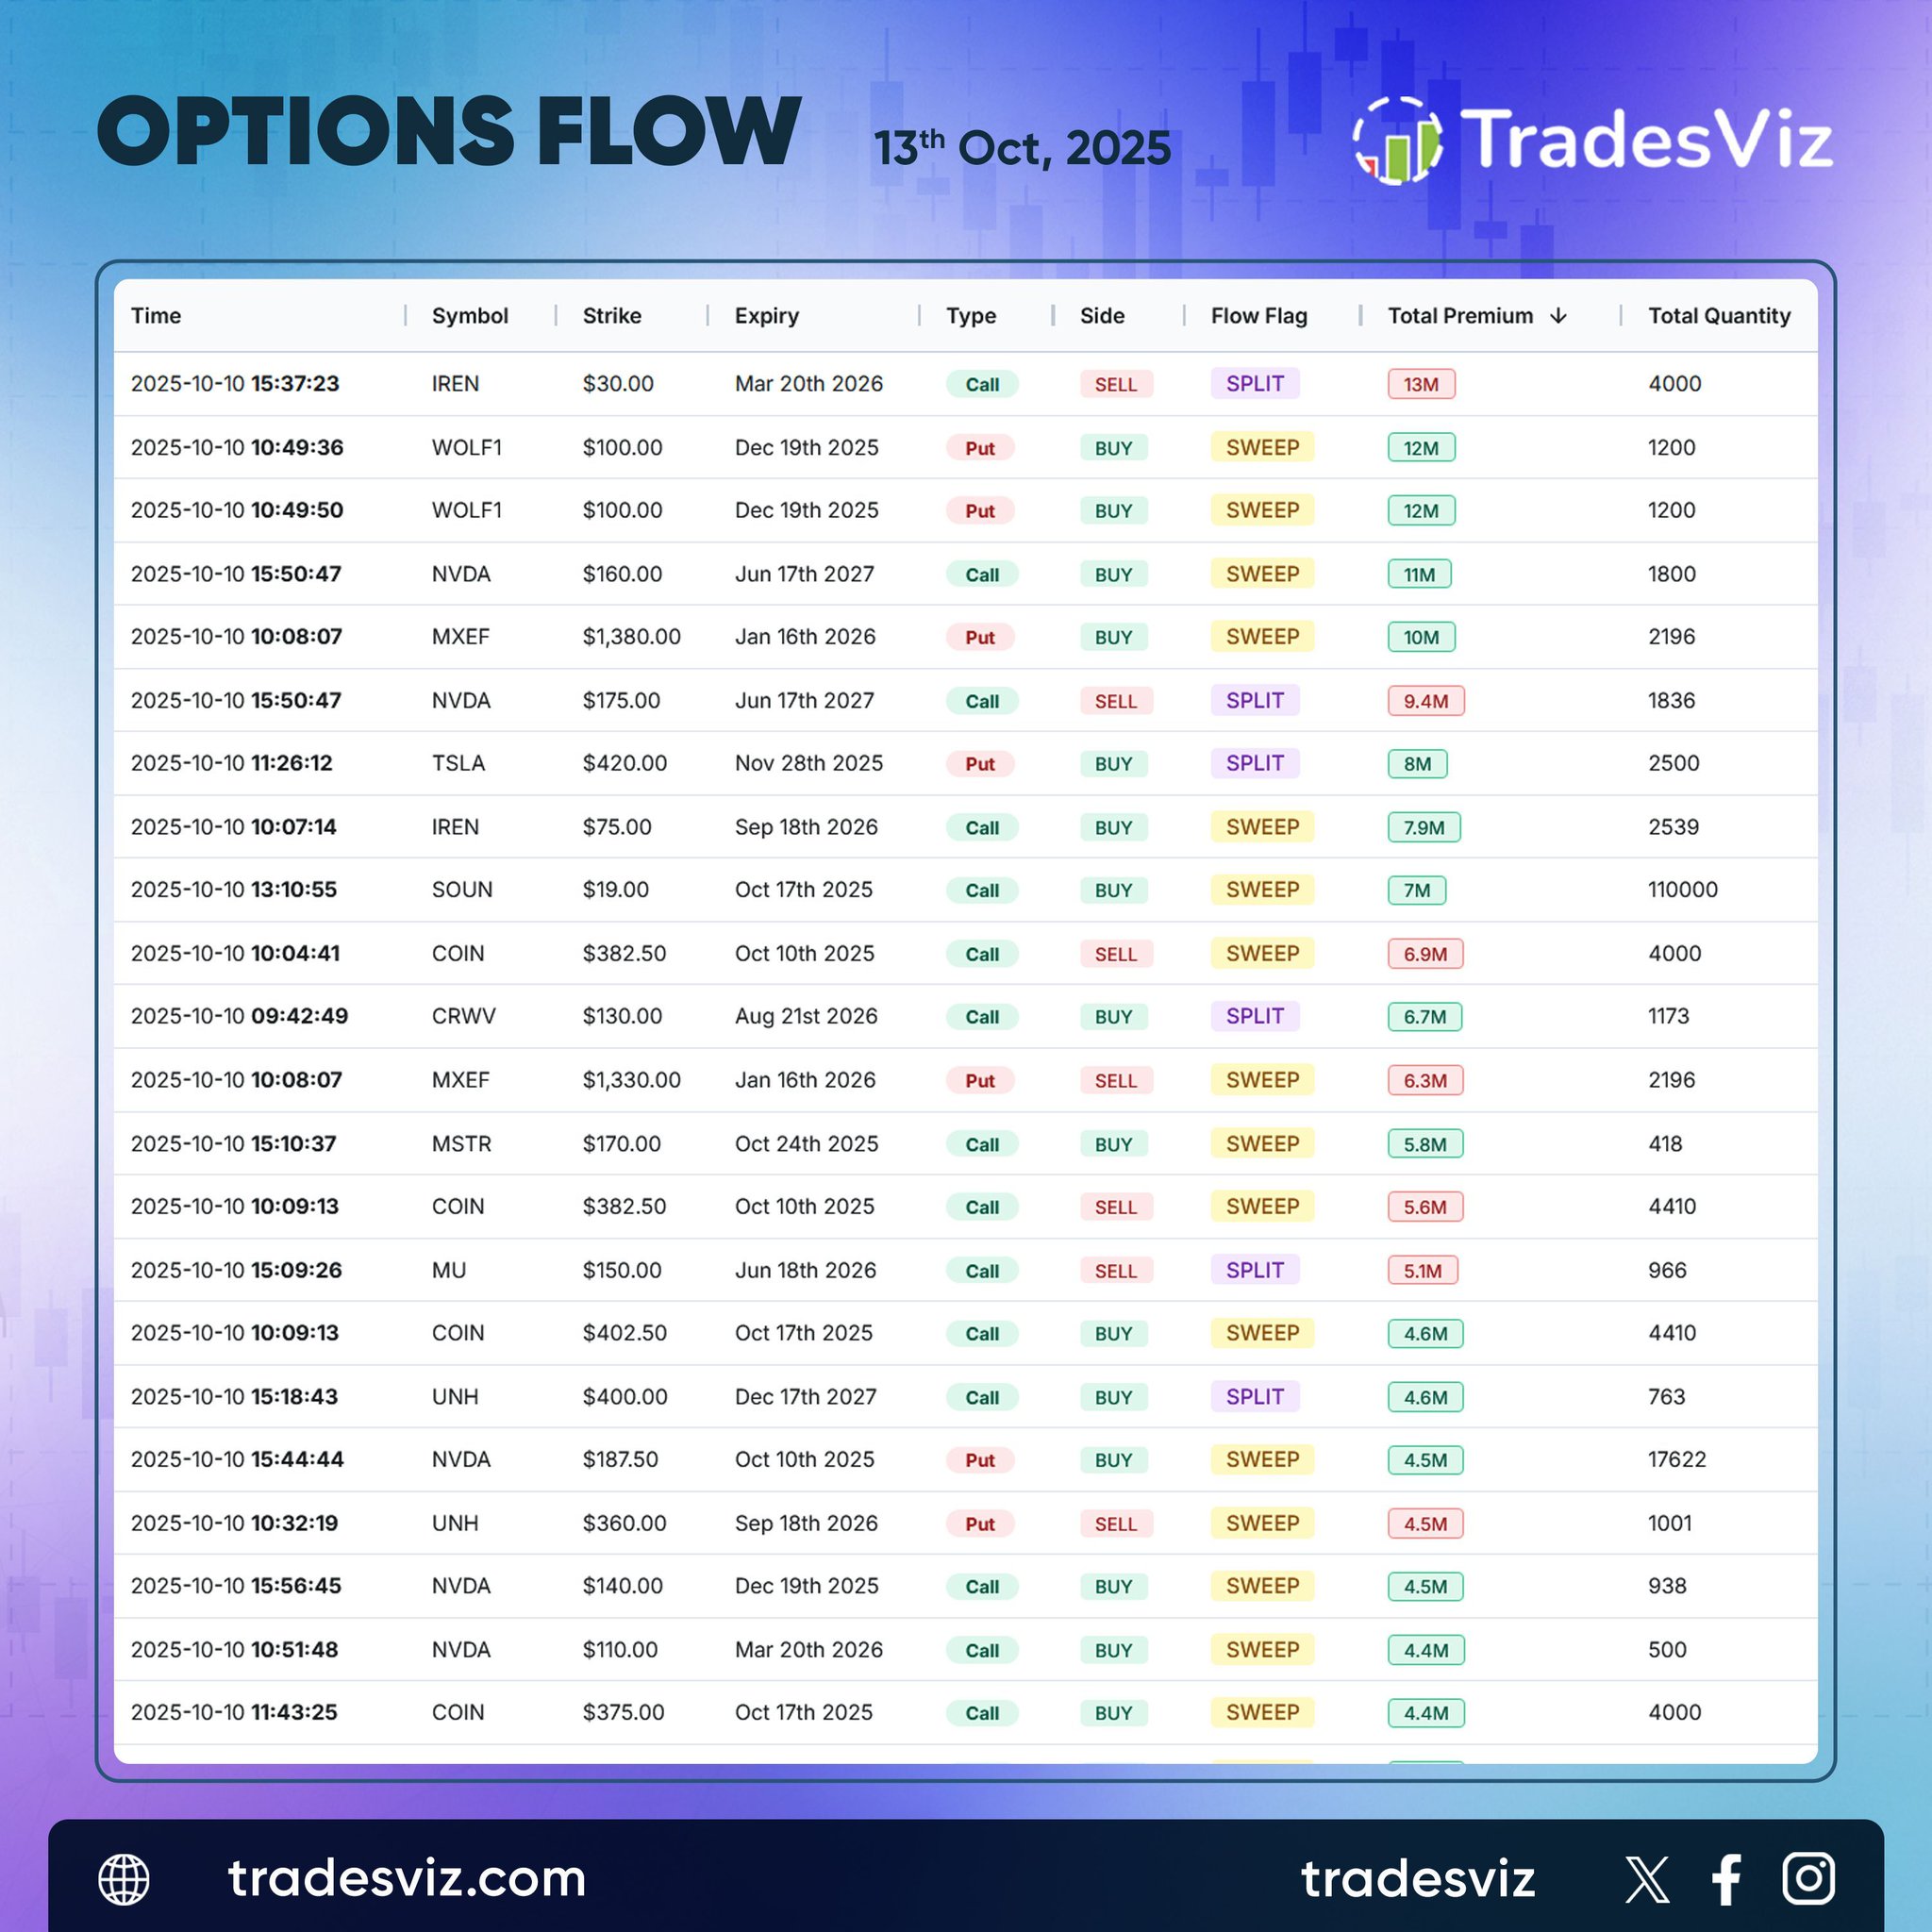
The Oct 13 tape showed broad-based activity across tech and crypto-linked names, with heavy sweep flow driving the session.
$NVDA led with multiple large trades through mid- and long-dated expiries, including $11M and $9.4M prints out to Jun ’27, confirming deep institutional presence. $IREN followed closely, posting a $13M call sell split and a $7.9M call sweep, reflecting aggressive two-way engagement in crypto miners.
$COIN continued to attract attention with repeated sweeps from $375 to $402 strikes totaling more than $15M in premium. $WOLF and $MXEF also showed distinct large prints on both sides, suggesting paired activity or hedged structures.
Size clustering across tech leaders and digital asset proxies points to structured positioning rather than speculative noise. The tape showed conviction flow building ahead of earnings season.
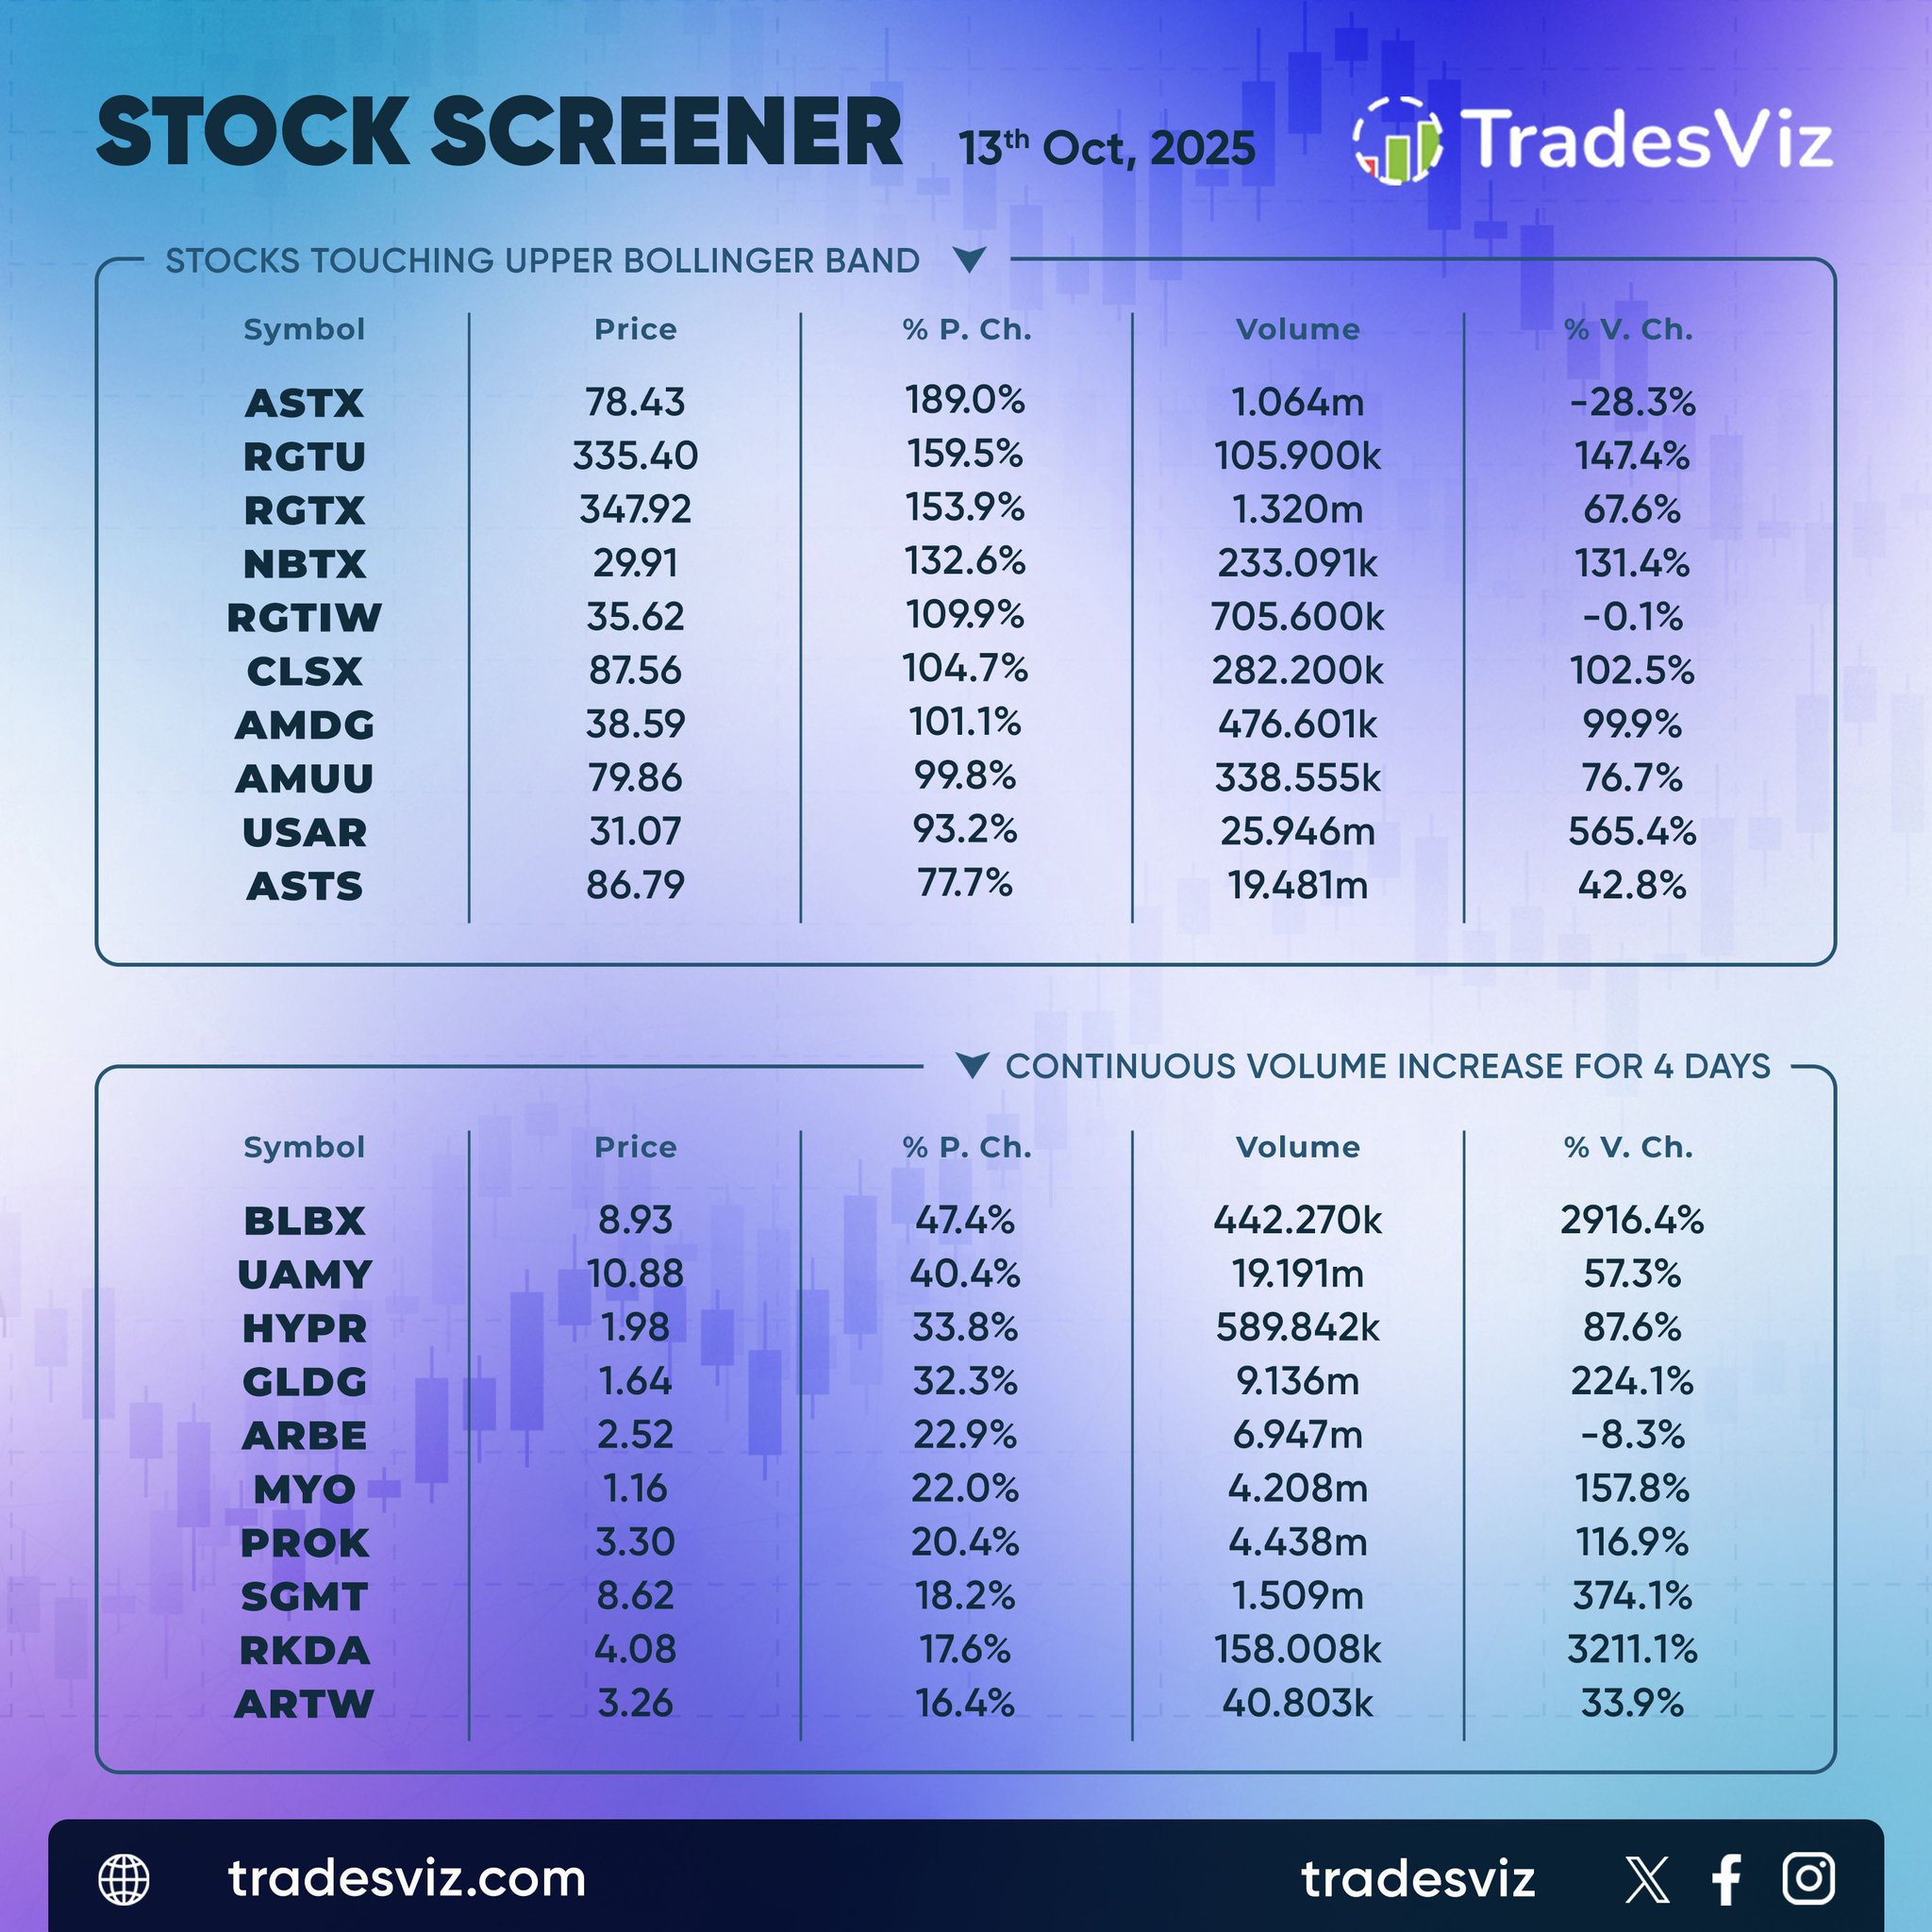
Momentum dominated the Oct 13 tape as small‑cap and growth names pressed into upper Bollinger territory.
$ASTX led with a 189% surge, followed by $RGTU and $RGTX, both gaining over 150% as volume expanded sharply, confirming conviction‑driven buying rather than noise. $NBTX and $AMDG added strong follow‑through, sustaining triple‑digit price gains backed by rising liquidity.
On the volume front, $BLBX and $RKDA stood out with multi‑day surges of 2,900% and 3,200% respectively, showing sustained inflows into momentum pockets. $HYPR, $GLDG, and $PROK also extended four‑day volume streaks, reinforcing broad speculative participation.
When price accelerates alongside persistent volume expansion, the move often signals authentic accumulation cycles. The tape remains decisively risk‑on as buyers continue to press into strength.
Feeling unsure about an option strategy?
Inspect options flow
Check the payoff charts
Write a note
and then take the trade :)
All the above takes just a few minutes on TradesViz ✨
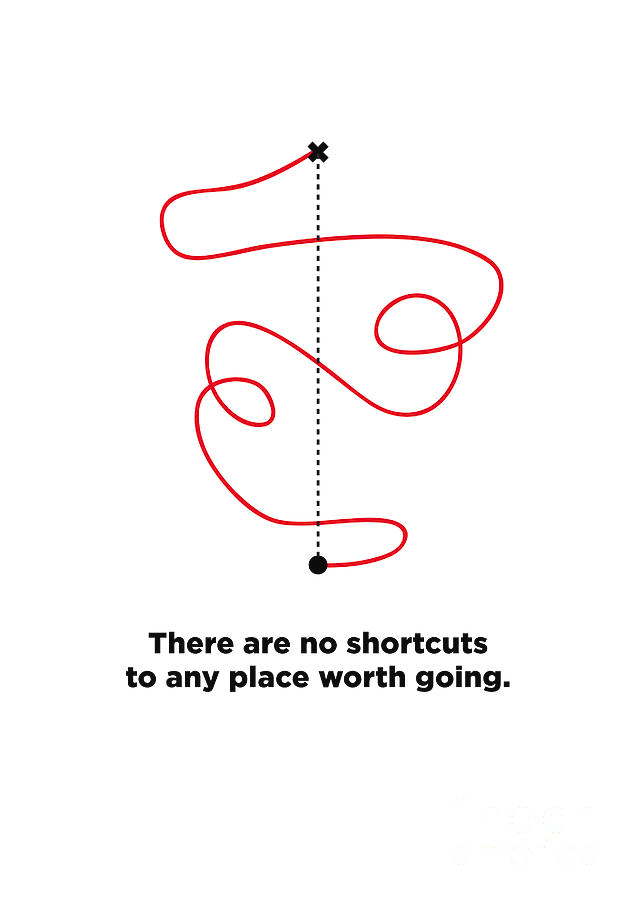
Still expecting trading to be a smooth ride?
It's not. It never will be.
The sooner you learn how much effort and preparation it takes, the higher your odds are of reaching your goal.
Unfortunately, the hard path of genuine exploration and self-discovery is one that very few choose to walk anymore.
Why? Because they're drowning in AI slop and listening to trading "gurus" who promise the world. This is why so many new traders get chewed up and spit out by the market.
Here’s the only rule you need to protect yourself: If it sounds too good to be true, it is. Every single time.
This has never been more relevant: "Nothing worth having comes easy."
🤖 AI + TradesViz Examples🔖
Here is a list of real examples that you can try in your TradesViz journal now.
Unlike alternatives, we like posting useful and realistic journaling content, so here's a list of AI queries and features you can try and benefit from right now 👇