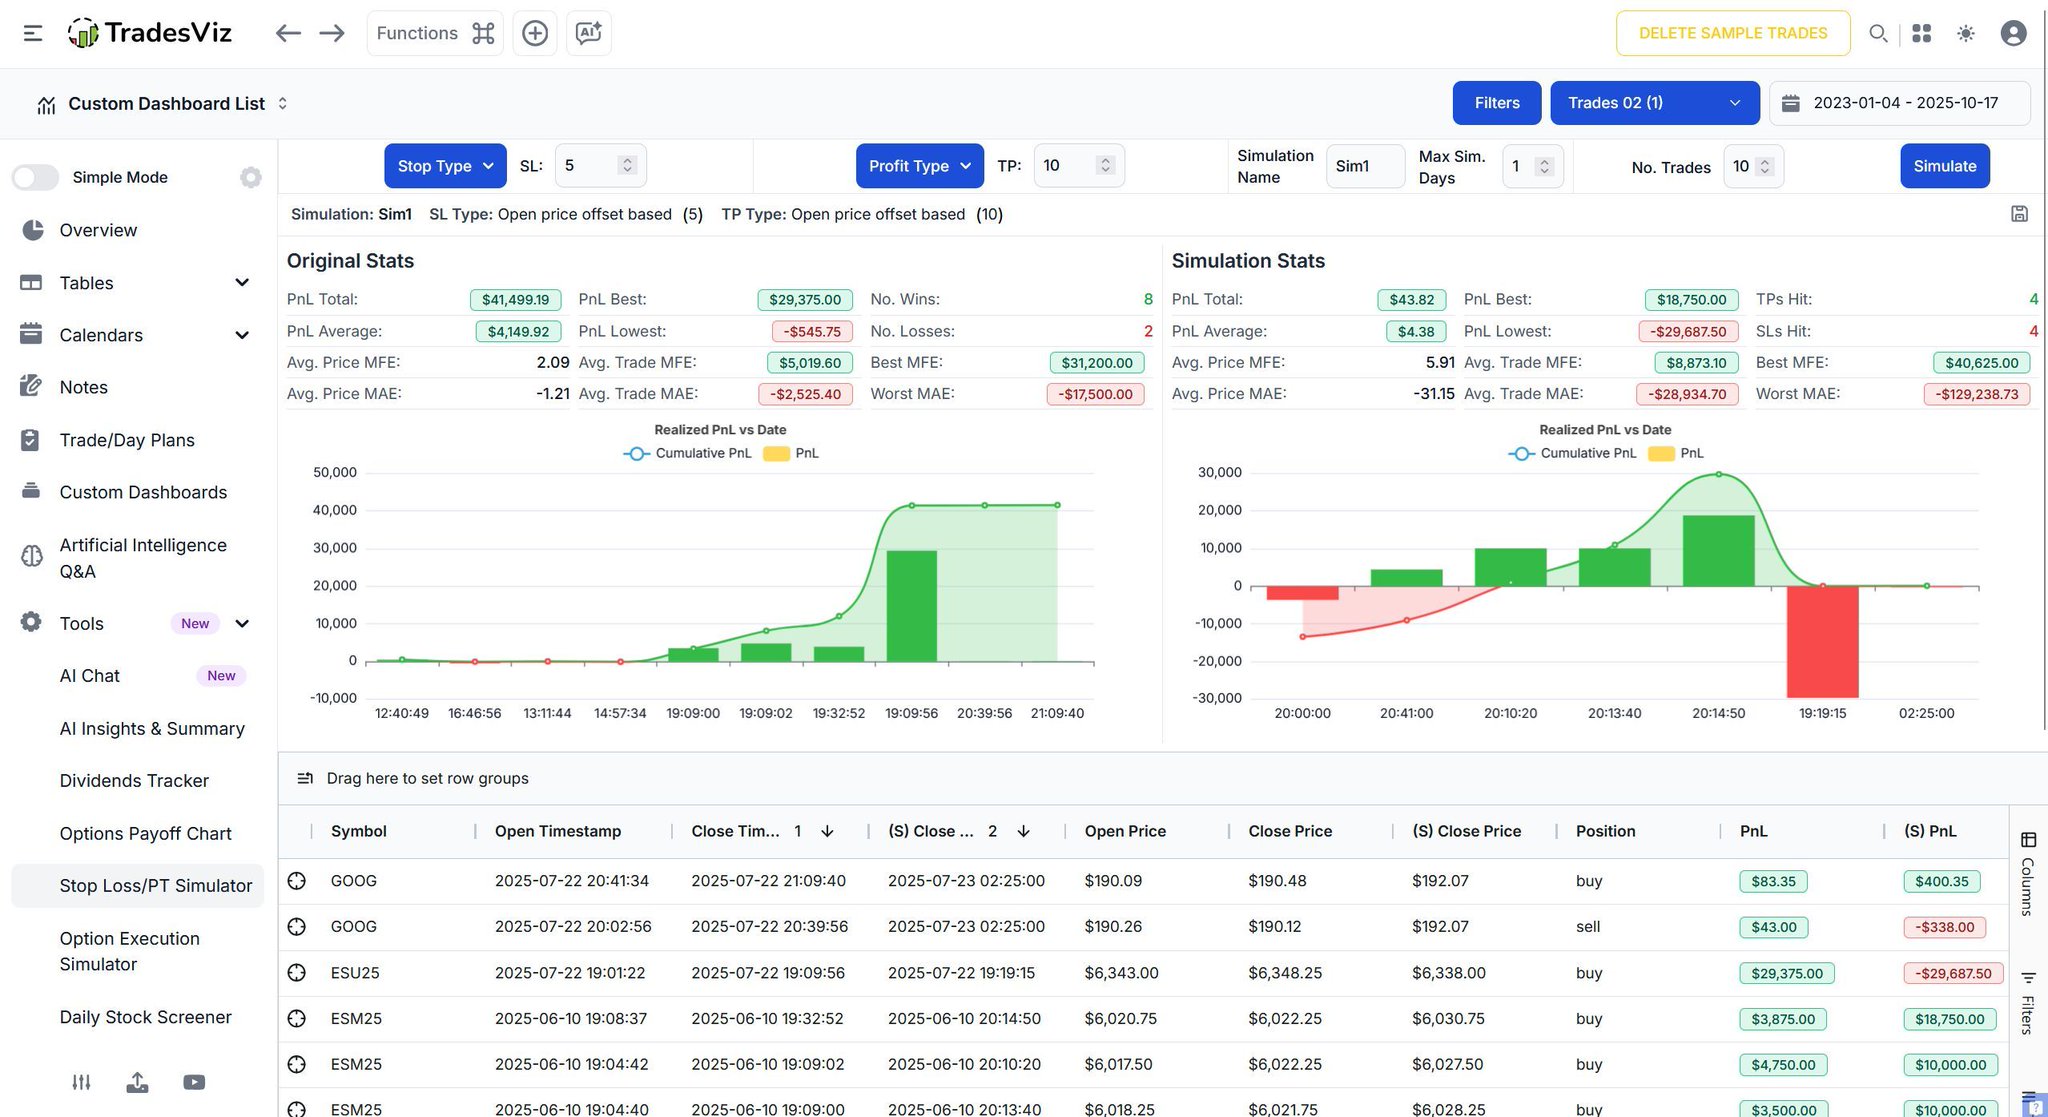
The Stop Loss / Profit Target Simulator in TradesViz gives traders a clean, data‑driven way to test trade management choices before committing capital 📊
By adjusting stop and target levels, you can see how total PnL, drawdowns, and hit ratios shift side by side.
Each simulation maps where conviction would have paid off and where tighter positioning could have preserved gains ⚙️
It’s practical, visual risk tuning — a simple tool that turns performance assumptions into measurable insight, keeping precision and control clearly on the radar 📈
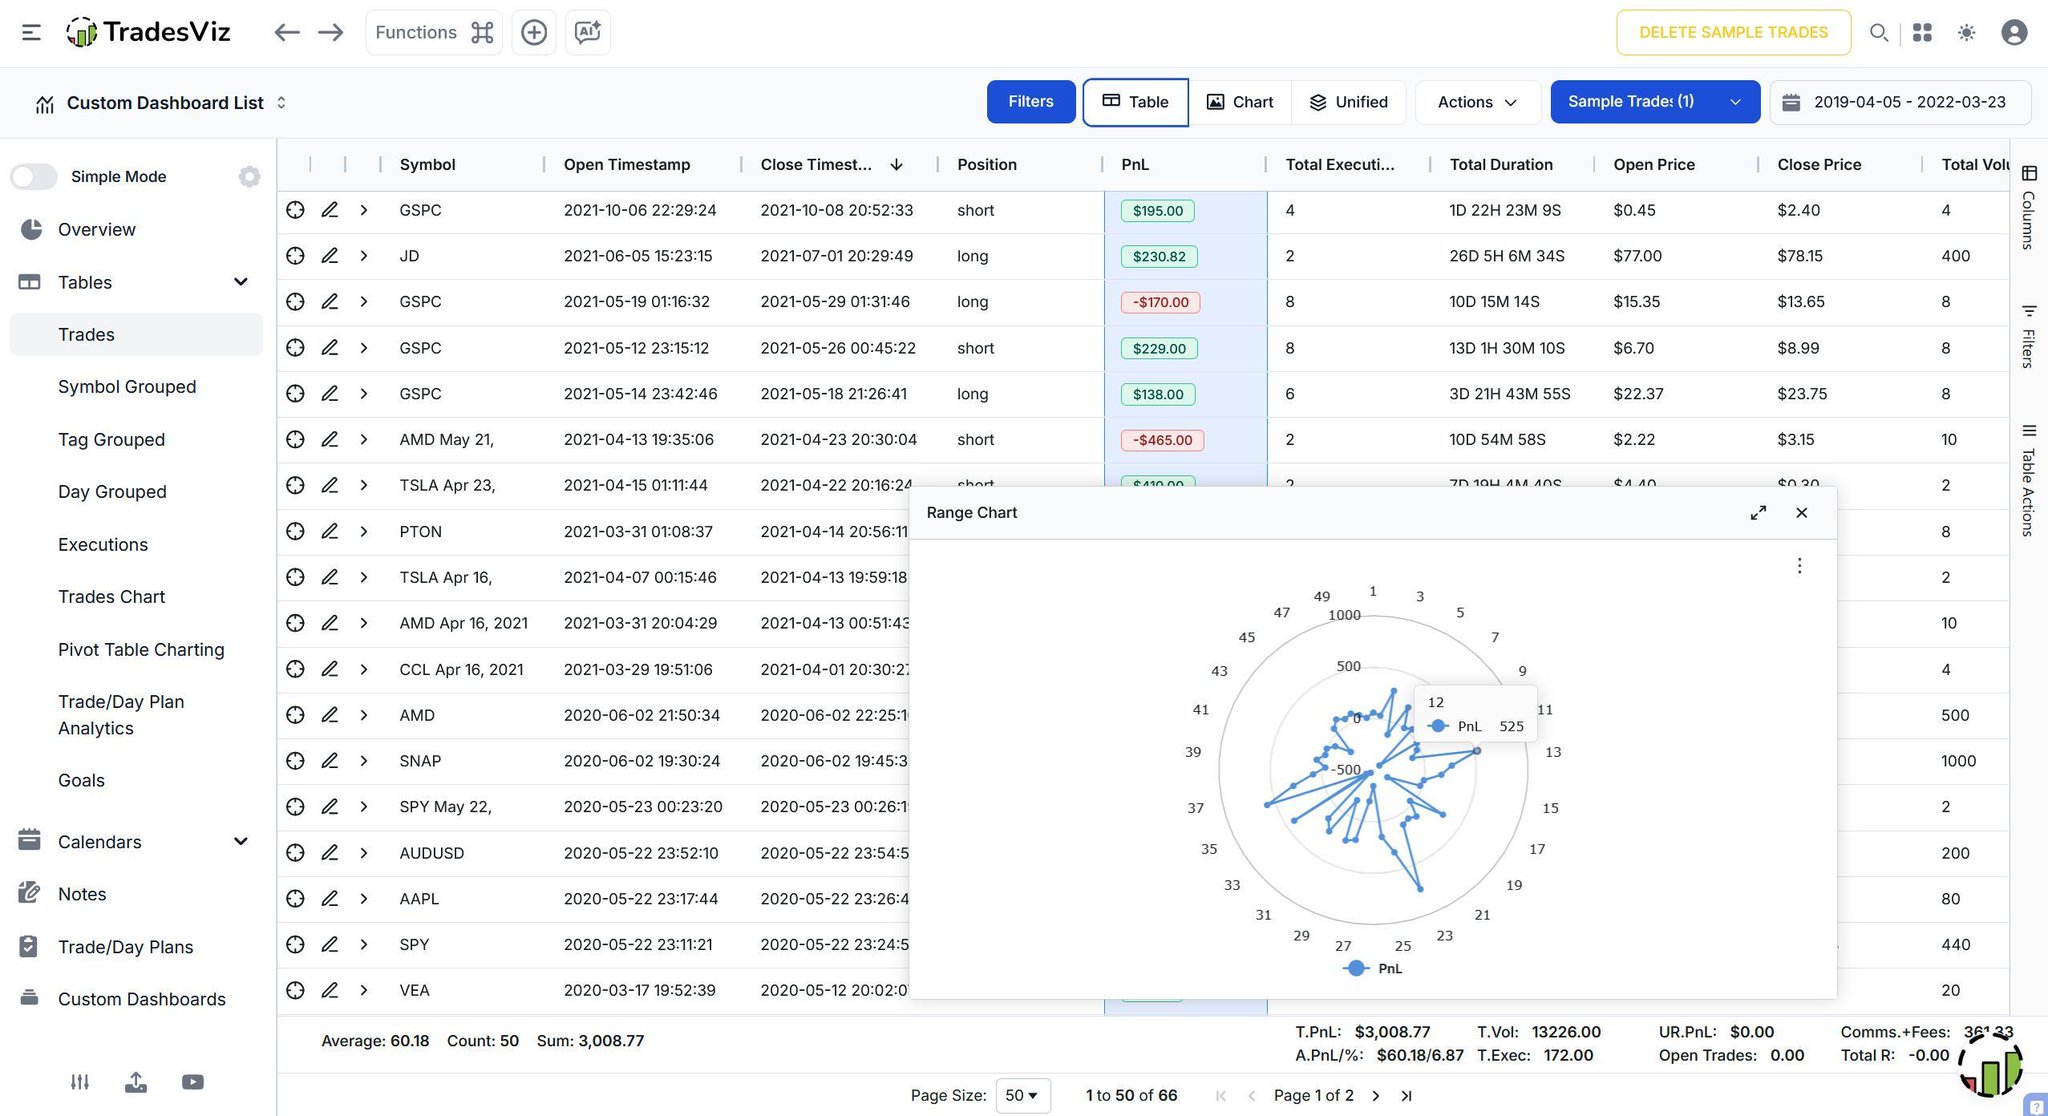
The new *Charts* in TradesViz bring a sharper, more intuitive lens to trade analysis 📊
From detailed tables to dynamic visuals like the *Range Chart*, each view connects PnL, duration, and symbol activity in one interactive layout.
It’s easy to spot where conviction piled in, when positioning shifted, and how consistency evolved over time ⚙️
Simple to use yet deeply informative — a cleaner way to study your trades and keep performance clarity always on the radar 📈
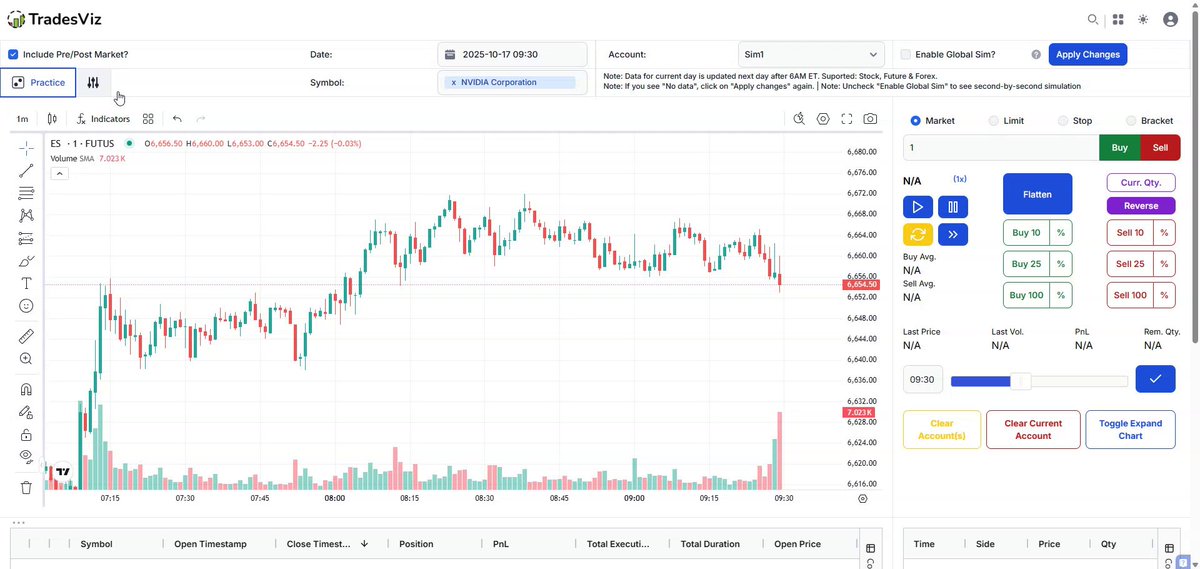
2/3 ✅ in today's practice on TradesViz simulator, we learn a lesson from $UBER... 🙂
🎲 This is the practice mode - 3 symbols practice in 90 secs - just open trades. Do you use ORB strategy?
Test yourself 👇😎
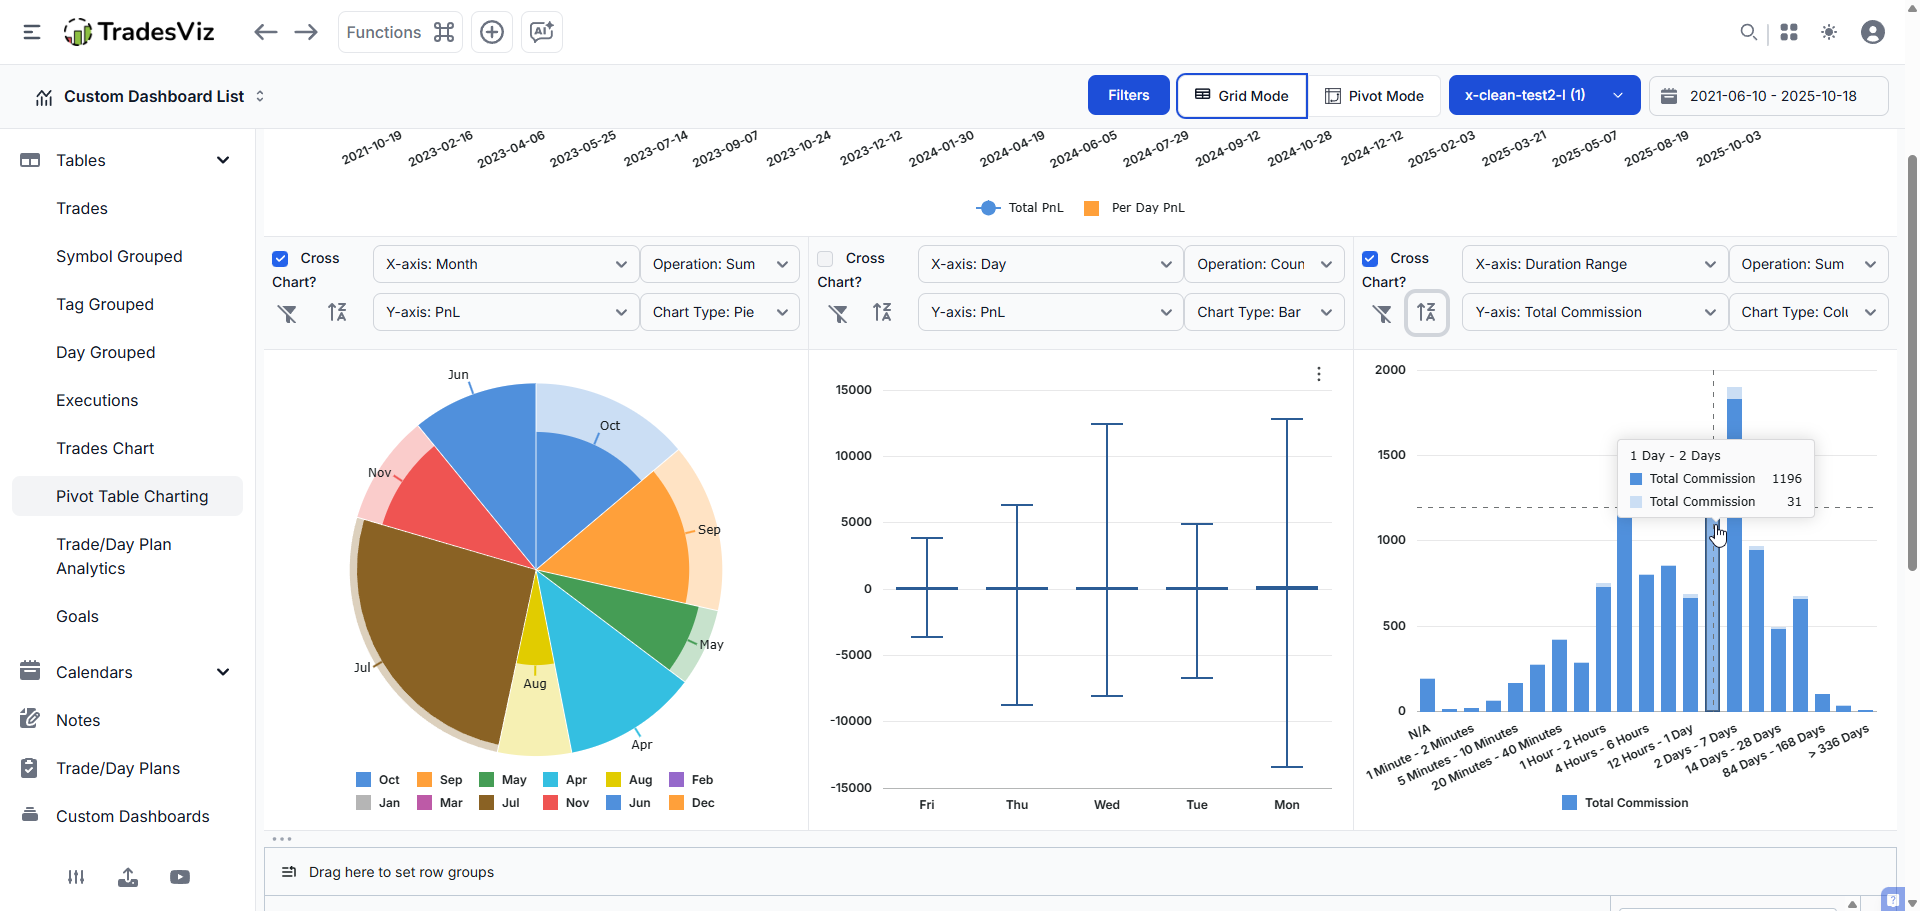
Do you spend more time _and_ money in a trade the longer in it? 🤔
Does your pnl range stay the same during the entire week? i.e, do you have "outlier" trades on say, Friday?
The pivot grid on TradesViz has answers to questions that matter.
Real trading analysis starts here.
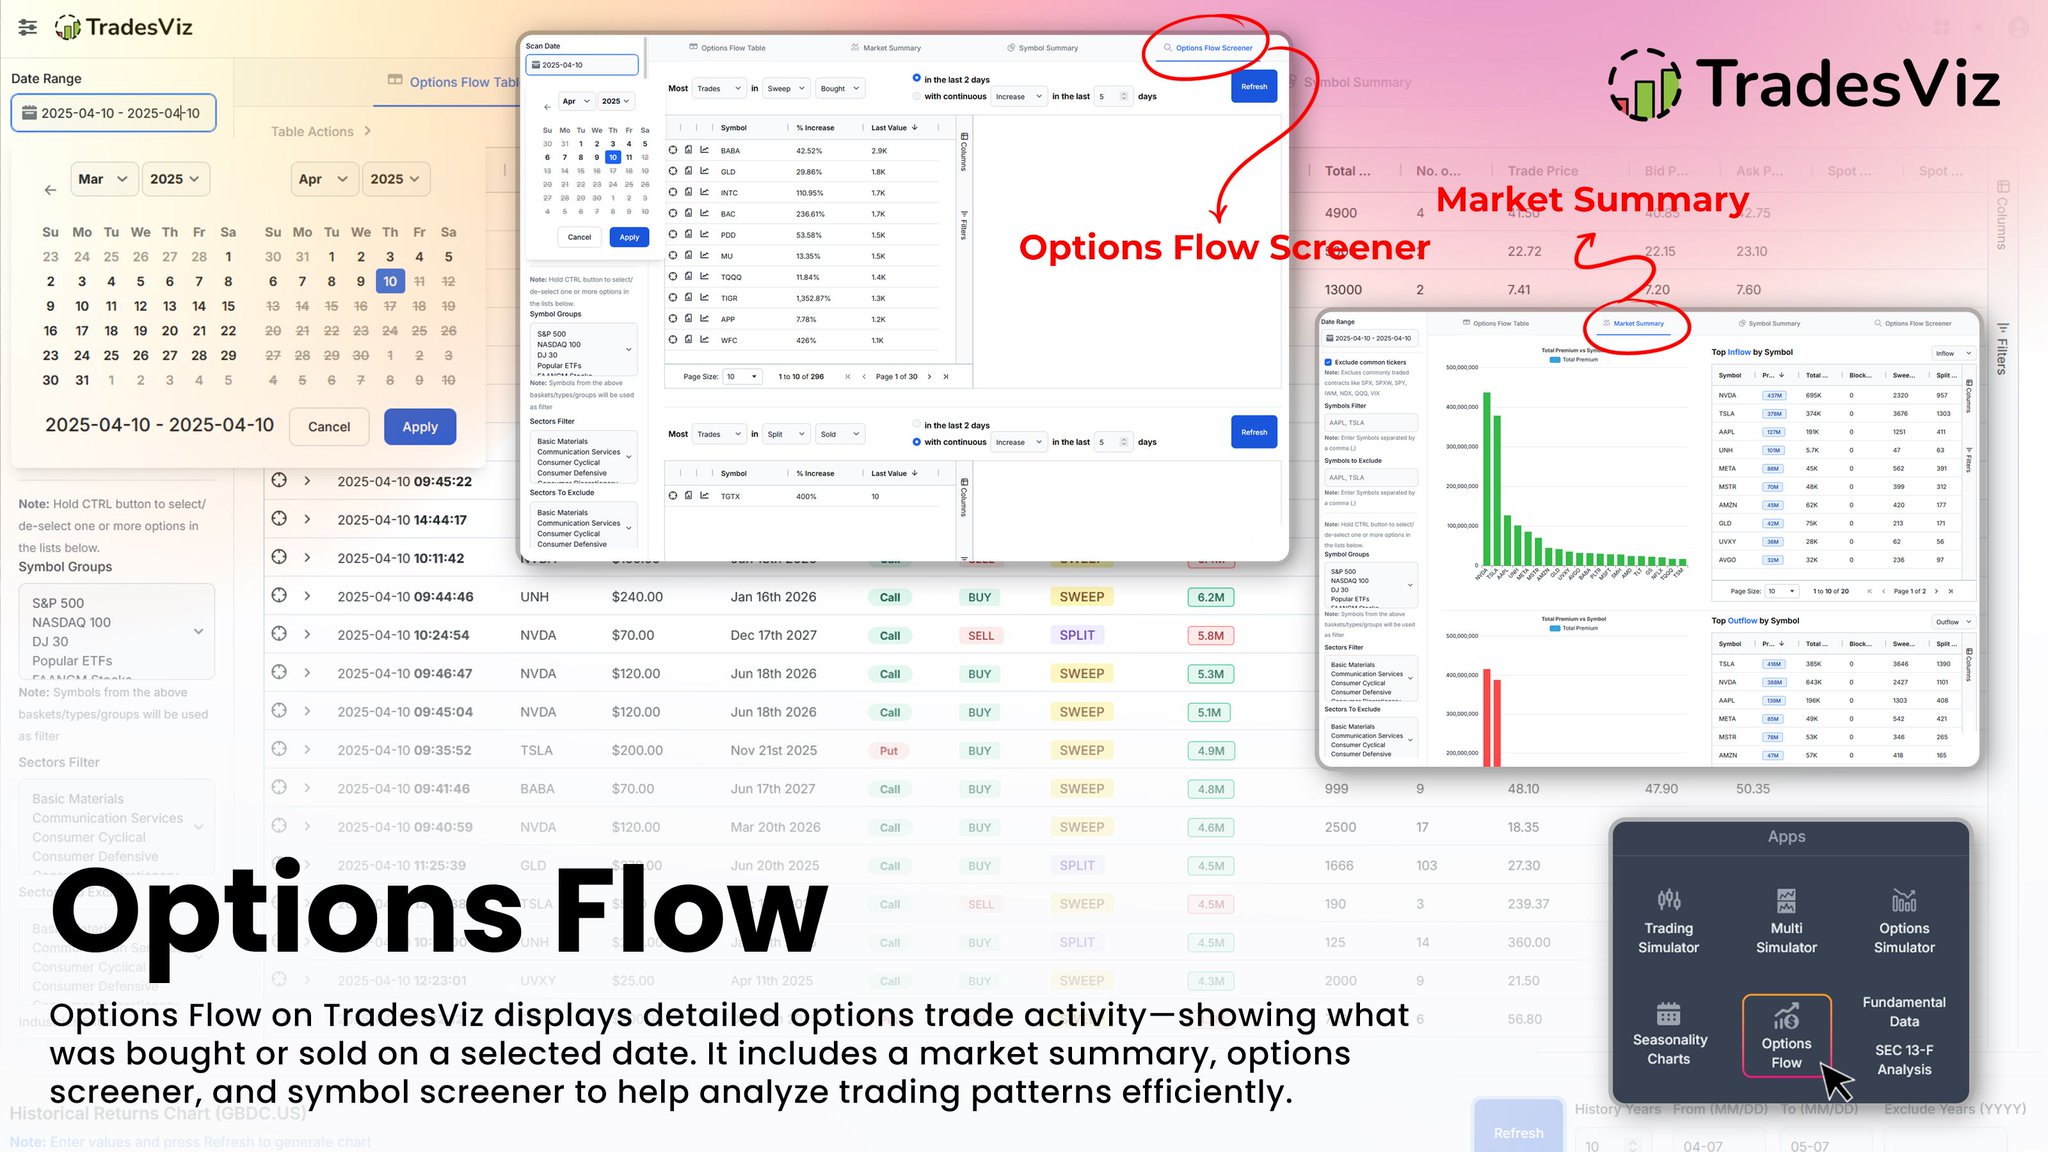
The *Options Flow* dashboard in TradesViz gives a clear read on where activity is building across the tape.
Every order, sweep, and split is organized by date, symbol, and volume — showing where conviction piled in, how positioning shifted, and which names lit up with significant flow.
The built‑in *Market Summary* and *Flow Screener* make it easy to track direction and follow consistency in real time ⚙️
It’s an efficient way to study market behavior through flow data, keeping the most active tickers and trends firmly on the radar 📈
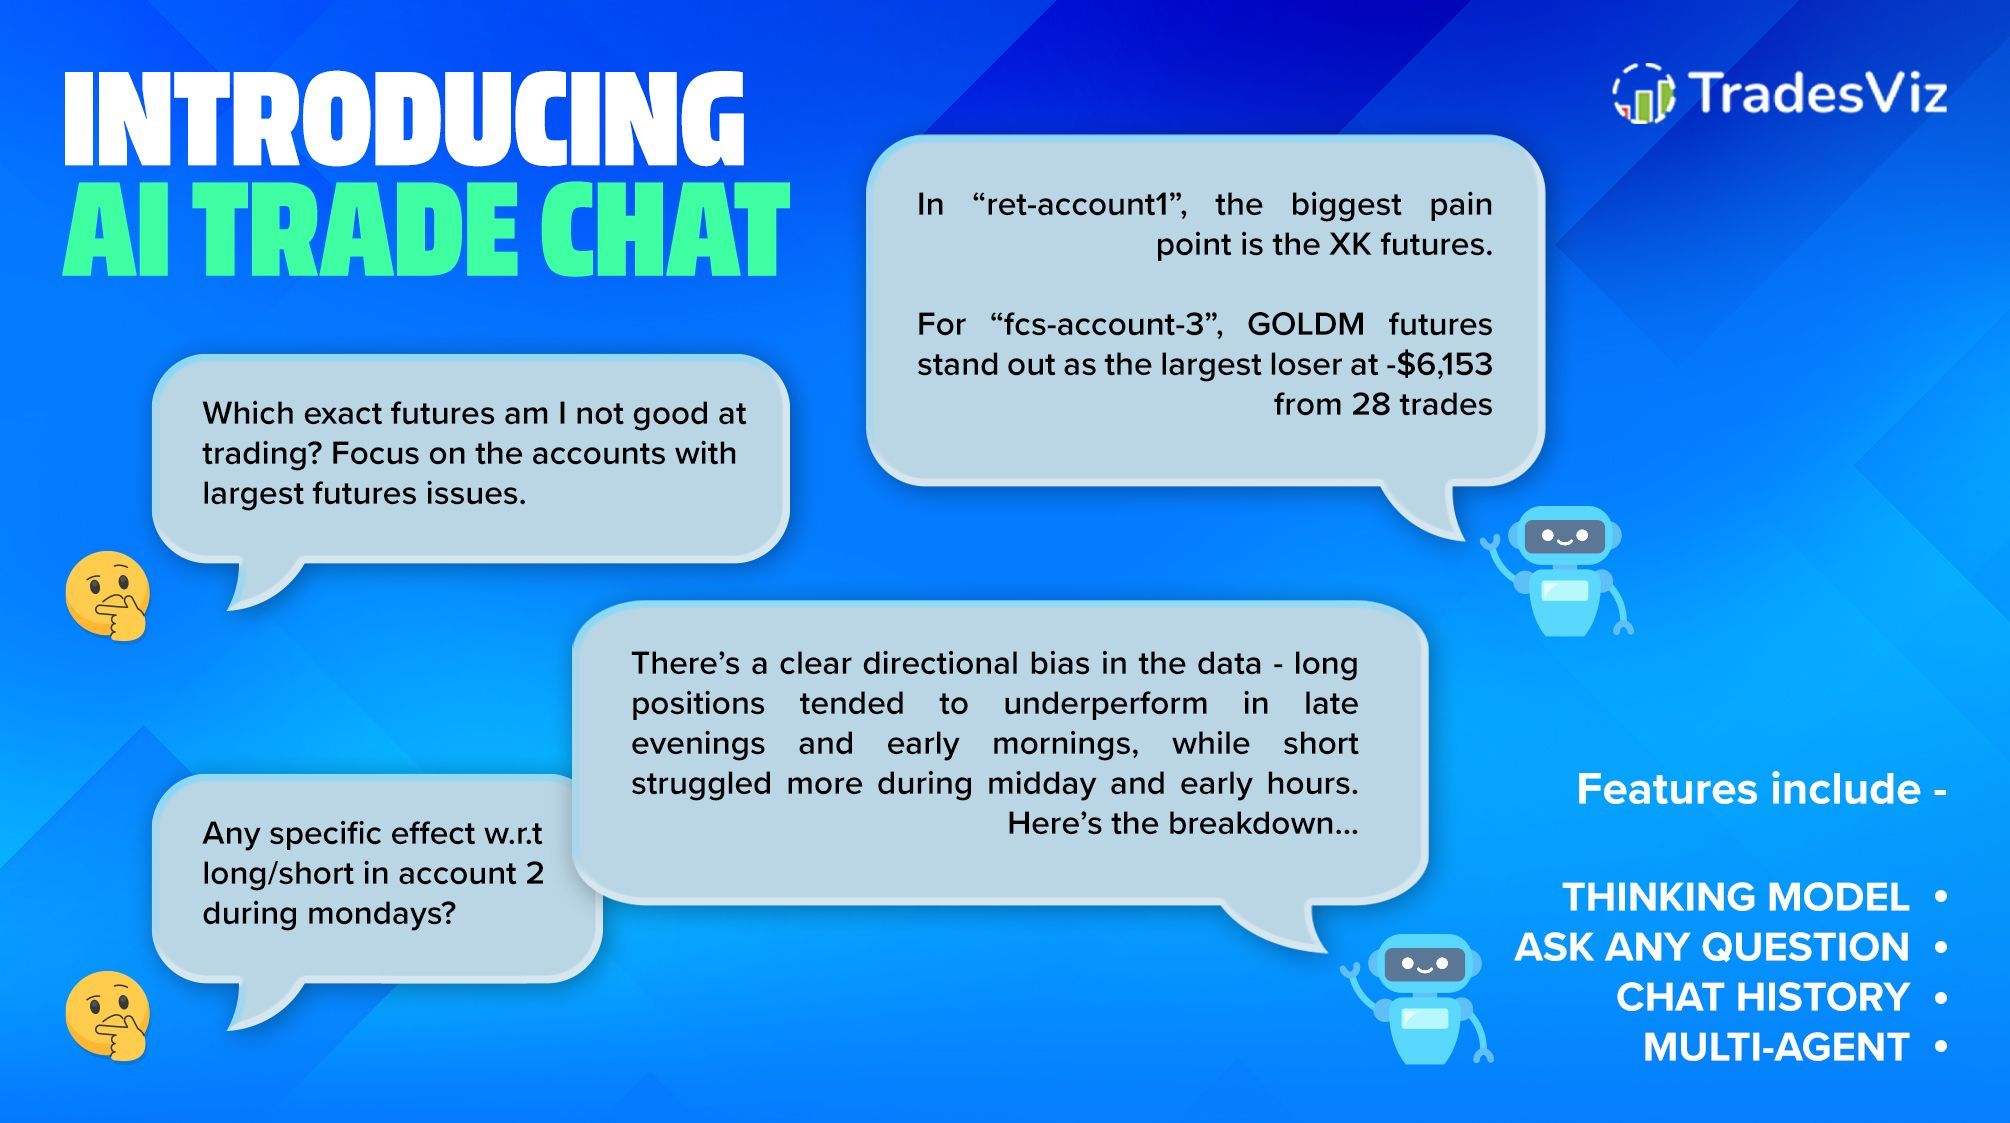
The new *AI Trade Chat* in TradesViz brings intelligent analysis directly into your workflow 🤖
Ask natural questions about performance, direction bias, or account risk, and get structured answers drawn from your own trading data.
Each response ties directly to metrics and positioning, so you see where conviction piled in — and where pressure built up ⚙️
It’s analysis that talks back, combining data awareness with context to keep clarity, precision, and insight always on the radar 📊
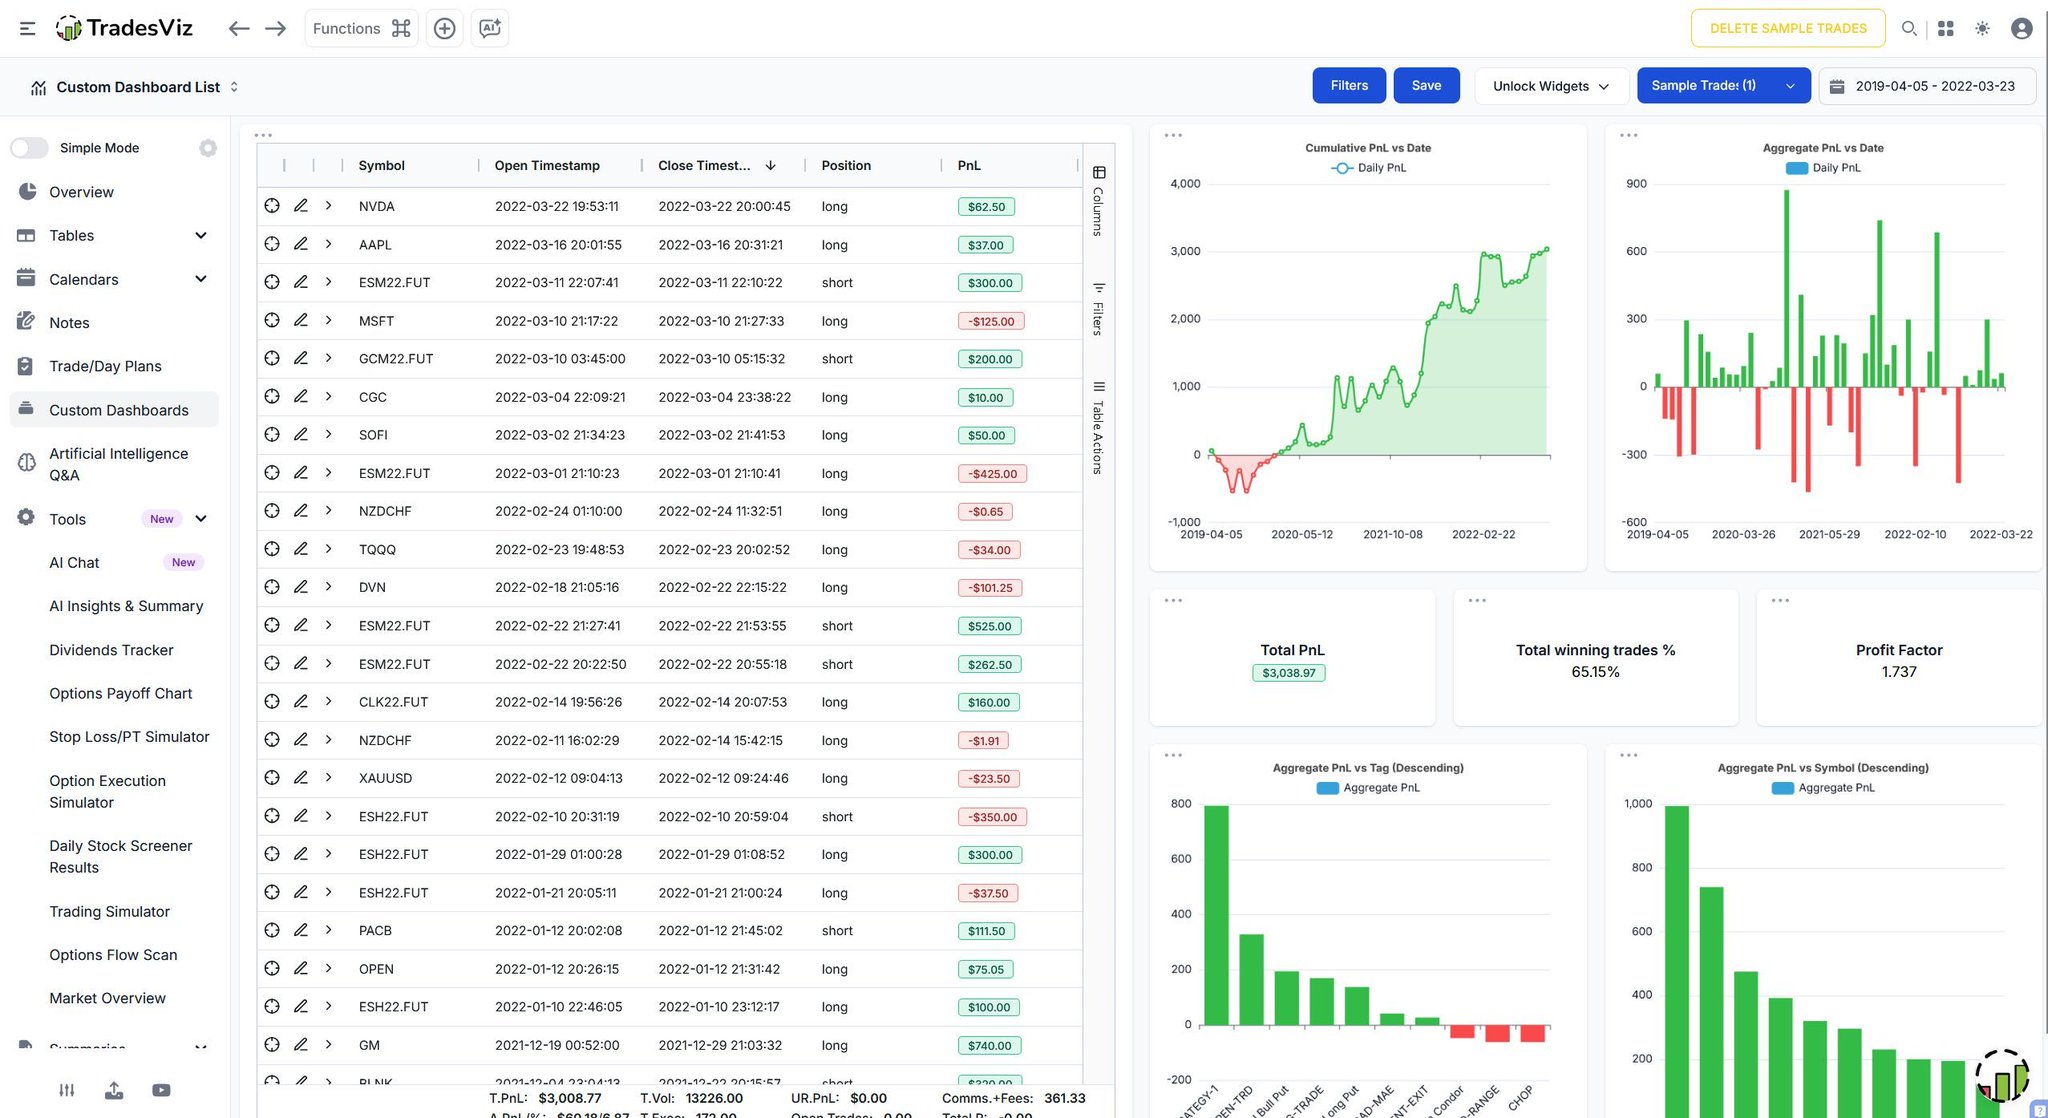
The *Custom Dashboard – Template: Table + Simple Stats 2* in TradesViz keeps analysis clean, functional, and directly tied to the tape 📊
Each trade lines up in a structured table beside concise visuals of cumulative PnL, aggregate returns, and summary stats. You see exactly how conviction translated into consistency — where positioning lit up and where flow thinned out ⚙️
It’s a ready‑made layout built for clarity. Fast, balanced, and fully customizable to your tracking style — keeping total performance and efficiency always on the radar 📈
🎉 𝗡𝗘𝗪 𝗟𝗔𝗨𝗡𝗖𝗛 -> AI Trade Chat: A full ChatGPT in your journal, personalized ONLY for you - fully under your control.
Ask any question.
Have insightful discussions (thinking models).
Save/export all of your conversations.
Future of trade journaling + anlaysis on TradesViz 🤖👇
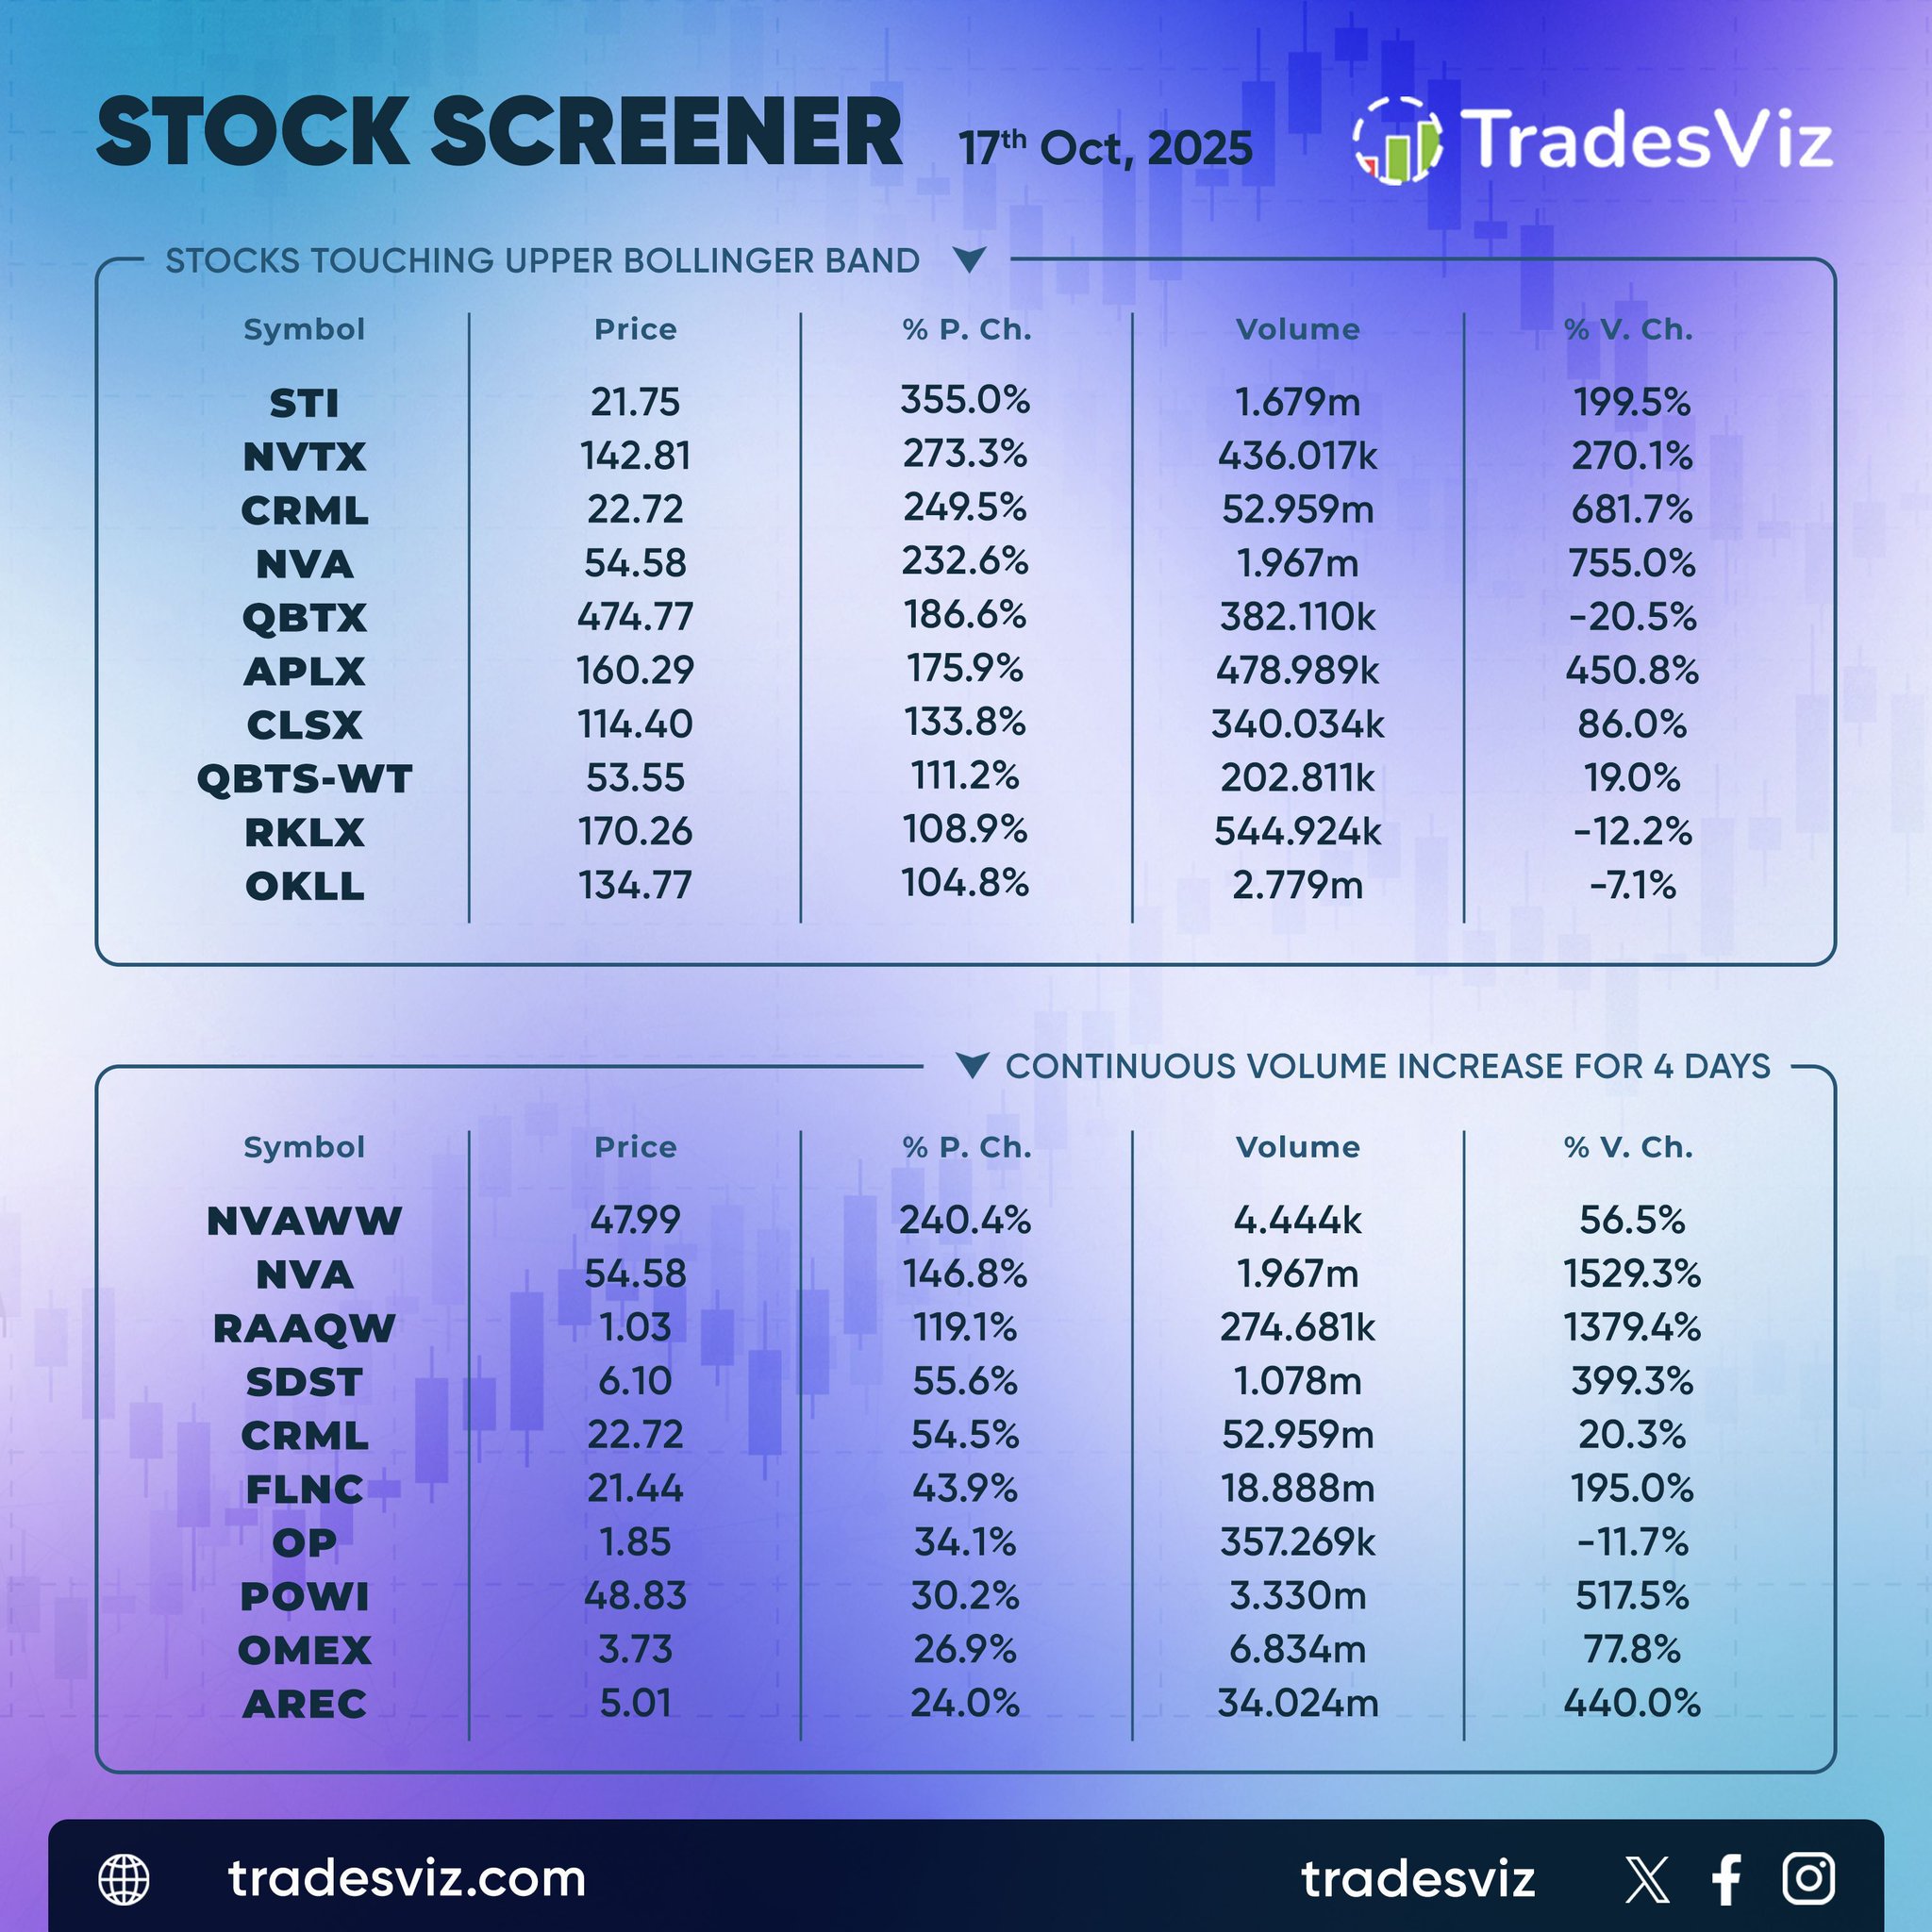
Momentum stayed in full control on Oct 17 as speculative names ripped through upper Bollinger levels. $STI led with a massive 355% gain on nearly 1.7M shares, marking one of the strongest single‑day extensions on record. $NVTK and $CRML followed with 273% and 249% moves, each backed by multi‑hundred‑percent increases in volume—clear conviction flow rather than noise.
Follow‑through remained broad, with $QBTX, $APLX, and $CLSX all notching 175–185% rallies fueled by persistent inflows. $RKLY and $OKLL also held firm above 100% gains despite late‑session cooling, evidence of sustained speculative appetite.
Volume streaks were equally aggressive. $NVAVW surged 240% as turnover climbed four straight sessions, while $SDST, $FLNC, and $AREC extended momentum with triple‑digit percentage volume gains.
When breakouts stack with accelerating volume across multiple sessions, it signals a deep risk‑on rotation and accumulation phase rather than fleeting momentum.
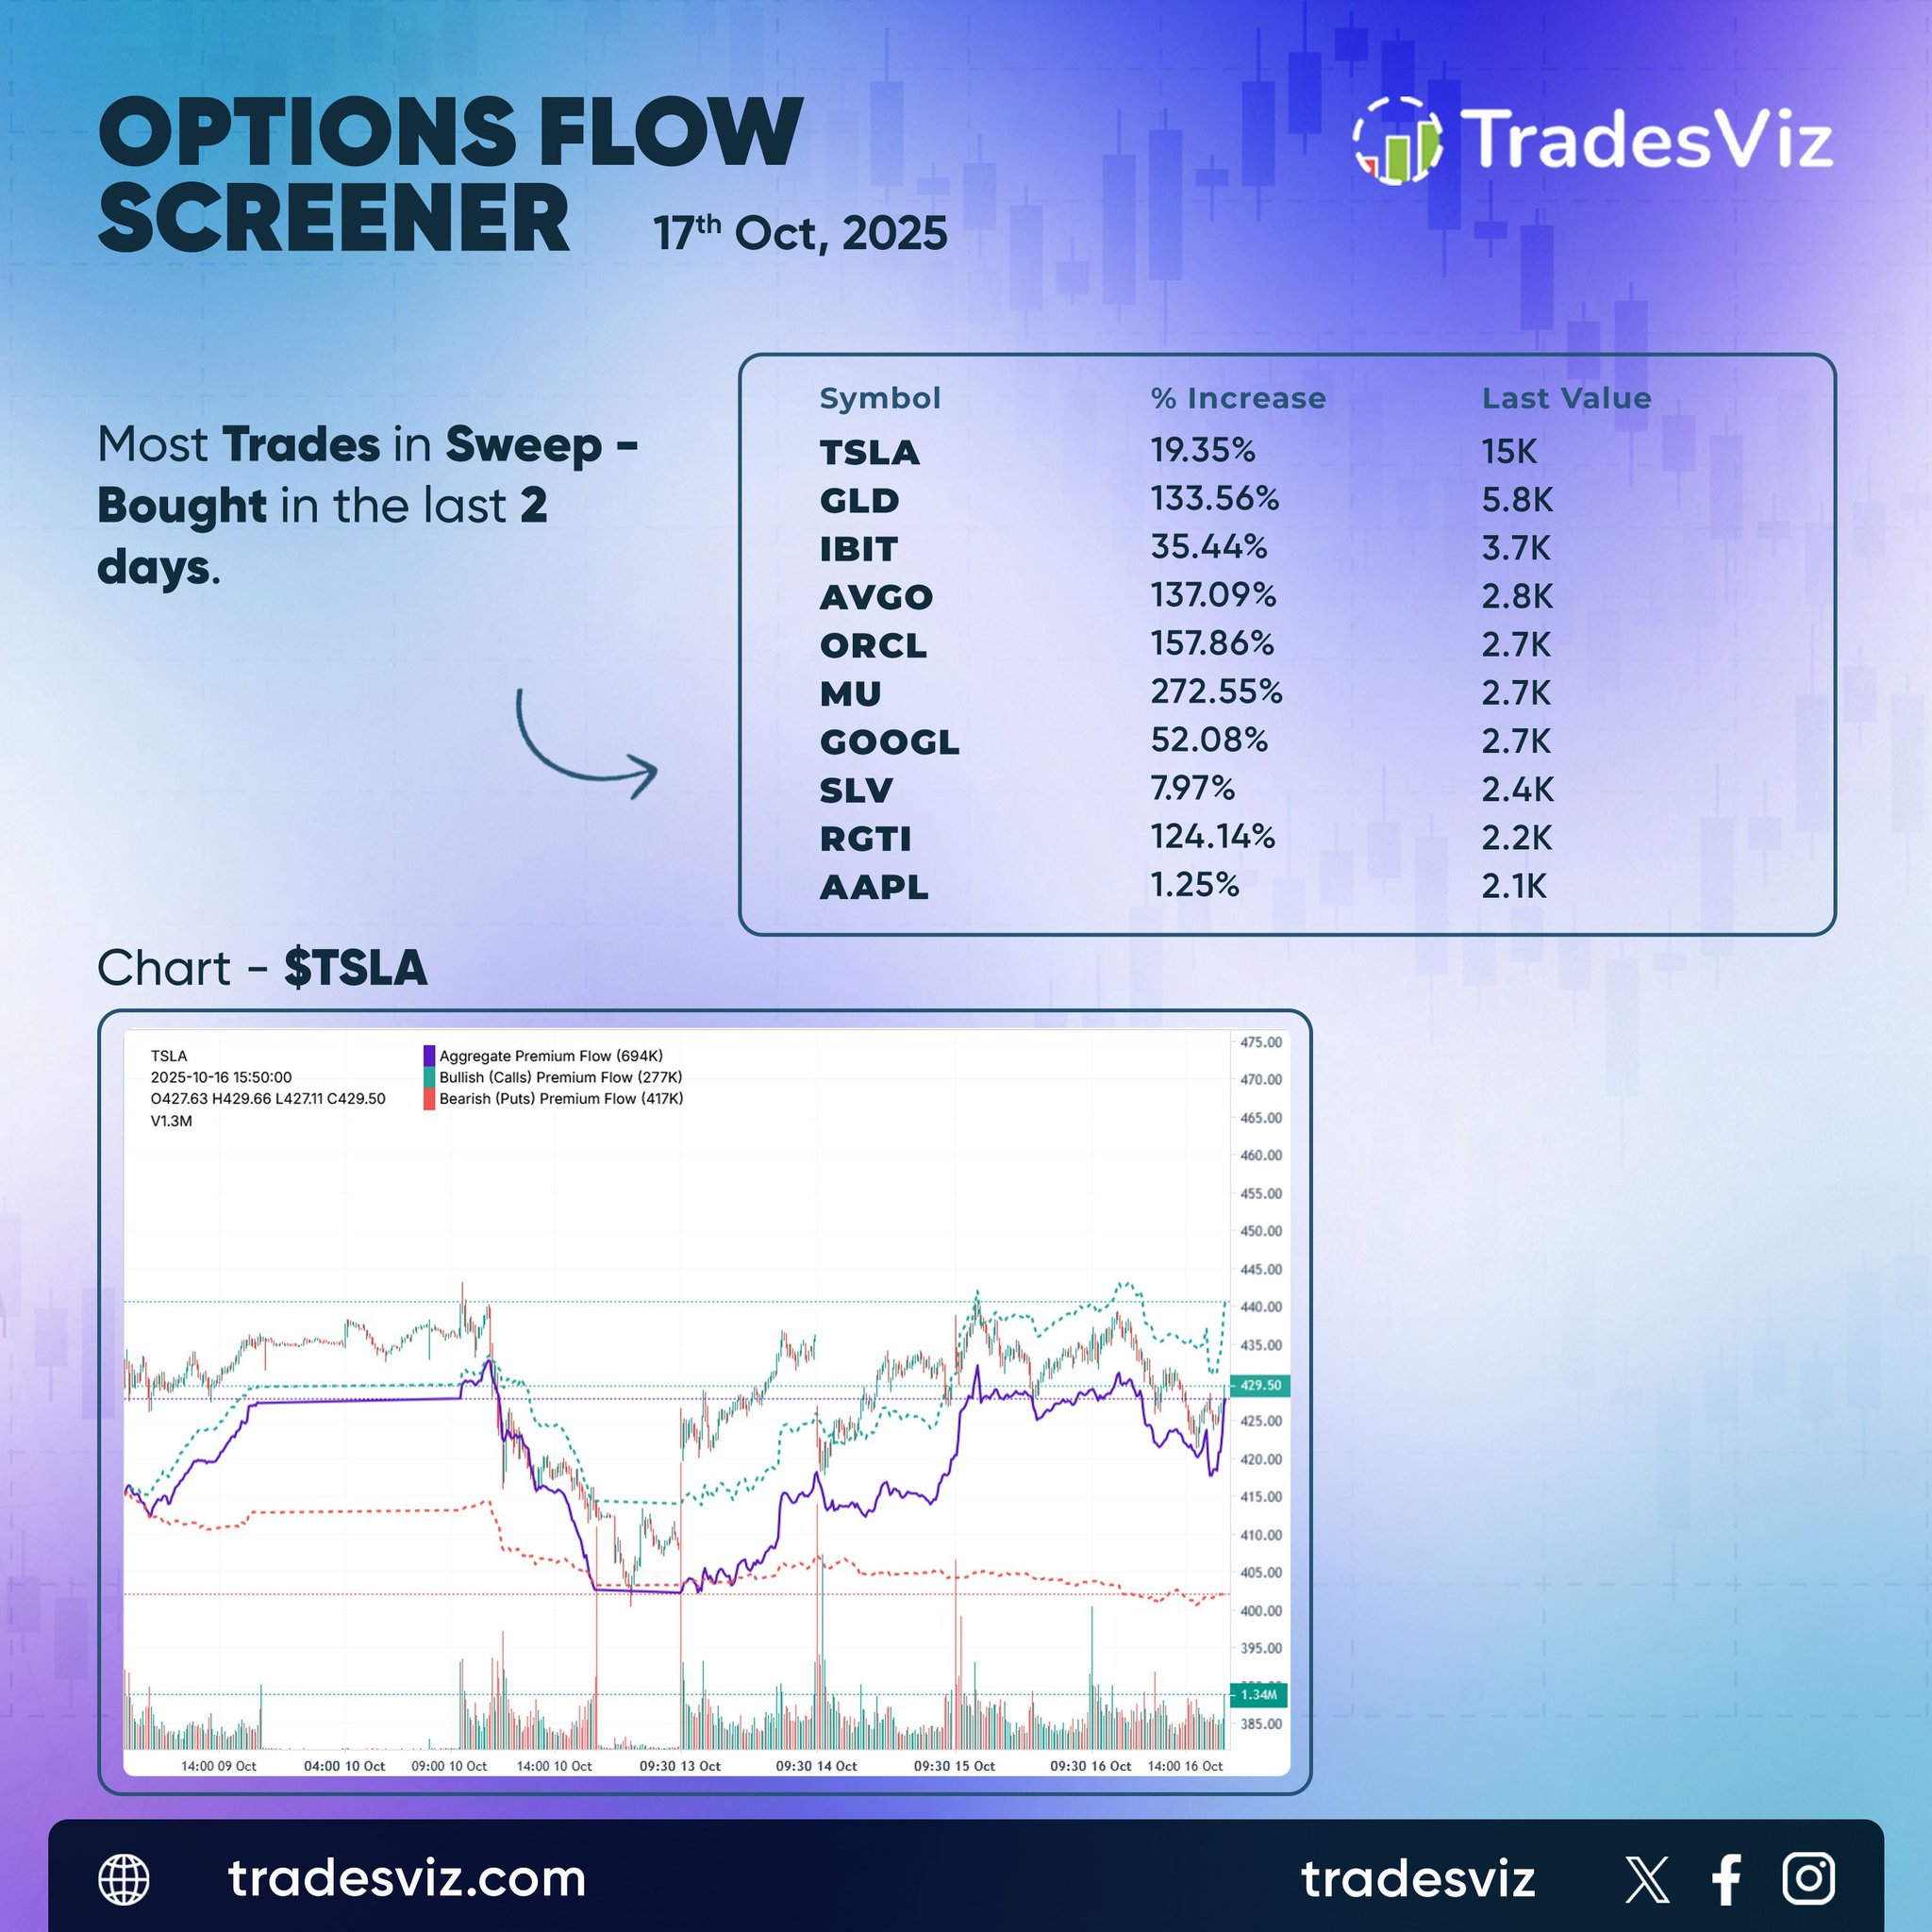
The Oct 17 options flow screen highlighted surging sweep activity across major tech and metals names, led by a sharp buildup in $TSLA. The stock posted a 19% increase in sweep trades with more than 15K contracts bought in the last two days, confirming short‑term accumulation pressure.
$MU and $ORCL showed the strongest momentum, up 272% and 158% respectively, while $AVGO and $GLD each recorded triple‑digit jumps — signaling heavy two‑way interest spanning both growth and defensive sectors.
Volume expansion in $IBIT and $RGTI reflects continued speculative appetite, while $AAPL’s modest uptick suggests steady participation rather than breakout buying.
Broadly, multi‑sector sweep inflows point to continued risk‑on posture, though the surge in $GLD and $SLV implies traders are balancing growth exposure with tactical hedging. The tape shows conviction diversifying across themes.